North Durham | |
---|---|
County constituency for the House of Commons | |
County | Durham |
Electorate | 68,959 (December 2010) [1] |
Major settlements | Chester-le-Street, Stanley and Sacriston |
Current constituency | |
Created | 1983 |
Member of Parliament | Kevan Jones (Labour) |
Seats | One |
Created from | Chester-le-Street Consett |
1832–1885 | |
Seats | Two |
Type of constituency | County constituency |
Created from | Durham |
Replaced by | Jarrow Houghton-le-Spring Chester-le-Street Mid Durham North West Durham |
North Durham is a constituency [n 1] represented in the House of Commons of the UK Parliament since 2001 by Kevan Jones of the Labour Party. [n 2]
A constituency formally named the Northern Division of Durham was created by the Great Reform Act for the 1832 general election, when the former Durham constituency was split into the northern and southern divisions, each electing two members using the bloc vote system. [2]
This seat was abolished by the Redistribution of Seats Act 1885 when the two divisions were replaced by eight single-member divisions. [3] These were Barnard Castle, Bishop Auckland, Chester-le-Street, Houghton-le-Spring, Jarrow, Mid Durham, North West Durham and South East Durham. [4] In addition there were seven County Durham borough constituencies.
The seat was re-created as a single-seat constituency for the 1983 general election as a result of the redistribution following the changes to local authority boundaries under the Local Government Act 1972. The new constituency comprised those parts of the abolished Chester-le-Street constituency retained within the reconstituted county of Durham, together with those parts of the abolished Consett constituency which had comprised the urban district of Stanley.
See map on Vision of Britain website. [5]
Included non-resident 40 shilling freeholders in the parliamentary boroughs of Durham, Gateshead, South Shields and Sunderland.
Burnopfield and Dipton wards were transferred to the redrawn North West Durham.
The 1997 boundaries were retained despite the official description of the constituency changing slightly in terms of the names of the local authority wards.
The constituency spans the north of County Durham in North East England. It includes the whole of the former Chester-le-Street district and the eastern part of the former Derwentside district. The main population centres (large settlements) are Chester-le-Street, Stanley and Sacriston. The constituency includes the North of England Open Air Museum at Beamish. [9]
Further to the 2023 Periodic Review of Westminster constituencies, enacted by the Parliamentary Constituencies Order 2023, from the 2024 United Kingdom general election, the constituency will be composed of the following electoral divisions of the County of Durham (as they existed on 1 December 2020):
Annfield Plain; Chester-le-Street East; Chester-le-Street North; Chester-le-Street South; Chester-le-Street West Central; Craghead and South Moor; Lanchester; Lumley; North Lodge; Pelton; Sacriston; Stanley; Tanfield. [10]
Election | Member [11] | Party | |
---|---|---|---|
1983 | Giles Radice | Labour | |
2001 | Kevan Jones | Labour |
Party | Candidate | Votes | % | ±% | |
---|---|---|---|---|---|
Labour | Luke Akehurst [20] | ||||
Independent | David Lindsay [21] | ||||
SDP | Tom Chittenden [22] | ||||
Reform UK | Andrew Husband [23] | ||||
Liberal Democrats | Craig Martin [24] | ||||
Green | Sunny Moon-Schott [25] | ||||
Majority | |||||
Turnout |
Party | Candidate | Votes | % | ±% | |
---|---|---|---|---|---|
Labour | Kevan Jones | 18,639 | 44.2 | –15.7 | |
Conservative | Edward Parson | 13,897 | 32.9 | +2.9 | |
Brexit Party | Peter Telford | 4,693 | 11.1 | New | |
Liberal Democrats | Craig Martin | 2,879 | 6.8 | +2.2 | |
Green | Derek Morse | 1,126 | 2.7 | New | |
Independent | Ken Rollings | 961 | 2.3 | New | |
Majority | 4,742 | 11.3 | –18.6 | ||
Turnout | 42,195 | 63.2 | –1.4 | ||
Labour hold | Swing | –9.3 | |||
Party | Candidate | Votes | % | ±% | |
---|---|---|---|---|---|
Labour | Kevan Jones | 25,917 | 59.9 | +5.0 | |
Conservative | Laetitia Glossop [28] | 12,978 | 30.0 | +9.1 | |
UKIP | Kenneth Rollings [29] | 2,408 | 5.6 | –10.4 | |
Liberal Democrats | Craig Martin | 1,981 | 4.6 | –0.5 | |
Majority | 12,939 | 29.9 | –4.1 | ||
Turnout | 43,284 | 64.6 | +3.2 | ||
Labour hold | Swing | –2.0 | |||
Party | Candidate | Votes | % | ±% | |
---|---|---|---|---|---|
Labour | Kevan Jones | 22,047 | 54.9 | +4.4 | |
Conservative | Laetitia Glossop [31] | 8,403 | 20.9 | –0.1 | |
UKIP | Malcolm Bint [32] | 6,404 | 16.0 | +12.7 | |
Liberal Democrats | Peter Maughan [33] | 2,046 | 5.1 | –15.9 | |
Green | Victoria Nolan [34] | 1,246 | 3.1 | New | |
Majority | 13,644 | 34.0 | +4.5 | ||
Turnout | 40,146 | 61.4 | +0.8 | ||
Labour hold | Swing | +2.3 | |||
Party | Candidate | Votes | % | ±% | |
---|---|---|---|---|---|
Labour | Kevan Jones | 20,698 | 50.5 | −13.6 | |
Conservative | David Skelton | 8,622 | 21.0 | +4.2 | |
Liberal Democrats | Ian Lindley | 8,617 | 21.0 | +1.9 | |
BNP | Peter Molloy | 1,686 | 4.1 | New | |
UKIP | Bruce Reid | 1,344 | 3.3 | New | |
Majority | 12,076 | 29.5 | –15.4 | ||
Turnout | 40,967 | 60.6 | +5.3 | ||
Labour hold | Swing | −8.9 | |||
Party | Candidate | Votes | % | ±% | |
---|---|---|---|---|---|
Labour | Kevan Jones | 23,932 | 64.1 | −3.1 | |
Liberal Democrats | Philip Latham | 7,151 | 19.2 | +5.2 | |
Conservative | Mark Watson | 6,258 | 16.8 | −2.0 | |
Majority | 16,781 | 44.9 | -3.5 | ||
Turnout | 37,341 | 55.3 | −1.6 | ||
Labour hold | Swing | -4.1 | |||
Party | Candidate | Votes | % | ±% | |
---|---|---|---|---|---|
Labour | Kevan Jones | 25,920 | 67.2 | −3.1 | |
Conservative | Matthew R. Palmer | 7,237 | 18.8 | +4.3 | |
Liberal Democrats | Carole A. Field | 5,411 | 14.0 | +2.9 | |
Majority | 18,683 | 48.4 | -7.4 | ||
Turnout | 38,568 | 56.9 | −12.3 | ||
Labour hold | Swing | ||||
Party | Candidate | Votes | % | ±% | |
---|---|---|---|---|---|
Labour | Giles Radice | 33,142 | 70.3 | +10.4 | |
Conservative | Mark T. Hardy | 6,843 | 14.5 | -10.3 | |
Liberal Democrats | Brian D. Moore | 5,225 | 11.1 | -4.2 | |
Referendum | Ian A.C. Parkin | 1,958 | 4.2 | New | |
Majority | 26,299 | 55.8 | +20.7 | ||
Turnout | 47,168 | 69.2 | -6.9 | ||
Labour hold | Swing | ||||
Party | Candidate | Votes | % | ±% | |
---|---|---|---|---|---|
Labour | Giles Radice | 33,567 | 59.9 | +3.7 | |
Conservative | Elizabeth A. Sibley | 13,930 | 24.8 | +3.6 | |
Liberal Democrats | Philip J. Appleby | 8,572 | 15.3 | −7.3 | |
Majority | 19,637 | 35.1 | +1.5 | ||
Turnout | 56,069 | 76.1 | +0.2 | ||
Labour hold | Swing | −0.0 | |||
Party | Candidate | Votes | % | ±% | |
---|---|---|---|---|---|
Labour | Giles Radice | 30,798 | 56.2 | +5.2 | |
SDP | Derek Jeary | 12,365 | 22.6 | −2.4 | |
Conservative | Nicholas Gibbon | 11,602 | 21.2 | −2.8 | |
Majority | 18,433 | 33.6 | +7.6 | ||
Turnout | 54,765 | 75.9 | +3.2 | ||
Labour hold | Swing | +3.9 | |||
Party | Candidate | Votes | % | ±% | |
---|---|---|---|---|---|
Labour | Giles Radice | 26,404 | 51.0 | ||
Liberal | David Howarth | 12,967 | 25.0 | ||
Conservative | Andrew Popat | 12,418 | 24.0 | ||
Majority | 13,437 | 26.0 | |||
Turnout | 51,789 | 72.7 | |||
Labour win (new seat) |
Party | Candidate | Votes | % | ±% | |
---|---|---|---|---|---|
Conservative | George Elliot | 5,548 | 53.1 | +23.5 | |
Liberal | James Laing [46] | 4,896 | 46.9 | −23.6 | |
Majority | 652 | 6.2 | N/A | ||
Turnout | 10,444 | 78.9 | −7.1 (est) | ||
Registered electors | 13,233 | ||||
Conservative gain from Liberal | Swing | +23.6 | |||
Party | Candidate | Votes | % | ±% | |
---|---|---|---|---|---|
Liberal | John Joicey | 6,233 | 36.2 | +9.3 | |
Liberal | Charles Palmer | 5,901 | 34.3 | +7.7 | |
Conservative | George Elliot | 5,092 | 29.6 | +4.8 | |
Majority | 809 | 4.7 | +2.8 | ||
Turnout | 11,325 (est) | 86.0 (est) | +10.7 | ||
Registered electors | 13,165 | ||||
Liberal hold | Swing | ||||
Party | Candidate | Votes | % | ±% | |
---|---|---|---|---|---|
Liberal | Charles Palmer | 4,256 | 33.7 | +7.0 | |
Conservative | George Elliot | 4,254 | 33.7 | −12.7 | |
Liberal | Lowthian Bell | 4,104 | 32.5 | +5.6 | |
Turnout | 8,434 (est) | 78.4 | +3.1 | ||
Registered electors | 10,760 | ||||
Majority | 2 | 0.0 | -2.1 | ||
Liberal hold | Swing | +6.7 | |||
Majority | 150 | 1.2 | N/A | ||
Conservative gain from Liberal | Swing | −6.0 | |||
Party | Candidate | Votes | % | ±% | |
---|---|---|---|---|---|
Liberal | Lowthian Bell | 4,364 | 26.9 | −3.7 | |
Liberal | Charles Palmer | 4,327 | 26.7 | −5.4 | |
Conservative | George Elliot | 4,011 | 24.8 | +6.2 | |
Conservative | Richard Laurence Pemberton [47] | 3,501 | 21.6 | +3.0 | |
Majority | 353 | 2.1 | N/A | ||
Turnout | 8,102 (est) | 75.3 (est) | −5.7 | ||
Registered electors | 10,760 | ||||
Liberal gain from Conservative | Swing | −3.4 | |||
Liberal hold | Swing | −5.8 | |||
Party | Candidate | Votes | % | ±% | |
---|---|---|---|---|---|
Conservative | George Elliot | 4,649 | 37.2 | +8.8 | |
Liberal | Hedworth Williamson | 4,011 | 32.1 | −5.0 | |
Liberal | Lowthian Bell | 3,822 | 30.6 | −3.9 | |
Majority | 827 | 6.6 | N/A | ||
Turnout | 8,566 (est) | 81.0 (est) | −1.7 | ||
Registered electors | 10,576 | ||||
Conservative gain from Liberal | Swing | +4.2 | |||
Liberal hold | Swing | −4.7 | |||
Party | Candidate | Votes | % | ±% | |
---|---|---|---|---|---|
Liberal | Hedworth Williamson | 2,888 | 37.1 | N/A | |
Liberal | Robert Duncombe Shafto | 2,689 | 34.5 | N/A | |
Conservative | George Barrington [48] | 2,210 | 28.4 | N/A | |
Majority | 678 | 8.7 | N/A | ||
Turnout | 4,999 (est) | 82.7 (est) | N/A | ||
Registered electors | 6,042 | ||||
Liberal hold | Swing | N/A | |||
Liberal gain from Conservative | Swing | N/A | |||
Party | Candidate | Votes | % | ±% | |
---|---|---|---|---|---|
Liberal | Hedworth Williamson | Unopposed | |||
Liberal gain from Conservative |
Party | Candidate | Votes | % | ±% | |
---|---|---|---|---|---|
Liberal | Robert Duncombe Shafto | Unopposed | |||
Conservative | Adolphus Vane-Tempest | Unopposed | |||
Registered electors | 5,863 | ||||
Liberal hold | |||||
Conservative hold | |||||
Party | Candidate | Votes | % | ±% | |
---|---|---|---|---|---|
Whig | Robert Duncombe Shafto | Unopposed | |||
Conservative | Adolphus Vane-Tempest | Unopposed | |||
Registered electors | 5,847 | ||||
Whig hold | |||||
Conservative hold | |||||
Party | Candidate | Votes | % | ±% | |
---|---|---|---|---|---|
Conservative | Adolphus Vane | Unopposed | |||
Conservative hold | |||||
Party | Candidate | Votes | % | ±% | |
---|---|---|---|---|---|
Whig | Robert Duncombe Shafto | Unopposed | |||
Conservative | George Vane-Tempest | Unopposed | |||
Registered electors | 6,631 | ||||
Whig hold | |||||
Conservative hold | |||||
Party | Candidate | Votes | % | ±% | |
---|---|---|---|---|---|
Whig | Robert Duncombe Shafto | Unopposed | |||
Conservative | George Vane-Tempest | Unopposed | |||
Registered electors | 6,472 | ||||
Whig hold | |||||
Conservative hold | |||||
Party | Candidate | Votes | % | ±% | |
---|---|---|---|---|---|
Whig | Hedworth Lambton | Unopposed | |||
Conservative | Henry Liddell | Unopposed | |||
Registered electors | 5,824 | ||||
Whig hold | |||||
Conservative hold | |||||
Party | Candidate | Votes | % | ||
---|---|---|---|---|---|
Whig | Hedworth Lambton | 2,358 | 35.0 | ||
Conservative | Henry Liddell | 2,323 | 34.5 | ||
Whig | William Chaytor | 2,062 | 30.6 | ||
Turnout | 4,282 | 82.8 | |||
Registered electors | 5,170 | ||||
Majority | 35 | 0.5 | |||
Whig hold | |||||
Majority | 261 | 3.9 | |||
Conservative gain from Whig |
Party | Candidate | Votes | % | ||
---|---|---|---|---|---|
Whig | Hedworth Lambton | Unopposed | |||
Whig | Hedworth Williamson | Unopposed | |||
Registered electors | 4,772 | ||||
Whig hold | |||||
Whig hold | |||||
Party | Candidate | Votes | % | ||
---|---|---|---|---|---|
Whig | Hedworth Lambton | 2,558 | 39.9 | ||
Whig | Hedworth Williamson | 2,182 | 34.0 | ||
Tory | Edward Richmond-Gale-Braddyll [49] | 1,676 | 26.1 | ||
Majority | 506 | 7.9 | |||
Turnout | 3,841 | 90.0 | |||
Registered electors | 4,267 | ||||
Whig win (new seat) | |||||
Whig win (new seat) |
Annfield Plain is a village in County Durham, in England. It is situated on a plateau between the towns of Stanley, 4 km (2.5 mi) to the north-east, and Consett, 8 km (5.0 mi) to the west. According to the 2001 census, Annfield Plain has a population of 3,569. By the time of the 2011 Census Annfield Plain had become a ward of Stanley parish. The ward had a population of 7,774. Along with much of the surrounding area, Annfield Plain's history lies in coal mining. While the industry collapsed in the 1980s and 90s, its effects are still apparent both in the landscape and in folk memory.
Derwentside was, from 1974 to 2009, a local government district in County Durham, England.
Stanley is a town and civil parish in County Durham, a district in north-east England. Centred on a hilltop between Chester-le-Street and Consett, Stanley lies south-west of Gateshead.
Blaydon is a constituency represented in the House of Commons since 2017 by Liz Twist of the Labour Party.
Sedgefield is a constituency in County Durham represented in the House of Commons of the UK Parliament since 2019 by Paul Howell of the Conservative Party. It elects one Member of Parliament (MP) by the first past the post system of election.
The City of Chester is a constituency represented in the House of Commons of the UK Parliament since 2 December 2022 by Samantha Dixon of the Labour Party. She was elected in the by-election held following the resignation of Chris Matheson MP on 21 October 2022.
Ellesmere Port and Neston is a constituency represented in the House of Commons of the UK Parliament since 2015 by Justin Madders of the Labour Party.
Birkenhead is a constituency in Merseyside represented in the House of Commons of the UK Parliament since 2019 by Mick Whitley of the Labour Party.
Jarrow was a constituency represented in the House of Commons of the UK Parliament since 2019 by Kate Osborne of the Labour Party.
Tynemouth is a constituency in Tyne and Wear represented in the House of Commons of the UK Parliament since 1997 by Sir Alan Campbell, a member of the Labour Party.
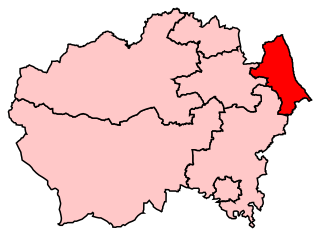
Easington is a constituency created in 1950 represented in the House of Commons of the UK Parliament since 2010 by Grahame Morris of the Labour Party.
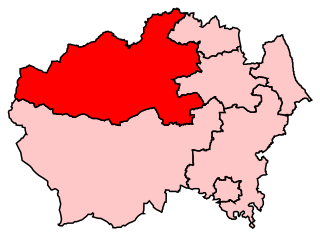
North West Durham was a constituency represented in the House of Commons of the UK Parliament.
Darlington is the parliamentary constituency for the eponymous market town in County Durham in the North East of England. It is currently represented in the House of Commons of the UK Parliament by Peter Gibson of the Conservative Party, who was first elected in 2019.
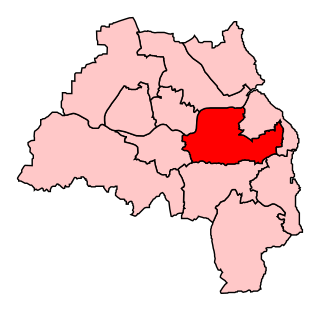
Bishop Auckland is a constituency in County Durham represented in the House of Commons of the UK Parliament since 2019 by Dehenna Davison, a Conservative.
Normanton was a county constituency represented in the House of Commons of the Parliament of the United Kingdom. It elected one Member of Parliament (MP) by the first past the post system of election.
North Warwickshire was a constituency represented in the House of Commons of the UK Parliament.
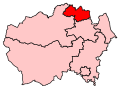
Consett was a county constituency, centred on the town of Consett in County Durham. It returned one Member of Parliament (MP) to the House of Commons of the Parliament of the United Kingdom, elected by the first past the post voting system from 1918 to 1983.
The county of Durham has returned 7 MPs to the UK Parliament since 1983. Under the Local Government Act 1972, which came into effect on 1 April 1974, the boundaries of the historic/administrative county were significantly altered with the north-east of the county, comprising more than half the electorate, being transferred to the new metropolitan county of Tyne and Wear. In addition, the borough of Hartlepool was included in the new county of Cleveland. These changes were reflected in the following redistribution of parliamentary seats which did not come into effect until the 1983 general election, resulting in a reduction in the county's representation from 16 to 7 MPs.
{{cite web}}
: Check |url=
value (help)