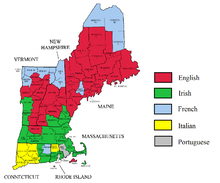
Largest self-reported ancestry groups in New England. Americans of Irish descent form a plurality in most of Massachusetts and Americans of English descent form a plurality in much of the central parts of Vermont and New Hampshire as well as nearly all of Maine.Boston is considered the cultural and historical capital of New England.
According to the 2018 American Community Survey, New England had an estimated population of 14,853,290, of which 48.7% were male and 51.3% were female. Approximately 19.7% of the population were under 18 years of age; 17.4% were 65 years of age or over.[3]
In terms of race and ethnicity, White Americans made up 80.7% of New England's population, of which 74.4% were whites of non-Hispanic origin. Black Americans comprised 7.1% of the region's population, of which 6.4% were Black people of non-Hispanic origin. Native Americans made up 0.3% of the population, numbering 43,917. There were over 650,000 Asian Americans residing in New England at the time of the survey, making up 5.0% of the region's population. There were over 240,000 Chinese Americans, constituting 1.6% of the region's total population, and over 212,000 Indian Americans (1.4%).[4]Pacific Islander Americans numbered 5,794, or 0.04% of the populace.[3]
Aside from scattered areas in Florida and New York, New England is one of the only regions in the country where recent Black immigrants outnumber Black people of multigenerational American origin, on a 60 to 40 ratio. Though various groups of Afro-Caribbeans can be seen throughout New England, the most notable is a large Haitian population in the Boston metropolitan area and a large Jamaican population in Connecticut, especially around Hartford, Connecticut. New England has about 250,000 people of non-Hispanic Caribbean origin, the majority made up of Haitians and Jamaicans, with smaller numbers of other groups such as Bajans, Antiguans, Trinidadians, and others. African groups include Liberians and Cape Verdeans both heavily around Boston and Providence, as well as smaller numbers of people from various other parts of West Africa now living in the Boston area, southwest Connecticut close to New York City and Worcester, Massachusetts. The Boston metropolitan area, Northern Rhode Island, and Southwest Connecticut tend to be the most diverse areas in New England in regards to large variety of ethnic minorities.[citation needed]
Multiracial Americans made up 3.1% of New England's population. The largest mixed-race group comprised those of African and European descent; there were over 171,000 people of black and white ancestry, making up 1.2% of the population. People of mixed Native American and European American ancestry made up 0.4% of the population, and people of Asian and European heritage 0.6%.[3] The majority of the Hispanic/Latino population is made up of multiracial people, however not counted in some identify forms such as the United States Census because some may not identify as such or sometimes some government agencies separate Hispanics as a separate race. New England, especially Rhode Island and eastern Massachusetts, also has large Cape Verdean and Brazilian populations, who are also made up of European/African/Indigenous multiracial people similar to Hispanics of Caribbean origin like Dominicans and Puerto Ricans.[citation needed]
Hispanic and Latino Americans are New England's largest minority, and they are the second-largest group in the region behind non-Hispanic European Americans. Hispanics and Latinos of any race made up 11.4% of New England's population, and there were nearly 1.7 million Hispanic and Latino individuals reported in the survey. Puerto Ricans were the most numerous of the Hispanic and Latino subgroups. Over 710,000 Puerto Ricans live in New England, forming 4.8% of the population. There are also over 281,000 Dominicans, forming 1.9% of New England's population, and nearly 137,000 Mexican Americans.[5] People of other Hispanic and Latino ancestries, for example Colombian, Salvadoran, Guatemalan, and Cuban, among many others, formed 3.2% of New England's population, and numbered over 484,000.[3]
Southern New England has some of the highest concentrations of both Puerto Ricans and Dominicans in the United States. Southeastern New England, composed of Rhode Island and eastern Massachusetts, and dominated by the Boston metropolitan area, has a Dominican plurality among its Hispanic/Latino community, but also large numbers of other Hispanics. Boston is one of the only major cities with a Dominican-dominant Hispanic population, and Rhode Island has the highest percentage of Dominicans of any US state. Southwestern New England, composed of Connecticut and western Massachusetts, and geared more towards the New York City area, has a Puerto Rican majority among its Hispanic/Latino community, while also having sizable numbers of other Hispanics. Cities like Springfield, Holyoke, Hartford, New Haven, and Bridgeport have some of the highest percentages of Puerto Ricans in the country, with Connecticut having the highest percentage out of all US states.[citation needed]
New England's European American population is ethnically diverse. The majority of the Euro-American population is of Irish, Italian, French, or English descent. Smaller but significant populations of Germans, Poles, and Portuguese descent exist as well. New England is well-known for its large Irish and Italian populations, having the highest percentages of these groups in the country, especially the southern half of New England. Half of the population of Rhode Island in particular, is of Irish or Italian origin. People of French and Portuguese origin also make up large portions of the New England population.
According to the 2018 survey, the top ten largest European ancestries were:
English is, by far, the most common language spoken at home. As of 2018, approximately 80.4% of all residents (11.1 million people) over the age of five spoke only English at home. Roughly 1.2 million people (8.4% of the population) spoke Spanish at home, and roughly 1.0 million people (7.1% of the population) spoke other Indo-European languages at home. Over 418,000 people (3.0% of the population) spoke an Asian or Pacific Island language at home.[7] Fewer than 150,000 people (about 1%) spoke French at home,[8] although this figure is above 20% in some parts of northern New England, which borders francophone Québec.[9] Roughly 156,000 people (1.1% of the population) spoke languages other than these at home.[7]
As of 2018, the vast majority of New England's inhabitants, roughly 12.8 million people or 86.4% of the population, are U.S. natives. Of these, 259,000 were born in Puerto Rico, and over 145,000 were born abroad to American parents. The foreign-born population of 2.0 million forms 13.6% of New England's total population. 38.9% of foreigners were born in Latin America, 28.5% were born in Asia, 20.4% were born in Europe, and 8.2% were born in Africa. People born in other parts of North America made up 3.6% of the foreign-born populace. Oceania-born residents formed 0.4% of the foreign population, over 7,000. Of the 2.0 million foreigners, the majority (54.4%) were naturalized citizens of the U.S.[12]
The six states of New England have the lowest birth rate in the U.S.[13]
In 2018, the New England population of 14.85 million was roughly an 80% increase from its 1930 population of 8.2 million.[10] The region's average population density is 236.9 inhabitants/sq mi (91.5/km2), although a great disparity exists between its northern and southern portions. The population density is much greater than that of the U.S. as a whole (86.2/sq mi) or even just the contiguous 48 states (108.6/sq mi).
Three-quarters of the population of New England, and most of the major cities, are in the states of Connecticut, Massachusetts, and Rhode Island. Their combined population density is 839.7/sq mi, compared to northern New England's 67.1/sq mi (2018 estimates). The most populous state is Massachusetts, and the most populous city is Massachusetts' political and cultural capital, Boston.
The coastline is more urban than the western parts of the region, which are typically rural, even in urban states like Massachusetts. This is due mainly to historical factors; the original colonists settled mostly near the coastline of Massachusetts Bay. The only New England state without access to the Atlantic Ocean, Vermont, is also the least urbanized.[14] After nearly 400 years, the region still maintains, for the most part, its historical population layout.
Southern New England forms an integral part of the BosWashmegalopolis, a conglomeration of urban centers that spans from Boston to Washington, D.C. The region includes three of the four most densely populated states in the U.S.; only New Jersey has a higher population density than the states of Rhode Island, Massachusetts, and Connecticut.
Greater Boston, which includes parts of southern New Hampshire, has a total population of approximately 4.4 million,[15] while over half the population of New England falls inside Boston's Combined Statistical Area of over 7.4 million.[16]
In 2009, two New England states were among the five highest in the U.S. in divorce rates. Maine was second highest with 13.6% of people over the age of 15 divorced; Vermont was fifth with 12.6% divorced.[17] Connecticut, Massachusetts, and Rhode Island, on the other hand, have below-average divorce rates. Massachusetts is tied with Georgia with the lowest divorce rate in the U.S., at 2.4%.[18]
During the 20th century, urban expansion in regions surrounding New York City has become an important economic influence on neighboring Connecticut, parts of which belong to the New York Metropolitan Area. The U.S. Census Bureau groups Fairfield, New Haven and Litchfield counties in western Connecticut together with New York City, and other parts of New York and New Jersey as a combined statistical area.[20]
Health
The six states of New England ranked within the top thirteen "healthiest states" of the U.S. in 2007.[21] In 2008, they all placed within the top eleven states. New England also had the largest proportion of its population covered by health insurance.[22]
For 2006, four states in the region, Massachusetts, New Hampshire, Rhode Island, and Connecticut, joined 12 others nationwide, where the number of deaths caused by drugs had overtaken traffic fatalities. This was due in part to declining traffic fatalities, and in part to increased deaths caused by prescription drugs.[23]
Data from 2008 comparing national obesity rates by state, four of the six lowest obesity states were Connecticut, Massachusetts, Vermont and Rhode Island. New Hampshire and Maine had the 15th and 18th lowest obesity rates, making New England the least overweight part of the U.S.[24]
In 2008, three of New England's states had the fewest uninsured motorists (out of the top five states); Massachusetts – 1%, Maine – 4%, and Vermont – 6%.[25]
Nursing home care can be expensive in the region. A private room in Connecticut averaged $125,925 annually. A one-bedroom in an assisted living facility averaged $55,137 in Massachusetts. Both are national highs.[28]
Related Research Articles
The United States had an official estimated resident population of 334,914,895 on July 1, 2023, according to the U.S. Census Bureau. This figure includes the 50 states and the District of Columbia but excludes the population of five unincorporated U.S. territories as well as several minor island possessions. The United States is the third most populous country in the world, and the most populous in the Americas and the Western Hemisphere. The Census Bureau showed a population increase of 0.4% for the twelve-month period ending in July 2022, below the world average annual rate of 0.9%. The total fertility rate in the United States estimated for 2022 is 1.665 children per woman, which is below the replacement fertility rate of approximately 2.1.
Bristol County is a county in the Commonwealth of Massachusetts. As of the 2020 census, the population was 579,200. The shire town is Taunton. Some governmental functions are performed by the Commonwealth of Massachusetts, others by the county, and others by local towns and cities.
Windham County is one of the eight historical counties in the U.S. state of Connecticut, located in its northeastern corner. As of the 2020 census, the population was 116,418, making it the least populous county in Connecticut. It forms the core of the region known as the Quiet Corner. Windham County is included in the Worcester, MA-CT Metropolitan Statistical Area, which is also included in the Boston-Worcester-Providence, MA-RI-NH-CT Combined Statistical Area. The entire county is within the Quinebaug and Shetucket Rivers Valley National Heritage Corridor, as designated by the National Park Service.
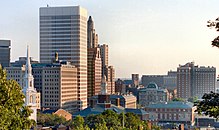
Providence County is the most populous county in the U.S. state of Rhode Island. As of the 2020 census, the county's population was 660,741, or 60.2% of the state's population. Providence County contains the city of Providence, the state capital of Rhode Island and the county's most populous city, with an estimated 190,934 residents in 2020. Providence County is included in the Providence-Warwick, RI-MA Metropolitan Statistical Area, which in turn constitutes a portion of the greater Boston-Worcester-Providence, MA-RI-NH-CT Combined Statistical Area. As of 2010, the center of population in Rhode Island is located in Providence County, in the city of Cranston.
Central Falls is a city in Providence County, Rhode Island, United States. The population was 22,583 at the 2020 census. With an area of only 1.29 square miles (3.3 km2), it is the smallest and most densely populated city in the smallest state, and the 23rd most densely populated incorporated place in the United States. It is also one of only four incorporated places in New England that have a higher population density than the city of Boston. The city takes its name from a waterfall on the Blackstone River.
Hinsdale is a town in Cheshire County, New Hampshire, United States. The population was 3,948 at the 2020 census. Hinsdale is home to part of Pisgah State Park in the northeast, and part of Wantastiquet Mountain State Forest in the northwest.
The Northeastern United States, also referred to as the Northeast, the East Coast, or the American Northeast, is a geographic region of the United States located on the Atlantic coast of North America. It borders Canada to its north, the Southern United States to its south, the Midwestern United States to its west, and the Atlantic Ocean to its east.
Greater Boston is the metropolitan region of New England encompassing the municipality of Boston, the capital of the U.S. state of Massachusetts and the most populous city in New England, and its surrounding areas. The most stringent definition of the region consists of most of the eastern third of mainland Massachusetts, excluding the Merrimack Valley and most of Southeastern Massachusetts, though most definitions include much of these areas and portions of southern New Hampshire.
The United States has a racially and ethnically diverse population. At the federal level, race and ethnicity have been categorized separately. The most recent United States census recognized five racial categories, as well as people who belong to two or more of the racial categories. The United States also recognizes the broader notion of ethnicity. The 2000 census and 2010 American Community Survey inquired about the "ancestry" of residents, while the 2020 census allowed people to enter their "origins". The Census Bureau also classified respondents as either Hispanic or Latino, identifying as an ethnicity, which comprises the minority group in the nation.
Dominican Americans are Americans who trace their ancestry to the Dominican Republic. The phrase may refer to someone born in the United States of Dominican descent or to someone who has migrated to the United States from the Dominican Republic. As of 2021, there were approximately 2.4 million people of Dominican descent in the United States, including both native and foreign-born. They are the second largest Hispanic group in the Northeastern region of the United States after Puerto Ricans, and the fifth-largest Hispanic/Latino group nationwide.
The Atlantic Northeast is a geographic and cultural region of eastern North America bounded by the Atlantic Ocean to the east and (loosely) by the Saint Lawrence River to the northwest. Though no official boundary exists, the most common conception includes the Maritime provinces, southern Quebec, and the island of Newfoundland in Canada, and the New England region of the United States. Broader conceptions reach further north into Canada, including Labrador and the Côte-Nord region of Quebec. Narrower conceptions may be limited to the coastal areas east of the Appalachian Mountains. The variety of definitions can be attributed to overlapping commonalities of the region's history, culture, geography, ecology, society, and other factors.
Stateside Puerto Ricans, also ambiguously known as Puerto Rican Americans, or Puerto Ricans in the United States, are Puerto Ricans who are in the United States proper of the 50 states and the District of Columbia who were born in or trace any family ancestry to the unincorporated US territory of Puerto Rico.
Dallas is the ninth-most populous city in the U.S. and third in Texas after Houston and San Antonio. At the 2010 U.S. census, Dallas had a population of 1,197,816. In July 2018, the population estimate of the city of Dallas was 1,345,076, an increase of 147,260 since the 2010 United States Census.
According to the U.S. Census Bureau, as of 2023, New York was the fourth largest state in population after California, Texas, and Florida, with a population of 19,571,216, a decrease of over 600,000 people, or −3.1%, since the 2020 census. The population change between 2000–2006 includes a natural increase of 601,779 people and a decrease due to net migration of 422,481 people out of the state. Immigration from outside the United States resulted in a net increase of 820,388 people, and migration within the country produced a net loss of about 800,213.
Massachusetts has an estimated population of 6.981 million as of 2022 according to the U.S. Census Bureau. This represents a −0.7% decrease in population from the 2020 census, when the population was 7.029 million. Currently, Massachusetts is the sixteenth most populous U.S. state.
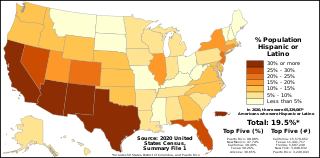
The demographics of Hispanic and Latino Americans depict a population that is the second-largest ethnic group in the United States, 62 million people or 18.7% of the national population.
Wyoming is a village and census-designated place on the Wood River in southern Rhode Island, primarily in the town of Richmond, Rhode Island, but extending north across the river into the town of Hopkinton, Rhode Island. The population was 270 at the 2010 census. It is the site of the Wyoming Village Historic District and a post office assigned ZIP code 02898.
The Springfield metropolitan area, also known as Greater Springfield, is a region that is socio-economically and culturally tied to the City of Springfield, Massachusetts. The U.S. Office of Management and Budget defines the Springfield, MA Metropolitan Statistical Area (MSA) as consisting of three counties in Western Massachusetts. As of April 1, 2020, the metropolitan area's population was estimated at 699,162, making it the 88th-largest metropolitan area in the United States.
New England is a region comprising six states in the Northeastern United States: Connecticut, Maine, Massachusetts, New Hampshire, Rhode Island, and Vermont. It is bordered by the state of New York to the west and by the Canadian provinces of New Brunswick to the northeast and Quebec to the north. The Gulf of Maine and Atlantic Ocean are to the east and southeast, and Long Island Sound is to the southwest. Boston is New England's largest city and the capital of Massachusetts. Greater Boston is the largest metropolitan area, with nearly a third of New England's population; this area includes Worcester, Massachusetts, the second-largest city in New England, Manchester, New Hampshire, the largest city in New Hampshire, and Providence, Rhode Island, the capital of and largest city in Rhode Island.
References
↑ Steinbicker, Earl (2000). 50 one day adventures—Massachusetts, Rhode Island, Connecticut, Vermont, Maine, and New Hampshire. Hastings House/Daytrips Publishers. p.7. ISBN978-0-8038-2008-1.
↑ Philip Emerson, The geography of New England (1922) pp. 51–56; Laura Purdom and Robert Holmes, Traveler's Companion New England (3rd ed. 2002) p. 77
↑ Martin JA, Hamilton BE, Sutton PD, et al. Births: Final data for 2008. National vital statistics reports; vol 59 no 1. Hyattsville, MD: National Center for Health Statistics. 2010. https://www.cdc.gov/nchs/data/nvsr/nvsr59/nvsr59_01.pdf
This page is based on this Wikipedia article Text is available under the CC BY-SA 4.0 license; additional terms may apply. Images, videos and audio are available under their respective licenses.