Demographics of Turkey

Last updated

Demographics of the Republic of Turkey
Turkey single age population pyramid 2020.png
Turkey population pyramid in 2020
PopulationIncrease2.svg 85,372,377
(31 December 2023)
Growth rateIncrease2.svg 0.11% (2023)
Birth rateDecrease2.svg 10.9 births/1,000
population (2023)
Death rateIncrease Negative.svg 5.9 deaths/1,000
population (2022)
Life expectancyIncrease2.svg 78.6 years (2020)
  maleIncrease2.svg 75.9 years (2020)
  femaleIncrease2.svg 81.3 years (2020)
Fertility rateDecrease2.svg 1.51 children born/woman (2023) [1]
Infant mortality rateDecrease Positive.svg 9.1 deaths/1000 infants (2022)
Age structure
0–14 yearsDecrease2.svg 21.4% (2023)
15–64 yearsIncrease2.svg 68.3% (2023)
65 and overIncrease Negative.svg 10.2% (2023)
Sex ratio
Total0.99 male(s)/female (2021) [2]
At birth1.05 male(s)/female (2022)
Under 151.05 male(s)/female (2022)
65 and over0.82 male(s)/female (2022)
Nationality
Nationalitynoun: Turk(s) adjective: Turkish
Major ethnic Turks
Language
Official Turkish
SpokenSee Languages of Turkey

Demographic features of the population of Turkey include population density, ethnicity, education level, health of the populace, economic status, religious affiliations and other aspects of the population.

Contents

As of 31 December 2023, the population of Turkey was 85.3 million with a growth rate of 0.11% per annum. [3] Turks are the largest ethnic group.

By ethnicity Turks (70-75%), Kurds (19%), other (6-11% including Arabs, Albanians, Bosniaks, Circassians, Chechens, Georgians, Romani, Laz people and others) (2016 estimate)

The population has been aging in recent years, with just 21.4% falling in the 0–14 age bracket (down from 26.4% in 2007). [4] The population over the age of 65 is 10.2% (up from 7.1% in 2007). As of 2023, the median age of the Turkish population is 34 years (up from 28.3 in 2007). [5] According to OECD/World Bank population statistics, from 1990 to 2008 the population growth in Turkey was 16 million or 29%. [6]

Population

Historical population

Historical population of Turkey Historical population of Turkey.svg
Historical population of Turkey
Historical population [7] [8]
YearPop.±% p.a.
18908,274,971    
191012,329,210+2.01%
192713,648,270+0.60%
193516,158,018+2.13%
194017,820,950+1.98%
194518,790,174+1.06%
195020,947,188+2.20%
195524,064,763+2.81%
196027,754,820+2.89%
196531,391,421+2.49%
197035,605,176+2.55%
YearPop.±% p.a.
197540,347,719+2.53%
198044,736,957+2.09%
198550,664,458+2.52%
199056,473,035+2.19%
200067,803,927+1.85%
201073,722,988+0.84%
201578,741,053+1.33%
202083,614,362+1.21%
202184,680,273+1.27%
202285,279,553+0.71%

Life expectancy

Life expectancy at birth in Turkey since 1937 Life expectancy in Turkey.svg
Life expectancy at birth in Turkey since 1937
Life expectancy in Turkey by gender since 1960 Life expectancy by WBG -Turkey -diff.png
Life expectancy in Turkey by gender since 1960
Life expectancy in Turkish provinces in 2018-20 Life expectancy map of Turkey 2018-20 with names.png
Life expectancy in Turkish provinces in 2018-20
Life expectancy in Turkey according to the UN [9]
PeriodLife expectancy in
Years
PeriodLife expectancy in
Years
1950–195541.011985–199063.04
1955–196043.691990–199565.49
1960–196547.221995–200068.49
1965–197050.782000–200571.37
1970–197553.752005–201073.37
1975–198057.052010–201574.83
1980–198560.222015–202077.31

According to the CIA World Factbook, in 2019, life expectancy was 78.3 years for the total population, 75.6 years for men and 81.0 years for women. [10]

Urbanization

Istanbul experienced a rapid population growth (The gray areas are buildings) IstanbulGrowth1975and2011.png
Istanbul experienced a rapid population growth (The gray areas are buildings)

According to the CIA World Factbook: [11]

Median age

According to the CIA World Factbook: [11]

Sex ratio

According to the CIA World Factbook: [11]

Literacy

According to the CIA World Factbook: [11] Defined as people age 15 and over who can read and write, 2016 est.

2022 official estimates: [13]

Vital statistics

UN estimates

The figures from the UN Department of Economic and Social Affairs: [14]

PeriodLive births per yearDeaths per yearNatural change per yearCBR [lower-alpha 1] CDR [lower-alpha 1] NC [lower-alpha 1] TFR [lower-alpha 1] IMR [lower-alpha 1]
1950–19551,127,000551,000677,00048.418.829.66.69167.4
1955–19601,216,000564,000752,00046.918.428.56.5163.9
1960–19651,277,000547,000799,00044.317.626.76.2160.5
1965–19701,343,000527,000792,00040.316.723.65.80156.9
1970–19751,451,000523,000887,00038.715.023.75.39141.3
1975–19801,497,000505,000977,00036.413.023.44.69119.4
1980–19851,527,000481,0001,074,00033.810.823.04.1196.7
1985–19901,431,000454,000976,00027.78.818.93.3978.0
1990–19951,375,000438,000987,00025.17.717.43.1163.0
1995–20001,389,000418,000983,00022.86.915.92.7645.5
2000–20051,345,000404,000923,00020.56.214.32.5031.4
2005–20101,309,000415,000932,00018.75.912.82.2724.0
2010–20151,302,000439,000914,00017.35.811.52.1513.0
2015–20201,281,000473,000808,00015.85.810.02.10
2020–20251,242,000509,000733,00014.66.08.62.04
2025–20301,191,000543,000648,00013.66.27.42.01
  1. 1 2 3 4 5 CBR = crude birth rate (per 1000); CDR = crude death rate (per 1000); NC = natural change (per 1000); TFR = total fertility rate (number of children per woman); IMR = infant mortality rate per 1000 births

Registered births and deaths

Birth statistics of Turkey from 2001 onward are from the Central Population Administrative System (MERNIS) database which is available on-line. [15] Birth statistics are updated continually because MERNIS has dynamic structure. [16]

In 2010 Turkey had a crude birth rate of 17.2 per 1000, in 2011 16.7, down from 20.3 in 2001. The total fertility rate (TFR) in 2010 was 2.05 children per woman, in 2011 2.02. The crude birth rate in 2010 ranged from 11.5 per 1,000 in West Marmara (TFR 1.52) (11,5;1.55 in 2011), similar to neighbouring Bulgaria, to 27.9 per 1,000 in Southeast Anatolia (TFR 3.53) (27.1;3,42 in 2011), similar to neighbouring Syria. Similarly, in 2012, the TFR ranged from 1.43 in Kırklareli, to 4.39 in Şanlıurfa. [17] Death statistics from MERNIS are available as of 2009. Mortality data prior to 2009 are incomplete.

Population (31.12.)Live birthsDeathsNatural changeCrude birth rate (per 1000)Crude death (per 1000)Natural increase (per 1000)Crude migration (per 1000)Total fertility rate (TFR)
19901,392,000388,0001,004,0003.11
19911,390,000391,000999,0003.02
19921,388,000394,000994,0002.94
19931,385,000396,000989,0002.87
19941,372,000399,000973,0002.81
19951,368,000402,000966,0002.76
19961,386,000419,000967,0002.70
19971,317,000424,000893,0002.66
19981,318,000426,000892,0002.61
19991,313,000427,000886,0002.56
20001,307,000422,000885,0002.50
20011,323,341175,1371,148,20420.32.38
20021,229,555175,4341,054,12118.62.40
20031,198,927184,3301,014,59717.92.35
20041,222,484187,0861,035,39818.12.31
20051,244,041197,5201,046,52118.22.27
20061,255,432210,1461,045,28618.12.24
200770,586,2561,289,992212,7311,077,26118.33.015.32.21
200871,517,1001,295,511215,5621,079,94918.13.015.1-2.12.19
200972,561,3121,266,751369,703897,04817.65.112.52.02.10
201073,722,9881,261,169366,471894,69817.25.012.23.62.08
201174,724,2691,252,812376,162876,65016.95.111.81.72.05
201275,627,3841,294,605376,520918,08517.25.012.2-0.22.11
201376,667,8641,297,505373,041924,46417.04.912.11.52.11
201477,695,9041,351,088391,091959,99717.55.112.40.92.19
201578,741,0531,336,908405,528931,38017.15.211.91.42.16
201679,814,8711,316,204422,964893,24016.65.311.32.32.11
201780,810,5251,300,258426,662873,59616.25.310.91.52.08
201882,003,8821,256,282426,785829,49715.45.210.24.42.00
201983,154,9971,189,939436,624753,31514.45.39.14.81.89
202083,614,3621,117,942509,048608,89413.46.17.3-1.81.77
202184,680,2731,083,336566,485516,85112.96.76.26.51.71
202285,279,5531,035,795504,839530,95612.25.96.30.81.62
202385,572,142958,40811.21.51

Birth and death rate by region and year

Birth and Death Rate by Region and Year
Birth Rate by Region and Year [lower-alpha 1]
RegionPopulation (2022)Birth Rate (TFR)/2022Birth Rate (TFR)/2021Birth Rate (TFR)/2020Birth Rate (TFR)/2019Birth Rate (TFR)/2018Birth Rate (TFR)/2017Birth Rate (TFR)/2016Birth Rate (TFR)/2015Birth Rate (TFR)/2014Birth Rate (TFR)/2013Birth Rate (TFR)/2012Birth Rate (TFR)/2011Birth Rate (TFR)/2010Birth Rate (TFR)/2009
Turkey 85 279 55312.2 (1.62)12.9 (1.71)13.4 (1.77)14.4 (1.89)15.4 (2.00)16.2 (2.08)16.6 (2.11)17.1 (2.16)17.5 (2.19)17.0 (2.11)17.2 (2.11)16.9 (2.05)17.2 (2.08)17.6 (2.10)
İstanbul 15 907 95110.7 (1.29)11.5 (1.39)12.4 (1.48)13.6 (1.60)14.8 (1.73)15.6 (1.80)16.3 (1.86)16.7 (1.88)17.0 (1.89)16.4 (1.81)16.5 (1.80)15.9 (1.72)16.3 (1.77)16.4 (1.77)
West Marmara 3 743 4859.4 (1.41)9.6 (1.43)10.1 (1.50)10.6 (1.57)11.5 (1.67)11.8 (1.70)11.9 (1.69)12.0 (1.69)12.1 (1.69)11.9 (1.64)11.9 (1.63)11.6 (1.57)11.5 (1.54)11.7 (1.54)
Aegean 10 886 8039.8 (1.41)10.2 (1.45)10.7 (1.50)11.4 (1.58)12.2 (1.68)12.9 (1.75)13.2 (1.76)13.6 (1.80)13.8 (1.80)13.4 (1.73)13.7 (1.74)13.2 (1.66)13.3 (1.66)13.7 (1.69)
East Marmara 8 511 45011.0 (1.48)11.7 (1.56)12.2 (1.61)13.2 (1.72)14.2 (1.83)14.6 (1.87)15.0 (1.89)15.2 (1.90)15.3 (1.88)14.8 (1.80)15.0 (1.80)14.5 (1.71)14.8 (1.74)15.2 (1.77)
West Anatolia 8 339 47010.9 (1.42)11.4 (1.48)12.0 (1.55)13.0 (1.66)14.1 (1.78)14.7 (1.84)15.1 (1.87)15.5 (1.90)15.8 (1.91)15.4 (1.85)15.4 (1.83)15.2 (1.79)15.4 (1.80)15.8 (1.83)
Mediterranean 11 020 55012.2 (1.71)12.8 (1.77)13.3 (1.83)14.3 (1.96)15.4 (2.08)16.3 (2.18)17.0 (2.24)17.5 (2.29)18.0 (2.32)17.6 (2.24)17.8 (2.23)17.3 (2.14)17.8 (2.18)18.3 (2.20)
Central Anatolia 4 124 93911.3 (1.56)11.8 (1.62)12.3 (1.68)13.2 (1.79)14.1 (1.89)14.9 (1.99)15.4 (2.05)15.8 (2.09)16.4 (2.14)16.0 (2.06)16.3 (2.07)16.4 (2.06)16.7 (2.08)17.6 (2.16)
West Black Sea 4 665 9389.0 (1.35)9.4 (1.41)9.8 (1.47)10.6 (1.57)11.2 (1.63)11.6 (1.67)11.9 (1.69)12.2 (1.73)12.7 (1.77)12.8 (1.76)13.0 (1.77)13.0 (1.74)13.6 (1.79)14.2 (1.84)
East Black Sea 2 690 0389.3 (1.39)9.8 (1.45)10.3 (1.52)11.0 (1.61)11.6 (1.69)12.0 (1.73)12.3 (1.77)12.5 (1.78)12.8 (1.81)12.8 (1.77)13.0 (1.78)13.1 (1.77)13.6 (1.81)14.1 (1.86)
Northeast Anatolia 2 154 74815.0 (1.92)16.5 (2.11)17.1 (2.18)18.4 (2.36)19.1 (2.45)20.6 (2.64)21.2 (2.72)21.7 (2.79)22.7 (2.90)22.4 (2.85)22.8 (2.90)22.9 (2.90)23.4 (2.97)23.1 (2.91)
Central East Anatolia 3 928 27116.0 (2.01)16.8 (2.12)17.8 (2.23)19.3 (2.43)20.0 (2.52)21.1 (2.65)21.2 (2.67)21.9 (2.75)23.0 (2.87)22.6 (2.83)22.5 (2.82)22.9 (2.85)23.6 (2.95)23.9 (3.00)
Southeast Anatolia 9 305 91021.3 (2.71)22.7 (2.86)22.5 (2.84)23.8 (3.03)25.5 (3.23)26.6 (3.36)26.7 (3.38)27.8 (3.52)28.7 (3.63)27.6 (3.48)28.0 (3.53)27.7 (3.48)28.2 (3.57)28.3 (3.59)
Death Rate by Region and Year [lower-alpha 1]
RegionPopulation (2022)Death Rate (2022)Death Rate (2021)Death Rate (2020)Death Rate (2019)Death Rate (2018)Death Rate (2017)Death Rate (2016)Death Rate (2015)Death Rate (2014)Death Rate (2013)Death Rate (2012)Death Rate (2011)Death Rate (2010)Death Rate (2009)
Turkey 85 279 5535.96.76.15.35.25.35.35.25.14.95.05.15.05.1
İstanbul 15 907 9514.65.44.94.24.24.24.24.14.13.94.04.04.04.2
West Marmara 3 743 4859.09.88.17.77.87.87.77.87.57.17.37.37.37.3
Aegean 10 886 8037.78.27.56.76.66.66.66.46.15.96.26.25.96.0
East Marmara 8 511 4506.37.36.35.65.75.75.75.75.55.45.55.55.55.6
West Anatolia 8 339 4705.56.26.15.05.05.04.94.74.74.54.64.74.64.8
Mediterranean 11 020 5505.76.55.85.04.94.95.04.84.64.54.54.54.54.5
Central Anatolia 4 124 9396.77.87.15.95.96.16.15.95.85.55.55.75.55.7
West Black Sea 4 665 9388.89.98.57.67.67.67.67.47.36.97.07.06.87.0
East Black Sea 2 690 0388.79.68.07.27.07.37.06.96.86.36.56.56.26.4
Northeast Anatolia 2 154 7485.26.15.74.95.05.05.05.04.94.85.05.45.05.1
Central East Anatolia 3 928 2714.35.25.14.14.04.24.24.14.14.14.14.54.44.5
Southeast Anatolia 9 305 9103.54.34.23.53.33.43.73.43.53.43.53.63.73.8

Total births and deaths by region and year

Absolute Births and Deaths by Region and Year
Absolute Births by Region and Year [lower-alpha 1]
RegionPopulation (2022)Births (2022)Births (2021)Births (2020)Births (2019)Births (2018)Births (2017)Births (2016)Births (2015)Births (2014)Births (2013)Births (2012)Births (2011)Births (2010)Births (2009)
Turkey 85 279 5531,035,7951,083,3361,117,9421,189,9391,256,2821,300,2581,316,2041,336,9081,351,0881,297,5051,294,6051,252,8121,261,1691,266,751
İstanbul 15 907 951170,084180,718192,424208,264223,013233,220240,027242,888242,397229,390226,594213,441213,821210,441
West Marmara 3 743 48534,81235,06036,52238,15940,59040,93340,49540,39140,13838,80638,51737,05836,28436,400
Aegean 10 886 803106,284109,564113,538120,023127,579132,868134,176137,187137,438132,299133,419127,833128,112129,927
East Marmara 8 511 45093,23897,59099,942106,064112,164113,462113,585112,635111,115105,761105,20399,704100,386100,928
West Anatolia 8 339 47090,73893,79698,139104,588111,376115,079116,456117,694117,405112,593111,279108,026106,921107,734
Mediterranean 11 020 550134,115138,127142,483150,950159,689166,815171,561174,874177,272170,686169,985163,817166,123167,506
Central Anatolia 4 124 93946,62848,25750,33253,82556,52758,93360,38161,56963,44661,66962,63462,98964,21667,174
West Black Sea 4 665 93841,80743,90345,77349,59551,70552,77953,72254,99557,09957,36958,37758,51161,39363,972
East Black Sea 2 690 03825,07326,20227,68229,62731,00231,55632,09232,14432,81732,55832,77432,83634,27235,565
Northeast Anatolia 2 154 74832,64036,00437,55740,61341,91545,26246,60947,72049,99649,60550,78150,77951,57850,778
Central East Anatolia 3 928 27162,76166,38970,00775,71777,86081,13381,29883,68287,02784,96384,01884,34486,05586,812
Southeast Anatolia 9 305 910197,615207,726203,543212,514222,862228,218225,802231,129234,938221,806221,024213,474212,008209,514
Absolute Deaths by Region and Year [lower-alpha 1]
RegionPopulation (2022)Deaths (2022)Deaths (2021)Deaths (2020)Deaths (2019)Deaths (2018)Deaths (2017)Deaths (2016)Deaths (2015)Deaths (2014)Deaths (2013)Deaths (2012)Deaths (2011)Deaths (2010)Deaths (2009)
Turkey 85 279 553504,839566,485509,048436,624426,785426,662422,964405,528391,091373,041376,520376,162366,471369,703
İstanbul 15 907 95173,75184,24376,40763,48662,59463,37262,57260,09358,00954,77054,69653,16552,81253,761
West Marmara 3 743 48533,31535,75229,38527,58927,45627,21926,41626,14524,86423,22923,49623,16723,00722,687
Aegean 10 886 80383,12487,90479,80571,04768,64468,47567,69964,84461,12657,65160,23459,62356,65857,068
East Marmara 8 511 45053,61560,28851,53645,26444,85844,25043,62841,99140,00738,29138,22038,09437,52637,379
West Anatolia 8 339 47045,78351,27350,00539,81439,38238,91037,76535,81434,58933,21933,36933,09732,27032,976
Mediterranean 11 020 55062,67869,85161,59252,80150,77650,53350,22947,41145,43943,94943,40442,90041,83441,264
Central Anatolia 4 124 93927,46231,86228,80224,19823,89024,00523,91423,08622,37921,23821,04921,87321,29921,582
West Black Sea 4 665 93840,92646,10039,59535,36634,98434,74834,35933,35532,77231,01131,47631,65130,54131,279
East Black Sea 2 690 03823,36525,90621,34219,34518,60619,18318,33917,67217,29215,99616,50416,26615,57416,158
Northeast Anatolia 2 154 74811,34413,37012,56410,77910,90010,91511,02011,01310,78710,66711,05211,87010,95511,154
Central East Anatolia 3 928 27116,95320,46019,97915,96915,53016,08616,13215,68515,44115,43015,41916,55116,11416,491
Southeast Anatolia 9 305 91032,52339,47638,03630,96629,16528,96630,89128,41928,38627,59027,60127,90527,88127,904

Natural increase by region and year

Natural Increase by Region and Year
Natural Increase by Region and Year [lower-alpha 1]
RegionPopulation (2022)Natural Increase (2022)Natural Increase (2021)Natural Increase (2020)Natural Increase (2019)Natural Increase (2018)Natural Increase (2017)Natural Increase (2016)Natural Increase (2015)Natural Increase (2014)Natural Increase (2013)Natural Increase (2012)Natural Increase (2011)Natural Increase (2010)Natural Increase (2009)
Turkey 85 279 553530 956/6.3516 851/6.2608 894/7.3753 315/9.1829 497/10.2873 596/10.9893 240/11.3931 380/11.9959 997/12.4924 464/12.1918 085/12.2876 650/11.8894 698/12.2897 048/12.5
İstanbul 15 907 95196 333/6.196 475/6.1116 017/7.5144 778/9.4160 419/10.6169 848/11.4177 455/12.0182 795/12.6184 388/12.9174 620/12.5171 898/12.5160 276/11.9161 009/12.3156 680/12.2
West Marmara 3 743 4851 497/0.4-692/-0.27 137/2.010 570/2.913 134/3.713 714/3.914 079/4.114 246/4.215 274/4.615 577/4.815 021/4.713 891/4.413 277/4.213 713/4.4
Aegean 10 886 80323 160/2.121 660/2.033 733/3.248 976/4.758 935/5.664 393/6.266 477/6.572 343/7.276 312/7.774 648/7.673 185/7.568 210/7.071 454/7.472 859/7.7
East Marmara 8 511 45039 623/4.737 302/4.448 406/5.960 800/7.667 306/8.569 212/8.969 957/9.270 644/9.571 108/9.867 470/9.566 983/9.661 610/8.962 860/9.363 549/9.6
West Anatolia 8 339 47044 955/5.442 523/5.248 134/5.964 774/8.071 994/9.176 169/9.778 691/10.281 880/10.882 816/11.179 374/10.977 910/10.874 929/10.674 651/10.774 758/11.0
Mediterranean 11 020 55071 437/6.568 276/6.380 891/7.598 149/9.3108 913/10.5116 282/11.4121 332/12.0127 463/12.8131 833/13.4126 737/13.1126 581/13.2120 917/12.8124 289/13.3126 242/13.8
Central Anatolia 4 124 93919 166/4.616 395/4.021 530/5.229 627/7.332 637/8.234 928/8.836 467/9.338 483/9.941 067/10.640 431/10.541 585/10.841 116/10.742 917/11.245 592/12.0
West Black Sea 4 665 938881/0.2-2 197/-0.56 178/1.314 229/3.016 721/3.618 031/4.019 363/4.321 640/4.824 327/5.426 358/5.926 901/6.026 860/6.030 852/6.832 693/7.3
East Black Sea 2 690 0381 708/0.6296/0.26 340/2.310 282/3.812 396/4.612 373/4.713 753/5.314 472/5.615 525/6.116 562/6.516 270/6.416 570/6.618 698/7.419 407/7.7
Northeast Anatolia 2 154 74821 296/9.822 634/10.424 993/11.429 834/13.531 015/14.134 347/15.635 589/16.236 707/16.739 209/17.838 938/17.639 729/17.838 909/17.640 623/18.539 624/18.0
Central East Anatolia 3 928 27145 808/11.745 929/11.650 028/12.759 748/15.262 330/16.065 047/16.965 166/17.067 997/17.871 586/18.969 533/18.568 599/18.467 793/18.469 941/19.270 321/19.4
Southeast Anatolia 9 305 910165 092/17.8168 250/18.4165 507/18.3181 548/20.3193 697/22.2199 252/23.2194 911/23.1202 710/24.4206 552/25.3194 216/24.2193 423/24.5185 569/24.1184 127/24.5181 610/24.5

Historical fertility rate

Total Fertility Rate

Fertility Rate (TFR) (Wanted Fertility Rate) and CBR (Crude Birth Rate): [18]

YearCBR (Total)TFR (Total)CBR (Urban)TFR (Urban)CBR (Rural)TFR (Rural)
199322,92,7 (1,8)21,72,4 (1,7)24,03,1 (2,0)
199823,42,61 (1,9)22,82,39 (1,9)24,73,08 (2,1)

Total fertility rate by region in Turkey by Turkish General Census (GNS) and Turkish population and health research (TNSA). [19]

South-EastEastMediterraneanBlack SeaCentralAegeanMarmaraTurkey
TNSA 19786,313,774,994,262,894,33
GNS 19804,614,643,503,653,762,812,733,41
TNSA 19934,402,373,152,442,032,65
TNSA 19984,192,552,682,562,032,61
GNS 20004,313,722,432,282,291,961,882,53
TNSA 20033,652,301,941,861,882,23
GNS rural 20004,804,522,522,562,912,232,032,87
GNS urban 20004,053,082,382,012,051,801,852,20
GNS metropolitan 20003,812,342,411,871,891,601,832,03

Total fertility rate (TFR) by province and year

Total fertility rate (TFR) by province and year

Figures from Turkish Statistical Institute (TurkStat): [20]

Turkey total fertility rate by province (2023)
.mw-parser-output .legend{page-break-inside:avoid;break-inside:avoid-column}.mw-parser-output .legend-color{display:inline-block;min-width:1.25em;height:1.25em;line-height:1.25;margin:1px 0;text-align:center;border:1px solid black;background-color:transparent;color:black}.mw-parser-output .legend-text{}
3-4
2-3
1.5 - 2
1 - 1.5 Turkey total fertility rate by province 2023.png
Turkey total fertility rate by province (2023)
  3–4
  2–3
  1.5 – 2
  1 – 1.5
Total fertility rate by province 1980
5-6
4-5
3-4
2-3
1.5 - 2
1 - 1.5 Turkey total fertility rate by province 1980.png
Total fertility rate by province 1980
  5–6
  4–5
  3–4
  2–3
  1.5 – 2
  1 – 1.5
Total fertility rate by province (2013) Turkey total fertility rate by province 2013.png
Total fertility rate by province (2013)
Total fertility rate by province (2014) Turkey total fertility rate by province 2014.png
Total fertility rate by province (2014)
Total fertility rate by province (2015) Turkey total fertility rate by province 2015.png
Total fertility rate by province (2015)
Total fertility rate by province (2019) Turkey total fertility rate by province 2019.png
Total fertility rate by province (2019)
Total fertility rate by province (2020) Turkey total fertility rate by province 2020.png
Total fertility rate by province (2020)
Total fertility rate by province (2021) Turkey total fertility rate by province 2021.png
Total fertility rate by province (2021)
Total fertility rate by province (2022) Turkey total fertility rate by province 2022.png
Total fertility rate by province (2022)
Total fertility rate by province (2023) Turkey total fertility rate by province 2023.png
Total fertility rate by province (2023)
Total fertility rate development by province 2009-2015
> 12%
8 to 12%
4 to 8%
0 to 4%
-4 to 0%
-8 to -4%
-12 to -8%
< -12% Turkey fertility rate development by province 2009-2015.png
Total fertility rate development by province 2009–2015
  > 12%
  8 to 12%
  4 to 8%
  0 to 4%
  -4 to 0%
  -8 to −4%
  -12 to −8%
  < -12%
ProvincePopulation (2022) [21] TFR (1980) [19] TFR (2000)TFR (2009)TFR (2010)TFR (2011)TFR (2012)TFR (2013)TFR (2014)TFR (2015)TFR (2016)TFR (2017)TFR (2018)TFR (2019)TFR (2020)TFR (2021)TFR (2022)
Turkey 85 279 5532.122.082.052.112.102.182.152.112.071.991.881.761.711.62
İstanbul 15 907 9511.771.771.721.801.811.891.881.861.801.731.601.481.391.29
West Marmara 3 743 4851.541.541.571.631.641.691.691.681.691.661.561.491.431.41
Tekirdağ 1 142 4511.831.691.671.721.791.821.881.941.931.931.921.771.651.591.53
Edirne 414 7142.411.661.431.391.451.511.491.461.541.481.461.431.341.341.311.31
Kırklareli 369 3471.701.381.391.351.451.451.561.551.481.531.481.431.401.301.31
Balıkesir 1 257 5901.951.531.561.581.621.651.711.651.671.661.631.541.481.411.42
Çanakkale 559 3831.681.501.441.531.581.521.571.551.561.571.561.471.391.321.28
Aegean 10 886 8031.691.661.661.741.731.801.801.761.741.671.571.491.451.41
İzmir 4 462 0561.751.571.541.561.661.641.721.721.681.651.591.481.391.361.31
Aydın 1 148 2412.121.741.711.691.821.791.841.851.821.871.781.671.571.541.49
Denizli 1 056 3322.191.731.661.701.741.761.871.861.801.791.711.611.551.501.47
Muğla 1 048 1851.941.711.701.671.761.731.761.771.731.691.641.551.501.431.35
Manisa 1 468 2792.141.781.771.791.861.891.941.931.911.861.831.751.681.641.61
Afyonkarahisar 747 5553.742.822.062.012.012.031.982.092.082.011.971.891.841.741.671.61
Kütahya 580 7012.191.551.601.531.551.521.581.591.521.501.431.341.311.211.18
Uşak 375 4542.181.641.671.641.741.761.791.741.681.691.591.501.441.371.38
East Marmara 8 511 4501.771.741.711.801.801.881.891.891.861.831.711.611.561.48
Bursa 3 194 7201.981.781.771.731.851.851.901.921.911.881.861.741.651.571.47
Eskişehir 906 6171.741.401.381.381.461.481.571.561.541.541.491.401.351.351.29
Bilecik 228 6731.981.711.671.631.751.771.781.721.741.701.691.621.501.451.40
Kocaeli 2 079 0723.232.131.901.871.821.911.912.042.072.042.011.961.851.701.661.58
Sakarya 1 080 0802,231.871.821.781.851.831.911.931.951.941.941.801.681.681.55
Düzce 405 1312.181.871.831.821.811.871.901.861.901.831.771.711.601.491.48
Bolu 320 8241.931.601.571.641.591.641.661.601.621.561.521.461.361.371.31
Yalova 296 3331.931.781.641.621.721.691.811.781.881.821.751.651.491.481.39
West Anatolia 8 339 4701.831.801.791.831.851.911.901.861.831.771.651.541.481.42
Ankara 5 782 2851.901.681.661.651.681.711.771.771.731.711.651.531.421.341.28
Konya 2 296 3473.002.142.122.132.182.182.252.202.182.112.061.931.841.801.75
Karaman 260 8382.772.151.951.982.022.092.042.122.092.061.951.851.771.661.60
Mediterranean 11 020 5502.202.182.142.232.242.322.282.242.162.071.941.831.771.71
Antalya 2 688 0041.931.911.871.841.931.911.961.981.941.841.761.631.541.481.37
Isparta 445 3252.041.761.661.661.721.701.751.721.721.761.621.541.451.431.39
Burdur 273 7992.121.741.731.681.661.681.791.791.741.661.581.501.411.371.36
Adana 2 274 1062.682.182.142.122.212.252.342.322.262.222.122.011.871.831.82
Mersin 1 916 4322.382.032.042.002.122.112.202.172.142.072.021.861.771.721.68
Hatay 1 686 0432.972.572.542.512.632.622.822.742.692.582.492.372.202.152.04
Kahramanmaraş 1 177 4363.542.702.682.662.682.742.742.642.602.532.382.222.102.001.94
Osmaniye 559 4052.952.552.572.402.512.512.592.502.432.392.262.212.031.921.98
Central Anatolia 4 124 9392.162.082.062.072.062.132.082.031.961.871.781.671.621.56
Kırıkkale 277 0462.391.771.701.601.591.651.691.721.691.681.591.531.431.391.33
Aksaray 433 0552.852.422.352.342.302.292.352.302.242.192.131.991.921.861.83
Niğde 365 4192.982.402.282.232.322.252.332.192.202.081.991.921.761.721.69
Nevşehir 310 0112.552.101.981.971.981.942.101.981.931.851.781.661.621.581.51
Kırşehir 244 5192.401.721.691.691.751.781.861.821.791.761.731.651.491.401.38
Kayseri 1 441 5232.622.212.142.162.182.172.252.192.132.021.961.851.711.661.60
Sivas 634 9242.762.072.021.991.991.941.991.981.961.941.781.731.631.551.46
Yozgat 418 4422.842.252.072.042.031.972.062.062.011.991.831.711.631.531.47
West Black Sea 4 665 9381.841.791.741.771.761.771.731.691.661.631.561.461.411.35
Zonguldak 588 5101.931.711.651.581.621.591.601.561.501.481.431.381.311.261.18
Karabük 252 0581.991.671.601.621.541.591.561.571.461.501.491.411.291.321.21
Bartın 203 3512.111.681.671.611.501.571.691.581.551.451.481.421.381.251.26
Kastamonu 378 1153.442.181.701.691.641.691.681.591.631.591.501.541.471.411.391.39
Çankırı 195 7662.271.971.931.911.841.781.861.781.841.751.691.691.671.691.51
Sinop 220 7994.352.481.911.811.771.841.751.791.721.701.701.611.601.561.471.41
Samsun 1 368 4882.551.871.811.771.831.831.851.821.801.781.751.651.511.431.38
Tokat 596 4543.061.951.921.831.791.821.821.741.701.671.631.611.471.421.39
Çorum 524 1302.661.931.901.861.961.891.971.851.861.791.731.681.571.521.45
Amasya 338 2672.341.801.751.711.751.781.751.801.701.721.661.601.481.461.38
East Black Sea 2 690 0381.861.811.771.781.771.801.781.761.711.681.601.511.451.39
Trabzon 818 0232.101.871.821.781.801.791.841.861.851.821.791.681.561.531.43
Ordu 763 1902.811.941.891.841.861.851.891.831.841.811.721.671.561.441.44
Giresun 450 8622.311.741.741.651.661.641.651.641.571.561.551.491.401.331.32
Rize 344 0162.011.801.761.751.731.801.791.791.791.751.761.651.571.531.41
Artvin 169 4032.241.731.721.671.781.731.781.741.771.721.641.601.571.401.39
Gümüşhane 144 5442.922.091.881.891.841.841.841.721.621.371.331.351.381.351.30
Northeast Anatolia 2 154 7482.912.972.902.902.852.902.792.722.642.442.362.182.111.92
Erzurum 749 7543.512.512.492.502.502.492.602.512.452.402.242.152.021.951.80
Erzincan 239 2232.541.821.821.911.881.891.821.821.891.731.631.651.531.581.39
Bayburt 84 2413.292.382.312.162.302.132.182.091.961.831.841.711.611.601.42
Ağrı 510 6265.494.224.384.134.114.014.043.843.733.633.283.182.892.732.51
Kars 274 8293.762.903.052.882.922.742.752.642.592.542.352.252.101.981.86
Iğdır 203 5944.173.063.163.123.103.213.193.052.982.812.702.562.272.221.99
Ardahan 92 4812.952.352.252.252.212.112.242.172.012.051.911.881.741.821.63
Central East Anatolia 3 928 2713.002.952.852.822.832.872.752.672.652.522.432.232.122.01
Malatya 812 5803.662.562.082.061.991.991.962.052.011.991.991.901.801.661.641.59
Elazığ 591 4972.522.021.981.981.971.932.041.991.961.951.861.791.711.601.51
Bingöl 282 5563.562.562.552.522.492.492.632.422.442.392.372.262.101.991.80
Tunceli 84 3664.871.901.561.471.501.531.551.621.691.581.561.641.691.571.491.40
Van 1 128 7496.003.933.843.663.583.643.543.373.203.152.962.852.562.352.28
Muş 399 2024.183.933.943.663.653.593.713.493.373.423.253.162.852.772.53
Bitlis 353 9886.015.033.803.713.523.493.443.473.403.303.233.072.902.702.652.48
Hakkâri 275 3336.693.353.183.142.993.013.032.762.602.562.422.352.162.051.99
Southeast Anatolia 9 305 9103.593.573.483.533.483.633.523.383.363.233.022.842.862.71
Gaziantep 2 154 0513.833.153.073.043.153.173.283.193.062.932.852.622.472.482.39
Adıyaman 635 1693.662.762.792.772.792.752.902.872.782.792.692.562.362.362.24
Kilis 147 9193.542.933.012.832.992.963.133.032.872.832.752.552.482.472.34
Şanlıurfa 2 170 1104.834.574.584.464.474.414.574.424.354.334.153.903.713.823.59
Diyarbakır 1 804 8804.513.233.243.193.233.163.303.223.133.132.972.792.542.542.42
Mardin 870 3744.983.463.533.353.463.333.553.463.263.283.153.002.762.792.62
Batman 634 4915.273.703.643.433.423.343.413.253.113.082.902.722.552.572.39
Şırnak 557 6057.064.694.514.264.214.194.274.093.513.763.633.393.233.192.94
Siirt 331 3116.054.234.123.963.853.703.893.563.473.333.182.932.882.712.47

Structure of the population

Structure of the population

Structure of the population (31.XII.2015) (Data based on Address Based Population Registration System.): [22] [23] [24]

Age groupMaleFemaleTotalPercent
Total39,511,19139,229,86278,741,053100
0–43,275,5203,105,9966,381,5168.10
5–93,252,8113,084,9086,337,7198.05
10–143,166,8603,000,1256,166,9857.83
15–193,382,3633,203,1376,585,5008.36
20–243,224,1683,089,9996,314,1678.02
25–293,178,3503,084,8996,263,2497.95
30–343,252,1713,175,8796,428,1508.16
35–393,134,0413,069,2826,203,3237.88
40–442,788,4252,764,1555,552,5807.05
45–492,337,0872,252,9924,590,0795.83
50–542,317,5342,315,3754,632,9095.88
55–591,843,3541,837,8163,681,1704.68
60–641,515,0651,593,4023,108,4673.95
65–691,100,7341,255,6512,356,3852.99
70–74737,892888,2921,626,1842.07
75–79501,411682,3351,183,7461.50
80–84339,904470,584810,4881.03
85–89128,879261,571390,4500.50
90+34,62293,364127,9860.16
Age groupMaleFemaleTotalPercent
0–149,695,1919,191,02918,886,22023.99
15–6426,972,55826,387,03653,359,59467.77
65+2,843,4423,651,7976,495,2398.25

Structure of the population (31.XII.2016):

Age groupMaleFemaleTotalPercent
Total40,043,65039,771,22179,814,871100
0–43,314,5423,144,7536,459,2958.09
5–93,253,3453,084,0996,337,4447.94
10–143,147,1332,981,9106,129,0437.68
15–193,400,4433,222,8766,623,3198.30
20–243,247,7643,117,9596,365,7237.98
25–293,169,3603,076,6816,246,0417.83
30–343,196,6453,113,7666,310,4117.91
35–393,275,1753,219,1586,494,3338.14
40–442,833,6552,800,6625,634,3177.06
45–492,412,8752,335,6394,748,5145.95
50–542,381,6402,374,6044,756,2445.96
55–591,855,1711,860,5653,715,7364.66
60–641,636,5101,706,4383,342,9484.19
65–691,132,4641,280,0732,412,5373.02
70–74763,121917,3711,680,4922.11
75–79512,607689,4431,202,0501.51
80–84336,206473,119809,3251.01
85–89136,238265,520401,7580.50
90+38,756106,585145,3410.18
Age groupMaleFemaleTotalPercent
0–149,715,0209,210,76218,925,78223.71
15–6427,409,23826,828,34854,237,58667.95
65+2,919,3923,732,1116,651,5038.33

Structure of the population (31.XII.2017):

Age groupMaleFemaleTotalPercent
Total40 535 13540 275 39080 810 525100
0–43 326 5913 155 2586 481 8498.02
5–93 254 1773 086 5926 340 7697.85
10–143 188 3333 022 5376 210 8707.69
15–193 351 0433 175 5446 526 5878.08
20–243 294 3363 162 1746 456 5107.99
25–293 163 8893 067 6536 231 5427.71
30–343 189 0753 107 8496 296 9247.79
35–393 308 4133 252 2836 560 6968.12
40–442 891 7992 849 0205 740 8197.10
45–492 556 3642 498 7905 055 1546.26
50–542 349 1392 326 3164 675 4555.79
55–591 977 3281 989 3993 966 7274.91
60–641 651 2151 720 0233 371 2384.17
65–691 188 9861 322 9182 511 9043.11
70–74784 614952 6531 737 2672.15
75–79533 757715 4281 249 1851.55
80–84330 240471 436801 6760.99
85–89152 317282 516434 8330.54
90+43 519117 001160 5200.20
Age groupMaleFemaleTotalPercent
0–149 769 1019 264 38719 033 48823.55
15–6427 732 60127 149 05154 881 65267.91
65+3 033 4333 861 9526 895 3858.53

Structure of the population (31.XII.2018):

Age groupMaleFemaleTotalPercent
Total41 139 98040 863 90282 003 882100
0–43 327 7803 157 2066 484 9867.91%
5–93 264 6083 094 4126 358 9207.75%
10–143 254 2773 086 1466 340 4237.73%
15–193 299 4493 124 8186 424 2677.83%
20–243 347 2973 199 8326 547 1297.98%
25–293 190 0233 086 4466 276 4697.65%
30–343 205 2053 127 9486 333 1537.72%
35–393 316 6033 259 4696 576 0728.02%
40–442 953 3292 892 6975 846 0267.13%
45–492 670 1832 640 5245 310 7076.48%
50–542 372 1822 329 1424 701 3245.73%
55–592 076 8822 095 4594 172 3415.09%
60–641 692 1301 753 7313 445 8614.20%
65–691 245 9791 366 2282 612 2073.19%
70–74835 3531 021 5691 856 9222.26%
75–79539 825722 7251 262 5501.54%
80–84318 882474 854793 7360.97%
85–89182 957302 957485 9140.59%
90+47 136127 739174 8750.21%
Age groupMaleFemaleTotalPercent
0–149 846 5659 337 76419 184 32923.39%
15–6428 123 28327 510 06655 633 34967.84%
65+3 170 1324 016 0727 186 2048.76%

Structure of the population (31.XII.2019):

Age groupMaleFemaleTotalPercent
Total41 721 13641 433 86183 154 997100
0–43 254 7193 090 4176 345 1367.63%
5–93 316 6213 144 4186 461 0397.77%
10–143 288 2073 117 9636 406 1707.70%
15–193 254 8913 076 7036 331 5947.61%
20–243 392 3743 231 7046 624 0787.97%
25–293 240 6573 126 6546 367 3117.66%
30–343 221 3813 141 6366 363 0177.65%
35–393 324 7593 260 0846 584 8437.92%
40–443 016 8982 950 4865 967 3847.18%
45–492 772 8382 760 7215 533 5596.65%
50–542 367 5772 307 7964 675 3735.62%
55–592 178 4542 211 5434 389 9975.28%
60–641 754 5001 800 2693 554 7694.27%
65–691 301 3711 421 3012 722 6723.27%
70–74907 8501 109 0632 016 9132.43%
75–79560 695747 6041 308 2991.57%
80–84323 732493 998817 7300.98%
85–89192 938304 472497 4100.60%
90+50 674137 029187 7030.23%
Age groupMaleFemaleTotalPercent
0–149 859 5479 352 79819 212 34523.10%
15–6428 524 32927 867 59656 391 92567.82%
65+3 337 2604 213 4677 550 7279.08%

Population Estimates by Sex and Age Group (31.XII.2020): [25]

Age GroupMaleFemaleTotal%
Total41 915 98541 698 37783 614 362100
0–43 140 1722 981 5356 121 7077.32
5–93 349 2533 177 3406 526 5937.81
10–143 294 9853 124 9526 419 9377.68
15–193 201 5883 028 5266 230 1147.45
20–243 408 4343 255 2026 663 6367.97
25–293 240 5433 130 4116 370 9547.62
30–343 199 7103 119 1846 318 8947.56
35–393 270 5123 203 0716 473 5837.74
40–443 145 6453 089 4656 235 1107.46
45–492 788 0352 775 6315 563 6666.65
50–542 325 1902 259 4424 584 6325.48
55–592 273 0882 304 4994 577 5875.47
60–641 764 9381 809 4563 574 3944.27
65–691 399 0521 539 6632 938 7153.51
70–74960 7421 170 9632 131 7052.55
75–79583 671771 6751 355 3461.62
80–84339 767521 432861 1991.03
85–89177 532289 216466 7480.56
90+53 128146 714199 8420.24
Age groupMaleFemaleTotalPercent
0–149 784 4109 283 82719 068 23722.80
15–6428 617 68327 974 88756 592 57067.68
65+3 513 8924 439 6637 953 5559.51

Population Estimates by Sex and Age Group (31.XII.2021): [25]

Age GroupMaleFemaleTotal%
Total42 428 10142 252 17284 680 273100
0–43 033 0292 880 5805 913 6096.98
5–93 398 8123 225 3906 624 2027.82
10–143 304 8513 133 3016 438 1527.60
15–193 203 5193 026 1906 229 7097.36
20–243 445 4103 296 1706 741 5807.96
25–293 296 9193 179 9806 476 8997.65
30–343 212 6683 129 1196 341 7877.49
35–393 228 0633 158 1456 386 2087.54
40–443 294 0713 253 0916 547 1627.73
45–492 838 7662 823 4955 662 2616.69
50–542 403 7262 350 7584 754 4845.61
55–592 337 3042 369 8764 707 1805.56
60–641 776 2541 835 6623 611 9164.27
65–691 508 9901 647 4583 156 4483.73
70–74982 5731 192 4512 175 0242.57
75–79598 307794 4111 392 7181.64
80–84340 568520 841861 4091.02
85–89169 807286 741456 5480.54
90+54 464148 513202 9770.24
Age groupMaleFemaleTotalPercent
0–149 736 6929 239 27118 975 96322.41
15–6429 036 70028 422 48657 459 18667.85
65+3 654 7094 590 4158 245 1249.74

Population Estimates by Sex and Age Group (31.XII.2022): [25]

Age GroupMaleFemaleTotal%
Total42 704 11242 575 44185 279 553100
0–42 904 3792 759 2415 663 6206.64
5–93 404 9723 230 1056 635 0777.78
10–143 303 3713 133 0436 436 4147.55
15–193 244 5003 070 6096 315 1097.41
20–243 388 7243 245 9846 634 7087.78
25–293 334 4393 218 7306 553 1697.68
30–343 199 0283 116 0196 315 0477.41
35–393 215 4513 151 2906 366 7417.47
40–443 321 8733 284 1566 606 0297.75
45–492 893 8312 869 7035 763 5346.76
50–542 543 5882 511 0365 054 6245.93
55–592 305 8462 321 2954 627 1415.53
60–641 893 8621 962 8093 856 6714.52
65–691 523 4121 661 8773 185 2893.74
70–741 031 8971 232 2222 264 1192.65
75–79617 021827 7771 444 7981.69
80–84353 290540 167893 4571.05
85–89165 676284 407450 0830.53
90+58 952154 971213 9230.25
Age groupMaleFemaleTotalPercent
0–149 612 7229 122 38918 735 11121.97
15–6429 341 14228 751 63158 092 77368.12
65+3 750 2484 701 4218 451 6699.91

Population Estimates by Sex and Age Group (31.XII.2023): [25]

Age GroupMaleFemaleTotal%
Total42 734 07142 638 30685 372 377100
0–42 741 8732 606 1815 348 0546.26
5–93 368 8253 197 6616 566 4867.69
10–143 283 7643 113 3296 397 0937.49
15–193 283 5113 113 0086 396 5197.49
20–243 317 0073 158 5136 475 5207.59
25–293 330 8513 212 2106 543 0617.66
30–343 172 4823 094 6836 267 1657.34
35–393 190 7623 138 4846 329 2467.41
40–443 298 6823 265 9566 564 6387.69
45–492 932 7672 894 0245 826 7916.83
50–542 637 6802 634 9865 272 6666.18
55–592 315 3132 311 2094 626 5225.42
60–641 980 1982 055 6124 035 8104.73
65–691 554 0591 686 3543 240 4133.80
70–741 077 7881 267 5532 345 3412.75
75–79656 329886 5991 542 9281.81
80–84357 820546 603904 4231.06
85–89163 397288 413451 8100.53
90+70 963166 928237 8910.28
Age groupMaleFemaleTotalPercent
0–149 394 4628 917 17118 311 63321.45
15–6429 459 25328 878 68558 337 93868.33
65+3 880 3564 842 4508 722 80610.22

Immigration

Immigration to Turkey is the process by which people migrate to Turkey to reside in the country. After the dissolution of the Ottoman Empire and following Turkish War of Independence, an exodus by the large portion of Turkish (Turkic) and Muslim peoples from the Balkans (Balkan Turks, Albanians, Bosniaks, Pomaks), Caucasus (Abkhazians, Ajarians, Circassians, Chechens), Crimea (Crimean Tatar diaspora), and Crete (Cretan Turks) took refuge in present-day Turkey and moulded the country's fundamental features. Trends of immigration towards Turkey continue to this day, although the motives are more varied and are usually in line with the patterns of global immigration movements — Turkey, for example, receives many economic migrants from nearby countries such as Armenia, the Moldova, Georgia, Iran, and Azerbaijan, but also from Central Asia, Ukraine and Russia. Turkey's migrant crisis during the 2010s saw high numbers of people arriving in Turkey, particularly those fleeing the Syrian civil war.

As of August 2023, the number of refugees of the Syrian civil war in Turkey was estimated to be 3,307,882 people. The number of Syrians had decreased by 205,894 people since the beginning of the year. [26] In 2022, nearly 100 000 Russian citizens migrated to Turkey, becoming the first in the list of foreigners who moved to Turkey, meaning an increase of more than 218% from 2021. [27]

In order to obtain Turkish citizenship there is a range of legal grounds, which can include: reunification with their family, marriage to a Turkish citizen, for the purchase of real estate worth $400,000 from a Turkish citizen or company. [28] The minimum investment amount was increased in May 2022, previously it was enough to invest $250,000. Also the basis is to work in Turkey, training, business, medical treatment, refugee status.

In 2023 the foreign population of Türkiye decreased by 253,293 down to 1,570,543. [29]

Population in Turkey by country of citizenship by the end of each years: [25]

Country202220212020
Total people living in Turkey85 279 55384 680 27383 614 362
Flag of Turkey.svg  Turkey 83 455 717 (97.86%)82 888 237 (97.88%)82 280 952 (98.41%)
Total foreign population1 823 836 (2.14%)1 792 036 (2.12%)1 333 410 (1.59%)
Flag of Iraq.svg  Iraq 275 305 (0.32%)322 015 (0.38%)281 074 (0.34%)
Flag of the Taliban.svg  Afghanistan 186 160 (0.22%)183 567 (0.22%)158 252 (0.19%)
Flag of Russia.svg  Russian Federation 151 049 (0.18%)66 786 (0.08%)43 679 (0.05%)
Flag of Iran.svg  Iran 117 026 (0.14%)128 883 (0.15%)68 561 (0.08%)
Flag of Turkmenistan.svg  Turkmenistan 116 447 (0.14%)123 965 (0.15%)91 218 (0.11%)
Flag of Germany.svg  Germany 110 453 (0.13%)102 592 (0.12%)92 284 (0.11%)
Flag of Syria.svg  Syria 99 360 (0.12%)104 554 (0.12%)88 907 (0.11%)
Flag of Azerbaijan.svg  Azerbaijan 68 884 (0.08%)68 562(0.08%)48 495 (0.06%)
Flag of Uzbekistan.svg  Uzbekistan 61 754 (0.07%)71 145 (0.08%)36 510 (0.04%)
Flag of Ukraine.svg  Ukraine 50 357 (0.06%)23 377 (0.03%)17 505 (0.02%)
Flag of Kazakhstan.svg  Kazakhstan 45 530 (0.05%)39 454 (0.05%)23 645 (0.03%)
Flag of Egypt.svg  Egypt 33 040 (0.04%)34 162 (0.04%)25 475 (0.03%)
Flag of Palestine.svg  Palestine 26 278 (0.03%)28 027 (0.03%)17 915 (0.02%)
Flag of Kyrgyzstan (2023).svg  Kyrgyzstan 24 485 (0.03%)26 541 (0.03%)18 019 (0.02%)
Flag of Jordan.svg  Jordan 22 733 (0.03%)23 656 (0.03%)14 260 (0.02%)
Flag of Libya.svg  Libya 21 677 (0.03%)24 188 (0.03%)18 607 (0.02%)
Flag of Austria.svg  Austria 21 311 (0.02%)19 900 (0.02%)18 047 (0.02%)
Flag of Somalia.svg  Somalia 20 906 (0.02%)28 081 (0.03%)17 245 (0.02%)
Flag of Yemen.svg  Yemen 19 099 (0.02%)18 094 (0.02%)14 927 (0.02%)
Flag of Morocco.svg  Morocco 18 482 (0.02%)20 520 (0.02%)12 122 (0.01%)
Flag of the United Kingdom.svg  United Kingdom 17 193 (0.02%)16 440 (0.02%)13 985 (0.02%)
Flag of the People's Republic of China.svg  China 16 880 (0.02%)20 486 (0.02%)18 740 (0.02%)
Flag of Bulgaria.svg  Bulgaria 16 612 (0.02%)15 426 (0.02%)14 195 (0.02%)
Flag of Pakistan.svg  Pakistan 16 505 (0.02%)17 290 (0.02%)7 248 (0.01%)
Flag of Georgia.svg  Georgia 14 680 (0.02%)19 276 (0.02%)15 661 (0.02%)
Flag of Greece.svg  Greece 13 583 (0.02%)12 569 (0.01%)12 137 (0.01%)
Flag of Nigeria.svg  Nigeria 12 928 (0.02%)12 920 (0.02%)7 120 (0.01%)
Flag of the United States.svg  United States 12 793 (0.02%)12 773 (0.02%)9 032 (0.01%)
Flag of Lebanon.svg  Lebanon 12 430 (0.01%)13 242 (0.02%)5 943 (0.01%)
Flag of Algeria.svg  Algeria 12 248 (0.01%)10 698 (0.01%)5 914 (0.01%)
Flag of Sudan.svg  Sudan 11 613 (0.01%)9 538 (0.01%)3 193 (<0.01%)
Flag of Indonesia.svg  Indonesia 11 280 (0.01%)10 219 (0.01%)5 226 (0.01%)
Flag of the Netherlands.svg  Netherlands 8 104 (0.01%)7 686 (0.01%)6 550 (0.01%)
Flag of Tajikistan.svg  Tajikistan 7 153 (0.01%)7 965 (0.01%)3 626 (<0.01%)
Flag of Moldova.svg  Moldova 6 790 (0.01%)7 546 (0.01%)6 295 (0.01%)
Flag of Kuwait.svg  Kuwait 6 190 (0.01%)5 498 (0.01%)3 559 (<0.01%)
Flag of Ethiopia.svg  Ethiopia 6 165 (0.01%)6 633 (0.01%)2 936 (<0.01%)
Flag of Tunisia.svg  Tunisia 6 075 (0.01%)6 033 (0.01%)2 961 (<0.01%)
Flag of Belarus.svg  Belarus 5 169 (0.01%)3 873 (<0.01%)
Flag of India.svg  India 4 669 (0.01%)3 092 (<0.01%)
Flag of France.svg  France 4 526 (0.01%)4 294 (0.01%)3 181 (<0.01%)

Internal migration

Place of origin (rows) versus place of residence (columns) for Turkish citizens in 2014 [30]
Regions İstanbul West Marmara Aegean East Marmara West Anatolia Mediterranean Central Anatolia West Black Sea East Black Sea Northeast Anatolia Central East Anatolia Southeast Anatolia Total Population
İstanbul 2,162,58879,00972,12384,68938,80238,6734,85811,9769,1473,5333,6674,7542,513,819
West Marmara 523,7252,378,938187,256135,36444,40927,3765,14010,2384,5135,2737,1108,8613,338,203
Aegean 297,14376,5187,047,801210,522134,073166,78516,60622,25210,35414,93620,38828,2248,045,602
East Marmara 520,69867,299131,5864,317,877187,04361,78210,71533.37110,7018,0749,77512,2865,371,207
West Anatolia 272,83535,919259,387127,7943,721,634192,93449,94229,5458,46810,36013,72720,8504,743,395
Mediterranean 470,67353,295250,529111,393228,3987,329,964100,72932,46116,96321,66746,013181,8748,843,959
Central Anatolia 1,346,00792,421297,114235,4071,223,857305,3433,466,97170,72916,60420,20432,15336,8187,143,628
West Black Sea 2,637,016186,103252,628458,730956,151133,05354,5783,982,18542,93518,87821,75727,7358,771,749
East Black Sea 1,918,80596,494152,843529,110241,80170,82319,104198,8692,382,70433,85411,85213,1405,669,399
Northeast Anatolia 1,580,876120,086504,588593,882344,929101,60063,02934,65632,7612,009,25339,92120,5765,446,157
Central East Anatolia 1,293,15786,315359,161299,390167,451393,10231,61222,06411,07031,7093,438,577133,8626,267,470
Southeast Anatolia 1,197,95965,538445,279174,765156,4891,002,77133,87623,66611,68922,036150,0287,738,94111,023,037
Total population14,221,4823,337,9359,960,2957,278,9237,445,0379,824,2063,857,1604,472,0122,557,9092,199,7773,794,9688,227,92177,177,625

Ethnicity

Modern Turkey was founded by Mustafa Kemal Atatürk as secular (Laiklik, Turkish adaptation of French Laïcité), i.e. without a state religion, or separate ethnic divisions/ identities. The concept of "minorities" has only been accepted by the Republic of Turkey as defined by the Treaty of Lausanne (1923) and thence strictly limited to Greeks, Jews and Armenians, only based on religious affiliation, excluding from the scope of the concept the ethnic identities of these minorities as of others such as the Kurds who make up 15% of the country; others include Assyrians/Syriacs of various Christian denominations, Alevis and all the others. [31] [32] [33] [34] Provisions of the Lausanne Treaty were extended to Bulgarians in Turkey by the Turkey-Bulgaria Friendship Treaty (Türkiye ve Bulgaristan Arasındaki Dostluk Antlaşması) of 18 October 1925. [33] [35] [36] [37] According to the Ministry of Foreign Affairs (Turkey), as of 2008, there were 89,000 Turkish citizens belonging to one of the three recognized minorities, two thirds of Armenian descent. [38] On 18 June 2013, the Ankara 13th Circuit Administrative Court unanimously ruled that the Assyrians were included as beneficiaries of the Lausanne Treaty, [39] so that Assyrians were allowed to open the first school teaching in their mother tongue. [40] [41]

The word Turk or Turkish also has a wider meaning in a historical context because, at times, especially in the past, it has been used to refer to all Muslim inhabitants of the Ottoman Empire irrespective of their ethnicity. [42]

According to the 2016 edition of the CIA World Factbook, 70–75% of Turkey's population consists of ethnic Turks, with Kurds accounting for 19% and other minorities between 6 and 11%. [43] According to Milliyet, a 2008 report prepared for the National Security Council of Turkey by academics of three Turkish universities in eastern Anatolia suggested that there are approximately 55 million ethnic Turks, 9.6 million Kurds, 3 million Zazas, 2.5 million Circassians, 2 million Bosniaks, 500,000–1.3 million Albanians, 1,000,000 Georgians, 870,000 Arabs, 600,000 Pomaks, 80,000 Laz, 60,000 Armenians, 30,000 British, 25,000 Assyrians/Syriacs, 20,000 Jews, and 15,000 Greeks, 500 Yazidis living in Turkey. [44]

According to a survey published in 2022 by Konda Research, Turks make up 77% of the population, while 19% self-identify as Kurd. Arabs (Syrian refugees excluded) make up 2%, and other ethnic groups are 2% of the population. [45]

Since the immigration to the big cities in the west of Turkey, interethnic marriage has become more common. A recent study estimates that there are 2,708,000 marriages between Turks and Kurds. [46]

According to a survey done in March 2020 by Area Araştırma, 20.4% of the total population of Turkey claim to be Kurdish (either Kurmanji speaking or Zazaki speaking).

Ethnolinguistic estimates in 2014 by Ethnologue and Jacques Leclerc: [47] [48] [49]

PeoplePopulationPercentageLanguageStatus
Anatolian Turks 53,402,00070.6% Turkish 1 (National)
Kurmanji Kurds 8,127,00010.7% Kurmanji 3 (Wider communication)
Turcophones, Kurds 5,881,0007.7% Turkish 1 (National)
Zaza 1,155,0001.5% Zaza 5 (Developing)
Arabs 1,133,0001.4% Levantine Arabic
Kabardians, Circassians 1,062,0001.4 % Kabardian 5 (Developing)
Iraqi Arabs 722,0000.9% Mesopotamian Arabic 6a (Vigorous)
Azerbaijani 540,0000.7% Azerbaijani 5 (Developing)
Romani 500,000 (1985)0.7% Romani, Domari
Gagauzes 418,0000.5% Balkan Gagauz Turkish 7 (Shifting)
Pomaks 351,0000.4% Bulgarian 5 (Dispersed)
Pontic Greeks 321,0000.4% Pontic Greek 6a (Vigorous)
Adyghe, Circassians 316,0000.4% Adyghe 5 (Developing)
Alevi Kurds 184,0000.2% Zazaki
Georgians 151,0000,1 % Georgian 6b (Threatened)
Bosniaks 101,0000.1% Bosnian
Chechens 101,0000.1% Chechen
Crimean Tatars 100,0000.1% Crimean Tatar 5 (Developing)
Lazi 93,0000.1% Laz language 6b (Threatened)
Karakalpaks 74,000 Karakalpak
Albanians 66,000 Tosk Albanian 6b (Threatened)
Armenians 61,000 Armenian 6b (Threatened)
Abkhazians 44,000 Abkhazian 6b (Threatened)
Han Chinese 38,000 Chinese
Ossetians 37,000 Ossetian
British 35,000 English
Bulgarians 32,000 Bulgarian
Jews 30,000 Turkish, Ladino 7 (Shifting)
Tatars 26,000 Tatar
Assyrians 25,000 Aramaic
22,000 Urdu
Assyrians 15,000 Turoyo 6b (Threatened)
Turks other (Hemshin, Meskhetian Turks, Gajal)57,000 Turkish
Kurds other (Herki and Shikaki)62,000 Kurdish
Other180,000
Total75,566,800

Languages

No exact data is available concerning the different ethnic groups in Turkey. The last census data according to language date from 1965 and major changes may have occurred since then. However, it is clear that the Turkish are in the majority, while the largest minority groups are Kurds and Arabs. Smaller minorities are the Armenians, Greeks and others.

Population of Turkey according to language
LanguageCensus 1935 [50] Census 1945 [51] Census 1965 [51]
Number%Number%Number%
Turkish 13,828,00086.0216,598,03788.328,175,57990.2
Kurdish 1,480,2469.161,476,5627.92,108,7216.9
Zazaki 147,7070.5
Arabic 153,6870.95247,2941.3368,9711.2
Greek 108,7250.6788,6800.549,1430.2
Circassian 91,9720.5766,6910.457,3370.2
Ladino 79,0000.4951,0190.39,1240.0
Armenian 57,5990.3647,7280.332,4840.1
Laz 63,2530.3939,3230.327,7150.1
Georgian 57,3250.3540,0760.232,3340.1
Abaza 10,0990.068,6020.010,6430.0
Total16,157,45018,790,17431,391,207

A possible list of ethnic groups living in Turkey could be as follows: [52]

  1. Turkic-speaking peoples: Turks, Azerbaijanis, Tatars, Karachays, Uzbeks, Crimean Tatars and Uyghurs
  2. Indo-European-speaking peoples: Kurds, Zazas, [53] Megleno-Romanians, [49] Bosniaks, Albanians, Pomaks, Ossetians, Armenians, Hamshenis, Goranis and Greeks
  3. Semitic-speaking peoples: Arabs, Jews and Assyrians/Syriacs
  4. Caucasian-speaking peoples: Circassians, Georgians, Lazs and Chechens

Religion

Religious affiliation

Muslim and non-Muslim population in Turkey, 1914–2005 (in thousands) [54]
Year191419271945196519902005
Muslims12,94113,29018,51131,13956,86071,997
Greeks1,5491101047683
Armenians1,2047760646750
Jews1288277382927
Others1767138745045
Total15,99713,63018,79031,39157,00572,120
Percentage non-Muslim19.12.51.50.80.30.2

The percentage of non-Muslims in Turkey fell from 19.1% in 1914 to 2.5% percent in 1927. [54] The drop was the result of the late Ottoman genocides, the population exchange between Greece and Turkey [55] and the emigration of Christians. [56] The 1942 Wealth Tax on non-Muslims, the emigration of many of Turkish Jews to Israel after 1948, and the 1955 Istanbul pogrom further contributed to the decline of Turkey's non-Muslim population.

There are no official statistics of people's religious beliefs nor is it asked in the census. According to the government, 99.8% of the Turkish population is Muslim, mostly Sunni, some 8 million are Alevis. [57] The remaining 0.2% is other - mostly Christians and Jews. [11] However, these are based on the existing religion information written on every citizen's national id card, that is automatically passed on from the parents to every newborn, and do not necessarily represent individual choice. Religious records can be changed or even blanked on the request of citizen, by filing an e-government application since May 2020, using a valid electronic signature to sign the electronic application. Any change in religion records additionally results in a new ID card being issued. Any change in religion record also leaves a permanent trail in the census record, however, record of change of religion is not accessible except for the citizen in question, next-of-kins of the citizen in question, the citizenship administration and courts. [58]

In a poll conducted by Sabancı University in 2006, 98.3% of Turks revealed they were Muslim. [59] A Eurobarometer Poll in 2005 reported that in a poll 98% of Turkish citizens answered that "they believe there is a God", while 1% responded that "they do not believe there is any sort of spirit, God, or life force". [60] In a Pew Research Center survey, 53% of Turkey's Muslims said that "religion is very important in their lives". [61] Based on the Gallup Poll 2006–08, Turkey was defined as More religious, in which over 63 percent of people believe religion is important. [62] [63] According to the Turkish Economic and Social Studies Foundation, 62% of women wear the headscarf or hijab in Turkey. [64] [65] [66]

A poll conducted by Eurobarometer and KONDA and some other research institutes in 2013 showed that around 0.5% of the population had no religion. Another poll conducted by the same institutions in 2018 showed that 3% of those interviewed had no religion. [67] [68]

According to Ipsos survey, [69] in 2016 Islam was the major religion in Turkey comprising 82% of the total population, followed by religiously unaffiliated people, comprising 13% of the population, and Christians, forming 0.2%.

Religiosity

The vast majority of the present-day Turkish people are Muslim and the most popular sect is the Hanafite school of Sunni Islam, which was officially espoused by the Ottoman Empire; according to the KONDA Research and Consultancy survey carried out throughout Turkey on 2007: [70] [57] [71]

In 2018 KONDA released a new study: [72] [73]

Among those aged between 15 and 29 years old: [74]

There is concern over the future of the Greek Orthodox Patriarchate, which suffers from a lack of trained clergy due to the closure of the Halki school. The state does not recognise the Ecumenical status of the Patriarch of Constantinople. [75]

See also

Related Research Articles

<span class="mw-page-title-main">Demographics of Iraq</span>

The Iraqi people are people originating from the country of Iraq.

<span class="mw-page-title-main">Demographics of Jordan</span>

Jordan has a population of more than 11.1 million inhabitants as of 2023. Jordanians are the citizens of Jordan. Around 94% of Jordanians are Arabs, while the remaining 6% belong to other ethnic minorities, including Circassians, Chechens, Armenians and Kurds. Around 2.9 million inhabitants are non-citizens, a figure including refugees, legal and illegal immigrants. Jordan's annual population growth rate stands at 3.05% as of 2023, with an average birth rate of 2.8. There were 1,977,534 households in Jordan in 2015, with an average of 4.8 persons per household.

<span class="mw-page-title-main">Demographics of Lebanon</span> Ethnic group

This is a demography of the population of Lebanon including population density, education level, health of the populace, economic status, religious affiliations and other aspects of the population.

<span class="mw-page-title-main">Demographics of North Macedonia</span>

Demographic features of the population of North Macedonia include population density, ethnicity, education level, health of the populace, economic status, religious affiliations and other aspects of the population.

<span class="mw-page-title-main">Demographics of Syria</span>

Syria's estimated pre–Syrian Civil War 2011 population was 22 ±.5 million permanent inhabitants, which included 21,124,000 Syrians, as well as 1.3 million Iraqi refugees and over 500,000 Palestinian refugees. The war makes an accurate count of the Syrian population difficult, as the numbers of Syrian refugees, internally displaced Syrians and casualty numbers are in flux. The CIA World Factbook showed an estimated 20.4m people as of July 2021. Of the pre-war population, six million are refugees outside the country, seven million are internally displaced, three million live in rebel-held territory, and two million live in the Kurdish-ruled Autonomous Administration of North and East Syria.

<span class="mw-page-title-main">Treaty of Lausanne</span> 1923 peace treaty between Turkey and Allies

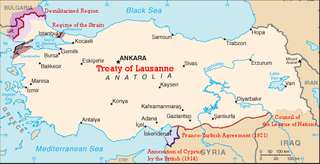
The Treaty of Lausanne is a peace treaty negotiated during the Lausanne Conference of 1922–23 and signed in the Palais de Rumine in Lausanne, Switzerland, on 24 July 1923. The treaty officially resolved the conflict that had initially arisen between the Ottoman Empire and the Allied French Republic, British Empire, Kingdom of Italy, Empire of Japan, Kingdom of Greece, Kingdom of Serbia, and the Kingdom of Romania since the outset of World War I. The original text of the treaty is in English and French. It emerged as a second attempt at peace after the failed and unratified Treaty of Sèvres, which had sought to partition Ottoman territories. The earlier treaty, signed in 1920, was later rejected by the Turkish National Movement which actively opposed its terms. As a result of the Greco-Turkish War, İzmir was reclaimed, and the Armistice of Mudanya was signed in October 1922. This armistice provided for the exchange of Greek-Turkish populations and allowed unrestricted civilian, non-military passage through the Turkish Straits.

Minorities in Greece are small in size compared to Balkan regional standards, and the country is largely ethnically homogeneous. This is mainly due to the population exchanges between Greece and neighboring Turkey and Bulgaria, which removed most Muslims and those Christian Slavs who did not identify as Greeks from Greek territory. The treaty also provided for the resettlement of ethnic Greeks from those countries, later to be followed by refugees. There is no official information for the size of the ethnic, linguistic and religious minorities because asking the population questions pertaining to the topic have been abolished since 1951.

<span class="mw-page-title-main">Greeks in Turkey</span> Ethnic group in Turkey

The Greeks in Turkey constitute a small population of Greek and Greek-speaking Eastern Orthodox Christians who mostly live in Istanbul, as well as on the two islands of the western entrance to the Dardanelles: Imbros and Tenedos. Greeks are one of the four ethnic minorities officially recognized in Turkey by the 1923 Treaty of Lausanne, together with Jews, Armenians, and Bulgarians.

<span class="mw-page-title-main">Turks of Western Thrace</span> Turkish ethnic minority living in Western Thrace region of Greece

Turks of Western Thrace are ethnic Turks who live in Western Thrace, in the province of East Macedonia and Thrace in Northern Greece.

<span class="mw-page-title-main">Muslim minority of Greece</span>

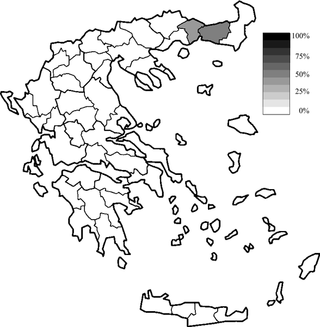
The Muslim minority of Greece is the only explicitly recognized minority in Greece. It numbered 97,605 according to the 1991 census, and unofficial estimates ranged up to 140,000 people or 1.24% of the total population, according to the United States Department of State.

<span class="mw-page-title-main">Religion in Turkey</span>

Religion in Turkey consists of various religious beliefs. While it is known that Islam is the most common religion in the country, published data on the proportion of people belonging to this religion are contradictory. The state registering everyone as Muslim by birth misleads the percentage of Muslims in Turkey. There are many people who follow other religions or do not adhere to any religion but are officially classified as 'Muslim' in official records unless they make a contrary claim. According to the state, 99.8% of the population is initially registered as Muslim. As much as 90% of the population follows Sunni Islam. Most Turkish Sunni Muslims belong to the Hanafi school of jurisprudence. The remaining 0.2% are Christians and adherents of other officially recognised religions like Judaism. The official number of Muslims include people who are irreligious; converted people and anyone who is of a different religion from their Muslim parents, but has not applied for a change of their individual records. These records can be changed or even blanked out on the request of the citizen using a valid electronic signature to sign the electronic application.

<span class="mw-page-title-main">Turkey</span> Country in West Asia and Southeast Europe

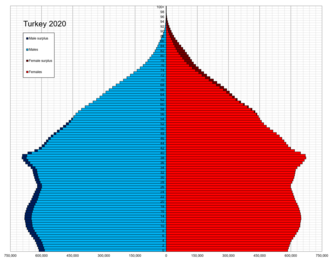
Turkey, officially the Republic of Türkiye, is a country mainly in Anatolia in West Asia, with a smaller part called East Thrace in Southeast Europe. It borders the Black Sea to the north; Georgia, Armenia, Azerbaijan, and Iran to the east; Iraq, Syria, and the Mediterranean Sea to the south; and the Aegean Sea, Greece, and Bulgaria to the west. Turkey is home to over 85 million people; most are ethnic Turks, while ethnic Kurds are the largest ethnic minority. Officially a secular state, Turkey has a Muslim-majority population. Ankara is Turkey's capital and second-largest city. Istanbul is its largest city, and its economic and financial center, as well as the largest city in Europe. Other major cities include İzmir, Bursa and Antalya.

<span class="mw-page-title-main">Kurdish nationalism</span> Political movement

Kurdish nationalism is a nationalist political movement which asserts that Kurds are a nation and espouses the creation of an independent Kurdistan from Iran, Iraq, Syria, and Turkey.

<span class="mw-page-title-main">Demographics of the Arab world</span>

The Arab world consists of 22 states. As of 2021, the combined population of all the Arab states was around 475 million people.

<span class="mw-page-title-main">Languages of Turkey</span>

The languages of Turkey, apart from the official language Turkish, include the widespread Kurdish (Kurmanji), Zazaki, and Arabic, and a number of less common minority languages. Four minority languages are officially recognized in the Republic of Turkey by the 1923 Treaty of Lausanne and the Turkey-Bulgaria Friendship Treaty of 18 October 1925: Armenian, Bulgarian, Greek, and Hebrew. In 2013, the Ankara 13th Circuit Administrative Court ruled that the minority provisions of the Lausanne Treaty should also apply to Assyrians in Turkey and the Syriac language.

<span class="mw-page-title-main">Christianity in the Middle East</span> Ethnic group

Christianity, which originated in the Middle East during the 1st century AD, is a significant minority religion within the region, characterized by the diversity of its beliefs and traditions, compared to Christianity in other parts of the Old World. Christians now make up approximately 5% of the Middle Eastern population, down from 13% in the early 20th century. Cyprus is the only Christian majority country in the Middle East, with Christians forming between 76% and 78% of the country's total population, most of them adhering to Eastern Orthodox Christianity. Lebanon has the second highest proportion of Christians in the Middle East, around 40%, predominantly Maronites. Egypt has the next largest proportion of Christians, at around 10% of its total population. Copts, numbering around 10 million, constitute the single largest Christian community in the Middle East.

<span class="mw-page-title-main">Religion in Syria</span>

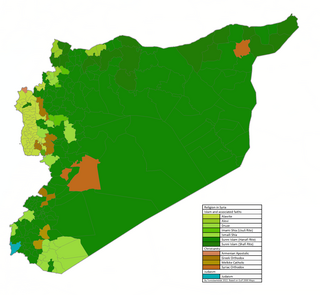
Religion in Syria refers to the range of religions practiced by the citizens of Syria. Historically, the region has been a mosaic of diverse faiths with a range of different sects within each of these religious communities.

<span class="mw-page-title-main">Ethnic groups in the Middle East</span>

Ethnic groups in the Middle East, in the 'transcontinental' region which is commonly a geopolitical term designating the intercontinental region comprising West Asia without the South Caucasus, and also comprising Egypt in North Africa. The region has historically been a crossroad of different cultures and languages. Since the 1960s, the changes in political and economic factors have significantly altered the ethnic composition of groups in the region. While some ethnic groups have been present in the region for millennia, others have arrived fairly recently through immigration. The largest socioethnic groups in the region are Arabs, Turks, Persians, Kurds, and Azerbaijanis but there are dozens of other ethnic groups that have hundreds of thousands, and sometimes millions of members.

Minorities in Turkey form a substantial part of the country's population, representing an estimated 25 to 28 percent of the population. Historically, in the Ottoman Empire, Islam was the official and dominant religion, with Muslims having more rights than non-Muslims, whose rights were restricted. Non-Muslim (dhimmi) ethno-religious groups were legally identified by different millet ("nations").

<span class="mw-page-title-main">Irreligion in Turkey</span>

Irreligion in Turkey refers to the extent of the lack, rejection of, or indifference towards religion in the Republic of Turkey. Based on surveys, Islam is the predominant religion and irreligious people form a minority in Turkey. Precise estimates of the share of Deists, atheists, agnostics, and other unaffiliated people in the population vary, though in the survey averages they make up more percentages than Christians and Jews in the country.

References

  1. "TURKSTAT Corporate". data.tuik.gov.tr. Retrieved 25 May 2024.
  2. "TurkStat".
  3. "TURKSTAT Corporate". data.tuik.gov.tr. Retrieved 6 February 2024.
  4. "TÜİK Kurumsal".
  5. "TÜİK Kurumsal".
  6. CO2 Emissions from Fuel Combustion Archived 12 October 2009 at the Wayback Machine Population 1971–2008 (pdf Archived 2012-01-06 at the Wayback Machine pages 83–85) IEA (OECD/ World Bank) original population ref e.g. in IEA Key World Energy Statistics 2010, p. 57.
  7. "Population Statistics And Projections". Turkstat.gov.tr. Retrieved 17 June 2014.
  8. "Census of Population; Social and Economic Characteristics of Population, Turkey". Turkstat.gov.tr. Retrieved 15 April 2016.
  9. "World Population Prospects – Population Division – United Nations" . Retrieved 16 July 2017.
  10. "Türkiye'de yaşlı nüfus arttı". www.hurriyet.com.tr (in Turkish). 18 March 2020. Retrieved 4 August 2020.
  11. 1 2 3 4 5 "CIA World Factbook". CIA. 2018. Archived from the original on 10 January 2021. Retrieved 8 April 2019.
  12. "Türkiye'nin nüfusu (2020) belli oldu". www.sozcu.com.tr (in Turkish). 2 April 2020. Retrieved 4 August 2020.
  13. "Nüfus İstatistikleri Portalı". nip.tuik.gov.tr. Retrieved 17 January 2024.
  14. "World Population Prospects: The 2017 Revision". Esa.un.org. 8 October 2018.
  15. "::Welcome to Turkish Statistical Institute(TurkStat)'s Web Pages". TurkStat. Retrieved 17 June 2014.
  16. "Turkish Statistical Institute". Turkstat.gov.tr. Retrieved 17 June 2014.
  17. Turkish Statistical Institute (TurkStat) (31 August 2012). "Turkish Statistical Institute Birth Statistics 2012". Turkstat.gov.tr. Retrieved 17 June 2014.
  18. "The DHS Program – Quality information to plan, monitor and improve population, health, and nutrition programs". Dhsprogram.com. Retrieved 8 November 2017.
  19. 1 2 "Spatial Distribution of Total Fertility Rate in Turkey" (PDF). Ankara University. 2004. Retrieved 16 May 2016.
  20. 1 2 3 4 5 6 7 8 9 10 11 12 "TurkStat". TurkStat. 2013. Retrieved 22 March 2015.
  21. "İllerin aldığı, verdiği göç, net göç ve net göç hızı, 1980–2018". Turk.gov.ty. Archived from the original on 16 March 2018. Retrieved 8 November 2017.
  22. (TurkStat), Turkish Statistical Institute. "Turkish Statistical Institute The Results of Address Based Population Registration System 2015". Turkstat.gov.tr. Retrieved 8 November 2017.
  23. "İllerin aldığı, verdiği göç, net göç ve net göç hızı, 1980–2016". Turkstat.gov.tr. Retrieved 8 November 2017.
  24. "Yaş grubu ve cinsiyete göre il/ilçe merkezi ve belde/köy nüfusu, 2007–2016". Turkstat.gov.tr. Retrieved 8 November 2017.
  25. 1 2 3 4 5 "TÜİK Kurumsal".
  26. "Number of Syrians in Turkey July 2023 – Refugees Association". multeciler.org.tr.
  27. Airport, Turkish Airlines planes are parked at the new Istanbul (24 July 2023). "Russian migration to Turkey spikes by 218% in aftermath of Ukraine war - Al-Monitor: Independent, trusted coverage of the Middle East". www.al-monitor.com.
  28. "Условия приобретения гражданства Турции". Гражданство Турции. Retrieved 1 June 2022.
  29. "The Results of Address Based Population Registration System, 2023".
  30. TurkStat
  31. Kaya, Nurcan (24 November 2015). "Teaching in and Studying Minority Languages in Turkey: A Brief Overview of Current Issues and Minority Schools". European Yearbook of Minority Issues Online. 12 (1): 315–338. doi:10.1163/9789004306134_013. ISSN   2211-6117. Turkey is a nation–state built on remnants of the Ottoman Empire where non-Muslim minorities were guaranteed the right to set up educational institutions; however, since its establishment, it has officially recognised only Armenians, Greeks and Jews as minorities and guaranteed them the right to manage educational institutions as enshrined in the Treaty of Lausanne. [...] Private language teaching courses teach 'traditionally used languages', elective language courses have been introduced in public schools and universities are allowed to teach minority languages.
  32. Toktas, Sule (2006). "EU enlargement conditions and minority protection : a reflection on Turkey's non-Muslim minorities". East European Quarterly. 40: 489–519. ISSN   0012-8449. Turkey signed the Covenant on 15 August 2000 and ratified it on 23 September 2003. However, Turkey put a reservation on Article 27 of the Covenant which limited the scope of the right of ethnic, religious or linguistic minorities to enjoy their own culture, to profess and practice their own religion or to use their own language. This reservation provides that this right will be implemented and applied in accordance with the relevant provisions of the Turkish Constitution and the 1923 Treaty of Lausanne. This implies that Turkey grants educational right in minority languages only to the recognized minorities covered by the Lausanne who are the Armenians, Greeks and the Jews.
  33. 1 2 Bayır, Derya (2013). Minorities and nationalism in Turkish law. Cultural diversity and law. Farnham: Ashgate. pp. 88–90, 203–204. ISBN   978-1-4094-7254-4. Oran farther points out that the rights set out for the four categories are stated to be the 'fundamental law' of the land, so that no legislation or official action shall conflict or interfere with these stipulations or prevail over them (article 37). [...] According to the Turkish state, only Greek, Armenian and Jewish non-Muslims were granted minority protection by the Lausanne Treaty. [...] Except for non-Muslim populations - that is, Greeks, Jews and Armenians - none of the other minority groups' language rights have been de jure protected by the legal system in Turkey.
  34. Phillips, Thomas James (16 December 2020). "The (In-)Validity of Turkey's Reservation to Article 27 of the International Covenant on Civil and Political Rights". International Journal on Minority and Group Rights. 27 (1): 66–93. doi:10.1163/15718115-02701001. ISSN   1385-4879. The fact that Turkish constitutional law takes an even more restrictive approach to minority rights than required under the Treaty of Lausanne was recognised by the UN Committee on the Elimination of All Forms of Racial Discrimination (CERD) in its concluding observations on the combined fourth to sixth periodic reports of Turkey. The CERD noted that "the treaty of Lausanne does not explicitly prohibit the recognition of other groups as minorities" and that Turkey should consider recognising the minority status of other groups, such as Kurds. 50 In practice, this means that Turkey grants minority rights to "Greek, Armenian and Jewish minority communities while denying their possible impact for unrecognized minority groups (e.g. Kurds, Alevis, Arabs, Syriacs, Protestants, Roma etc.)".
  35. Toktaş, Şule; Araş, Bulent (2009). "The EU and Minority Rights in Turkey". Political Science Quarterly. 124 (4): 697–720. doi:10.1002/j.1538-165X.2009.tb00664.x. ISSN   0032-3195. JSTOR   25655744.
  36. Köksal, Yonca (2006). "Minority Policies in Bulgaria and Turkey: The Struggle to Define a Nation". Southeast European and Black Sea Studies. 6 (4): 501–521. doi:10.1080/14683850601016390. ISSN   1468-3857.
  37. Özlem, Kader (2019). "An Evaluation on Istanbul's Bulgarians as the "Invisible Minority" of Turkey". Turan-Sam. 11 (43): 387–393. ISSN   1308-8041.
  38. "Foreign Ministry: 89,000 minorities live in Turkey". Today's Zaman . 15 December 2008. Archived from the original on 1 May 2010. Retrieved 15 December 2008.
  39. Akbulut, Olgun (19 October 2023). "For Centenary of the Lausanne Treaty: Re-Interpretation and Re-Implementation of Linguistic Minority Rights of Lausanne". International Journal on Minority and Group Rights. -1 (aop): 1–24. doi:10.1163/15718115-bja10134. ISSN   1385-4879.
  40. Sabah, Daily (26 August 2019). "Last 17 years a golden era for minority communities, witnessing period of increased rights". Daily Sabah. Retrieved 21 October 2023.
  41. "Cumhurbaşkanı Erdoğan: Nefret suçlarına göz yumanlar, farklı kültürlerin bir arada yaşama iradesini dinamitlemektedir". www.aa.com.tr. Retrieved 21 October 2023.
  42. American Heritage Dictionary (2000). "The American Heritage Dictionary of the English Language: Fourth Edition – "Turk"". Houghton Mifflin Company. Archived from the original on 16 January 2007. Retrieved 27 December 2006.
  43. Turkey. The World Factbook. CIA
  44. "Türkiyedeki Kürtlerin Sayısı!". Milliyet (in Turkish). 6 June 2008. Retrieved 7 June 2008.
  45. "TR100". interaktif.konda.com.tr. Retrieved 16 May 2022.
  46. Kurdish Life in Contemporary Turkey: Migration, Gender and Ethnic Identity, Anna Grabolle Celiker, page 160, I.B.Tauris, 2013
  47. "Turkey". Ethnologue.
  48. "Turquie: situation générale". Axl.cefan.ulaval.ca. Retrieved 8 November 2017.
  49. 1 2 Kahl, Thede (2006). "The Islamisation of the Meglen Vlachs (Megleno-Romanians): The Village of Nânti (Nótia) and the "Nântinets" in Present-Day Turkey". Nationalities Papers . 34 (1): 71–90. doi:10.1080/00905990500504871. S2CID   161615853.
  50. http://kutuphane.tuik.gov.tr/pdf/0015557.pdf
  51. 1 2 "UN Demographic Yearbooks". Unstats.un.org. Retrieved 17 June 2014.
  52. Andrews, Peter A. Ethnic groups in the Republic of Turkey., Beiheft Nr. B 60, Tübinger Atlas des Vorderen Orients, Wiesbaden: Reichert Publications, 1989, ISBN   3-89500-297-6; + 2nd enlarged edition in 2 vols., 2002, ISBN   3-89500-229-1
  53. "A Quest for Equality: Minorities in Turkey" (PDF). www.avrupa.info.tr. Archived from the original (PDF) on 3 October 2011.
  54. 1 2 İçduygu, Ahmet; Toktaş, Şule; Ali Soner, B (1 February 2008). "The politics of population in a nation-building process: emigration of non-Muslims from Turkey". Ethnic and Racial Studies. 31 (2): 358–389. doi:10.1080/01419870701491937. S2CID   143541451. Archived from the original on 25 March 2020. Retrieved 27 May 2020.
  55. Chapter The refugees question in Greece (1821–1930) in "Θέματα Νεοελληνικής Ιστορίας", ΟΕΔΒ ("Topics from Modern Greek History"). 8th edition (PDF), Nikolaos Andriotis, 2008
  56. Quarterly, Middle East (2001). "'Editors' Introduction: Why a Special Issue?: Disappearing Christians of the Middle East" (PDF). Middle East Quarterly. Editors' Introduction. Archived from the original on 11 May 2013. Retrieved 11 June 2013.
  57. 1 2 Shankland, David (2003). The Alevis in Turkey: The Emergence of a Secular Islamic Tradition. Routledge (UK). ISBN   0-7007-1606-8.
  58. "e-Devlet'te yeni hizmet: Din değişikliği yapılabilecek". A3 Haber (in Turkish). 23 May 2020. Retrieved 7 November 2020.
  59. "Ankette Mezhep Soruları". archive.vn. 2 February 2013. Archived from the original on 2 February 2013. Retrieved 7 November 2020.
  60. "Eurobarometer on Social Values, Science and technology 2005" (PDF). Eurobarometer. Archived from the original (PDF) on 24 May 2006. Retrieved 18 December 2007.
  61. Wike, Richard; Juliana Menasce Horowitz (26 July 2006). "Lebanon's Muslims: Relatively Secular and Pro-Christian". Pew Global Attitudes Project.
  62. "2009 Gallup poll Gallup Poll". Gallup.com. 9 February 2009. Retrieved 17 June 2014.
  63. Gallup World View Archived October 19, 2013, at the Wayback Machine
  64. Lamb, Christina (23 April 2007). "Head scarves to topple secular Turkey?". The Times. London.
  65. Lamb, Christina (6 May 2007). "Headscarf war threatens to split Turkey". Times Online. London.
  66. Clark-Flory, Tracy (23 April 2007). "Head scarves to topple secular Turkey?". Salon.com . Retrieved 4 August 2008.
  67. "KONDA Toplumsal Değişim Raporu: Türkiye'de inançsızlık yükselişte". euronews (in Turkish). 3 January 2019. Retrieved 7 November 2020.
  68. tr:Türkiye demografisi#N.C3.BCfus Piramidi [ circular reference ]
  69. "Religion, Ipsos Global Trends". Ipsos. 2017. Retrieved 19 August 2017.
  70. KONDA Research and Consultancy (8 September 2007). "Religion, Secularism and the Veil in daily life" (PDF). Milliyet. Archived from the original (PDF) on 25 March 2009.
  71. Religious Freedom Report U.S. Department of State. Retrieved on 2009-09-15.
  72. "KONDA Toplumsal Değişim Raporu: Türkiye'de inançsızlık yükselişte". euronews (in Turkish). 3 January 2019. Retrieved 4 August 2020.
  73. "Hayat Tarzı – 10 Yılda Ne Değişti?". interaktif.konda.com.tr. Retrieved 4 August 2020.
  74. "Hayat Tarzı – 10 Yılda Gençlerde Ne Değişti?". interaktif.konda.com.tr. Retrieved 4 August 2020.
  75. "Fener Rum Patrikhanesinin "ekümeniklik" İddiasına İlişkin Basın Açıklamamız". www.fatih.gov.tr. Retrieved 17 January 2024.

Notes

  1. 1 2 3 4 5 All data taken from Turkish Statistical Institute (TurkStat). Data is for xxxx-12-31.