Demographics of Georgia | |
---|---|
Population | 3,688,647 (1 January 2022) [1] |
Density | 65.3 (2018) |
Growth rate | 1.5‰ (2017) |
Birth rate | 14.3‰ (2017) |
Death rate | 12.8‰ (2017) |
Life expectancy | 73.5 years (2018) |
Infant mortality rate | 8.1‰ (2018) |
Net migration rate | −0.6 (2017) [n 1] [2] |
Age structure | |
0–14 years | 20% [n 1] [3] |
15–64 years | 65.4% |
65 and over | 14.6% |
Sex ratio | |
Total | 0.92 male(s)/female [n 1] [3] |
At birth | 1.07 male(s)/female |
Under 15 | 1.09 male(s)/female |
15–64 years | 0.96 male(s)/female |
65 and over | 0.6 male(s)/female |
Nationality | |
Nationality | noun: Georgian(s) adjective: Georgian |
Major ethnic | Georgians |
Minor ethnic | Ethnic minorities in Georgia |
Language | |
Official | Georgian (Abkhaz) [n 2] |
Spoken | Others |
Year | Pop. | ±% |
---|---|---|
1770 [4] | 761,000 | — |
1800 [5] | 784,700 | +3.1% |
1832 [5] | 892,100 | +13.7% |
1865 [6] | 1,289,200 | +44.5% |
1886 [6] | 1,641,900 | +27.4% |
1897 [7] | 1,919,400 | +16.9% |
1914 [8] | 2,697,500 | +40.5% |
1917 [8] | 2,357,800 | −12.6% |
1921 [9] | 2,677,000 | +13.5% |
1926 | 2,666,494 | −0.4% |
1939 | 3,540,023 | +32.8% |
1959 | 4,044,045 | +14.2% |
1970 | 4,686,358 | +15.9% |
1979 | 4,993,182 | +6.5% |
1989 | 5,400,841 | +8.2% |
2002 | 4,371,535 | −19.1% |
2002* | 3,991,300 | −8.7% |
2014 | 3,713,804 | −7.0% |
Note: Present territory of Georgia [10] * Corrected as per [11] [12] [13] |
The demographic features of the population of Georgia include population growth, population density, ethnicity, education level, health, economic status, religious affiliations, and other aspects of the population. [14]
The demographic situation in Georgia, like that of some other former Soviet republics (especially Estonia and Latvia), has been characterized by two prominent features since independence: decline in total population and significant "Georgianization" of the ethnic composition. The proportion of ethnic Georgians increased by full 10 percentage points between 1989 and 2002, rising from 73.7% to 83.7% of the population. [15] This occurred due to two migratory movements: Georgians living and working in other Soviet republics returned to their homeland, while other nationalities left Georgia. [16]
While Georgia was part of the Soviet Union the population grew steadily, rising from less than 4 million in the 1950s to a peak of 5.5 million in 1992 million (including Abkhazia and Tskhinvali Region). [17] From 1992 the population began to decline sharply due to civil war and economic crisis driven mass migration throughout the 1990s and into the early 2000s. By 2013, the population has stabilized around 3.7 million (excluding Abkhazia and Tskhinvali Region). The 2002 population census in Georgia revealed a net migration loss of more than one million persons, or 20% of the population, since the early 1990s, confirmed by other studies. [18] [19] Other factors of the population decline include net birth-death deficits in the period 1995-2010 [20] and the exclusion of Abkhazia and Tskhinvali Region from the statistics since 1994, which population was estimated in 2005 at 178,000 and 49,200, respectively. [21]
Georgia was named among the highest-emigration countries in the world (relative to its population size) in a 2007 World Bank report. [22] Russia received by far most migrants from Georgia. According to United Nations data this totalled to 625 thousand by 2000, which has declined to 450 thousand by 2019. [23] Initially the out-migration was driven by non-Georgian ethnicities, but due to the war and crisis ridden 1990s, and the subsequent bad economic outlook, increasing numbers of Georgians emigrated as well. [16] The 1989 census recorded 341,000 ethnic Russians, or 6.3 per cent of the population, [24] which declined to 26,453 (0.7%) by 2014. [25] The 2010 Russian census recorded about 158,000 ethnic Georgians living in Russia, [26]
The figure below shows the demographic trend in Georgia since 1950.
Graphs are unavailable due to technical issues. There is more info on Phabricator and on MediaWiki.org. |
Note: 1993–1994 drop is exclusion of Abkhazia and Tskhinvali Region from population statistics. [34]
Graphs are unavailable due to technical issues. There is more info on Phabricator and on MediaWiki.org. |
The 2014 census, executed in collaboration with the United Nations Population Fund (UNFPA), found a population gap of approximately 700,000 compared to the 2014 data from the National Statistical Office of Georgia, Geostat, which was cumulatively built on the 2002 census. Consecutive research estimated the 2002 census to be inflated by 8 to 9 percent, [20] which affected the annually updated population estimates in subsequent years. One explanation put forward by UNFPA is that families of emigrants continued to list them in 2002 as residents for fear of losing certain rights or benefits. Other factors that distorted the demographic data included a lack of quality in the registration system of migration, births, deaths and marriages. It was not until around 2010 that parts of the system became reliable again. With the support of the UNFPA, the demographic data of the period 1994–2014 has been retro-projected. The results of the project were presented and published in 2018. [12] [11] Based on this back-projection Geostat has corrected its data for these years, both in its annual publications starting from 2018, and its public access database. [13]
Sources: United Nations, [35] Demoscope [36] , GeoStat [37]
Total population from 1994: excluding Abkhazia and Tskhinvali Region. Corrected as per retro-projection [11] [12] and as published in public access database. [13]
Population per 1 Jan. | Live births1 | Deaths1 | Natural change1 | Crude birth rate (per 1000) | Crude death rate (per 1000) | Natural change (per 1000) | Crude migration change (per 1000) | Fertility rates | |
---|---|---|---|---|---|---|---|---|---|
1950 | 3,528,000 | 82,900 | 27,000 | 55,900 | 23.5 | 7.7 | 15.9 | ||
1951 | 3,585,000 | 86,800 | 26,900 | 59,900 | 24.2 | 7.5 | 16.7 | -0.5 | |
1952 | 3,646,000 | 85,700 | 26,600 | 59,100 | 23.5 | 7.3 | 16.2 | 0.8 | |
1953 | 3,710,000 | 87,200 | 26,300 | 60,900 | 23.5 | 7.1 | 16.4 | 1.2 | |
1954 | 3,775,000 | 91,400 | 26,000 | 65,400 | 24.2 | 6.9 | 17.3 | 0.2 | |
1955 | 3,839,000 | 92,500 | 25,700 | 66,800 | 24.1 | 6.7 | 17.4 | -0.4 | |
1956 | 3,904,000 | 89,800 | 26,500 | 63,300 | 23.0 | 6.8 | 16.2 | 0.7 | |
1957 | 3,967,000 | 89,700 | 27,000 | 62,700 | 22.6 | 6.8 | 15.8 | 0.3 | |
1958 | 4,031,000 | 93,100 | 27,400 | 65,700 | 23.1 | 6.8 | 16.3 | -0.2 | |
1959 | 4,044,000 | 98,300 | 27,400 | 70,900 | 24.0 | 6.7 | 17.3 | -14.3 | |
1960 | 4,129,000 | 102,866 | 27,015 | 51,866 | 24.7 | 6.5 | 18.2 | 2.8 | 2.65 |
1961 | 4,190,000 | 104,429 | 27,621 | 53,429 | 24.7 | 6.5 | 18.2 | -3.4 | 2.65 |
1962 | 4,258,000 | 101,717 | 30,394 | 51,717 | 23.7 | 7.1 | 16.6 | -0.4 | 2.63 |
1963 | 4,325,000 | 100,326 | 29,620 | 51,326 | 23.0 | 6.8 | 16.2 | -0.5 | 2.62 |
1964 | 4,389,000 | 97,433 | 29,708 | 48,433 | 22.0 | 6.7 | 15.3 | -0.5 | 2.62 |
1965 | 4,450,000 | 94,987 | 31,291 | 46,987 | 21.2 | 7.0 | 14.2 | -0.3 | 2.60 |
1966 | 4,505,000 | 92,026 | 30,389 | 44,026 | 20.3 | 6.7 | 13.6 | -1.2 | 2.57 |
1967 | 4,556,000 | 89,302 | 32,904 | 42,302 | 19.5 | 7.2 | 12.3 | -1.0 | 2.53 |
1968 | 4,598,000 | 89,660 | 32,416 | 43,660 | 19.4 | 7.0 | 12.4 | -3.2 | 2.52 |
1969 | 4,640,000 | 87,069 | 35,169 | 41,069 | 18.7 | 7.5 | 11.2 | -2.1 | 2.45 |
1970 | 4,674,000 | 90,207 | 34,283 | 45,207 | 19.2 | 7.3 | 11.9 | -4.6 | 2.62 |
1971 | 4,729,000 | 90,396 | 35,325 | 45,396 | 19.0 | 7.4 | 11.6 | 0.2 | 2.61 |
1972 | 4,778,000 | 86,402 | 36,409 | 41,402 | 18.0 | 7.6 | 10.4 | 0 | 2.53 |
1973 | 4,818,000 | 88,577 | 35,911 | 44,577 | 18.3 | 7.4 | 10.9 | -2.5 | 2.58 |
1974 | 4,856,000 | 89,761 | 37,145 | 45,761 | 18.4 | 7.6 | 10.8 | -2.9 | 2.59 |
1975 | 4,895,000 | 89,712 | 39,292 | 45,712 | 18.3 | 8.0 | 10.3 | -2.3 | 2.52 |
1976 | 4,920,000 | 90,605 | 38,875 | 46,605 | 18.3 | 7.9 | 10.4 | -5.3 | 2.52 |
1977 | 4,960,000 | 89,028 | 40,139 | 45,028 | 17.9 | 8.1 | 9.8 | -1.7 | 2.33 |
1978 | 4,986,000 | 88,766 | 40,239 | 45,766 | 17.8 | 8.1 | 9.8 | -4.6 | 2.31 |
1979 | 4,993,000 | 89,803 | 41,907 | 47,896 | 17.8 | 8.4 | 9.5 | -8.1 | 2.34 |
1980 | 5,029,000 | 89,458 | 43,346 | 46,112 | 17.6 | 8.6 | 9.1 | -1.9 | 2.26 |
1981 | 5,071,000 | 92,501 | 43,961 | 48,540 | 18.1 | 8.6 | 9.5 | -1.1 | 2.29 |
1982 | 5,100,000 | 91,784 | 42,734 | 49,050 | 17.9 | 8.4 | 9.6 | -3.9 | 2.25 |
1983 | 5,134,000 | 92,660 | 43,301 | 49,359 | 18.0 | 8.4 | 9.6 | -2.9 | 2.20 |
1984 | 5,167,000 | 95,841 | 45,787 | 50,054 | 18.5 | 8.8 | 9.7 | -3.3 | 2.24 |
1985 | 5,230,000 | 97,739 | 46,153 | 51,586 | 18.7 | 8.8 | 9.9 | 2.3 | 2.27 |
1986 | 5,234,000 | 98,155 | 46,354 | 51,801 | 18.7 | 8.8 | 9.9 | -9.1 | 2.26 |
1987 | 5,266,000 | 94,595 | 46,332 | 48,263 | 17.8 | 8.7 | 9.1 | -3.0 | 2.19 |
1988 | 5,397,000 | 91,905 | 47,544 | 44,361 | 17.1 | 8.9 | 8.3 | 16.6 | 2.13 |
1989 | 5,401,000 | 91,138 | 47,077 | 44,061 | 16.8 | 8.7 | 8.1 | -7.4 | 2.15 |
1990 | 5,424,000 | 92,815 | 50,721 | 43,895 | 17.1 | 9.3 | 8.1 | -3.8 | 2.29 |
1991 | 5,453,000 | 89,091 | 52,416 | 36,675 | 16.3 | 9.6 | 6.7 | -1.4 | 2.07 |
1992 | 5,467,000 | 72,631 | 55,076 | 17,555 | 13.4 | 10.2 | 3.2 | -0.6 | 1.72 |
1993 | 5,346,000 | 55,594 | 56,270 | −676 | 11.5 | 11.6 | −0.1 | -22.0 |
1Births and deaths until 1959 are estimates.
Population per 1 Jan. | Live births | Deaths | Natural change | Crude birth rate (per 1000) | Crude death rate (per 1000) | Natural change (per 1000) | Crude migration rate (per 1000) | Fertility rates | |
---|---|---|---|---|---|---|---|---|---|
1994 | 4,922,900 | 57,311 | 50,326 | 6,985 | 11.8 | 10.4 | 1.4 | -80.5 | 1.53 |
1995 | 4,742,300 | 56,486 | 49,219 | 7,267 | 11.9 | 10.1 | 1.8 | -38.5 | 1.57 |
1996 | 4,573,200 | 55,153 | 48,251 | 6,902 | 11.6 | 10.2 | 1.4 | -37.1 | 1.60 |
1997 | 4,410,200 | 54,136 | 48,026 | 6,110 | 11.4 | 10.5 | 1.1 | -36.7 | 1.63 |
1998 | 4,289,600 | 51,491 | 47,907 | 3,584 | 11.0 | 10.5 | 0.5 | -27.8 | 1.60 |
1999 | 4,197,600 | 48,408 | 47,909 | 499 | 10.7 | 10.6 | 0.1 | -21.5 | 1.55 |
2000 | 4,116,800 | 48,167 | 48,250 | −83 | 10.7 | 10.7 | −0.0 | -19.2 | 1.59 |
2001 | 4,037,500 | 46,620 | 47,133 | −513 | 10.5 | 10.6 | −0.1 | -19.2 | 1.57 |
2002 | 3,991,300 | 45,127 | 47,514 | −2,387 | 10.2 | 10.8 | −0.6 | -10.8 | 1.53 |
2003 | 3,965,800 | 45,450 | 47,114 | −1,664 | 10.3 | 10.7 | −0.4 | -6.0 | 1.56 |
2004 | 3,937,700 | 45,751 | 49,746 | −3,995 | 10.3 | 11.2 | −0.9 | -6.2 | 1.58 |
2005 | 3,917,000 | 46,063 | 49,534 | −3,471 | 10.4 | 11.1 | −0.7 | -4.6 | 1.59 |
2006 | 3,888,000 | 46,845 | 50,014 | −3,169 | 10.6 | 11.2 | −0.6 | -6.8 | 1.62 |
2007 | 3,872,700 | 48,499 | 50,204 | −1,705 | 11.1 | 11.4 | −0.3 | -3.6 | 1.69 |
2008 | 3,847,600 | 52,442 | 50,490 | 1,952 | 13.6 | 13.1 | 0.5 | -7.0 | 1.84 |
2009 | 3,829,000 | 56,568 | 50,794 | 5,774 | 14.8 | 13.3 | 1.5 | -6.3 | 2.01 |
2010 | 3,799,800 | 55,230 | 51,066 | 4,164 | 14.6 | 13.5 | 1.1 | -8.7 | 2.00 |
2011 | 3,773,600 | 51,565 | 49,818 | 1,747 | 13.7 | 13.3 | 0.4 | -7.3 | 1.89 |
2012 | 3,739,300 | 49,969 | 49,347 | 622 | 13.4 | 13.2 | 0.2 | -9.3 | 1.85 |
2013 | 3,718,400 | 49,657 | 48,564 | 1,093 | 13.4 | 13.1 | 0.3 | -5.9 | 1.86 |
2014 | 3,716,900 | 60,635 | 49,087 | 11,548 | 16.3 | 13.2 | 3.1 | -3.5 | 2.31 |
2015 | 3,721,900 | 59,249 | 49,121 | 10,128 | 15.9 | 13.2 | 2.7 | -1.4 | 2.31 |
2016 | 3,728,600 | 56,569 | 50,771 | 5,798 | 15.2 | 13.7 | 1.5 | 0.3 | 2.24 |
2017 | 3,721,900 | 53,293 | 47,822 | 5,471 | 14.3 | 12.9 | 1.4 | -3.2 | 2.14 |
2018 | 3,729,600 | 51,138 | 46,524 | 4,614 | 13.7 | 12.5 | 1.2 | 0.9 | 2.12 |
2019 | 3,723,500 | 48,296 | 46,659 | 1,637 | 13.0 | 12.5 | 0.4 | -2.0 | 2.01 |
2020 | 3,716,900 | 46,520 | 50,537 | −4,017 | 12.5 | 13.6 | −1.1 | -0.7 | 1.97 |
2021 | 3,728,600 | 45,946 | 59,906 | −13,960 | 12.3 | 16.1 | −3.8 | 6.9 | 1.98 |
2022 | 3,688,647 | 42,319 | 49,118 | -6,799 | 11.5 | 13.3 | -1.8 | -8.9 | 1.82 |
2023 | 3,736,400 | 40,214 | 42,756 | -2,542 | 10.8 | 11.4 | -0.6 | 13.5 | 1.70 |
Source: Geostat public database, [13] Geostat website, section Population and Demography. [38] [39]
Source: [38]
Period | Live births | Deaths | Natural increase |
---|---|---|---|
January – June 2022 | 20,195 | 26,681 | -6,486 |
January – June 2023 | 19,431 | 21,944 | -2,513 |
Difference | -764 (-3.78%) | -4,737 (-17.75%) | +3,973 |
Period | Life expectancy in Years [40] |
---|---|
1950–1955 | 60.65 |
1955–1960 | 62.65 |
1960–1965 | 64.65 |
1965–1970 | 66.65 |
1970–1975 | 68.15 |
1975–1980 | 69.64 |
1980–1985 | 69.63 |
1985–1990 | 70.45 |
1990–1995 | 70.11 |
1995–2000 | 71.09 |
2000–2005 | 72.60 |
2005–2010 | 72.65 |
2010–2015 | 72.74 |
2015–2020 | 73.52 |
2020–2025 | 74.24 |
Structure of the population (01.01.2019) : [41]
Age Group | Male | Female | Total | % |
---|---|---|---|---|
Total | 1 790 600 | 1 929 600 | 3 720 200 | 100 |
0–4 | 141 300 | 131 900 | 273 200 | 7,35 |
5–9 | 134 600 | 124 300 | 258 900 | 6,96 |
10–14 | 118 500 | 106 200 | 224 700 | 6,04 |
15–19 | 109 100 | 96 500 | 205 600 | 5,53 |
20–24 | 115 400 | 104 000 | 219 400 | 5,90 |
25–29 | 129 700 | 126 100 | 255 800 | 6,88 |
30–34 | 136 000 | 135 100 | 271 100 | 7,28 |
35–39 | 126 500 | 127 600 | 254 100 | 6,83 |
40–44 | 119 100 | 121 400 | 240 500 | 6,46 |
45–49 | 115 100 | 119 100 | 234 200 | 6,30 |
50–54 | 111 800 | 121 300 | 233 100 | 6,27 |
55–59 | 120 800 | 139 800 | 260 600 | 7,00 |
60–64 | 102 500 | 129 300 | 231 800 | 6,23 |
65–69 | 80 800 | 112 800 | 193 600 | 5,20 |
70–74 | 51 300 | 80 200 | 131 500 | 3,53 |
75–79 | 36 100 | 64 800 | 100 900 | 2,71 |
80–84 | 28 900 | 58 700 | 87 600 | 2,36 |
85+ | 13 000 | 30 600 | 43 600 | 1,17 |
Age group | Male | Female | Total | Percent |
0–14 | 394 400 | 362 400 | 756 800 | 20,35 |
15–64 | 1 186 000 | 1 220 200 | 2 406 200 | 64,68 |
65+ | 210 100 | 347 100 | 557 200 | 14,97 |
Georgians are the predominant ethnic group in Georgia, according to the 2014 census 86.83% of the population. The proportion in 2014 was much higher than in preceding censuses as in 2014 Abkhazia and Tskhinvali Region were not under government control and therefore not included. As a result of this the proportion of Ossetians and Abkhazians was very low (0.39% and 0.02%, respectively).
Ethnic group | 18001 | 18322 | 18653 | 18864 | 18975 | |||||||||||
---|---|---|---|---|---|---|---|---|---|---|---|---|---|---|---|---|
Number | % | Number | % | Number | % | Number | % | Number | % | |||||||
Georgians | 622,600 | 79.4 | 677,100 | 75.9 | 950,600 | 73.8 | 1,188,100 | 72.4 | 1,331,300 | 69.4 | ||||||
Armenians | 47,000 | 6.0 | 84,000 | 9.4 | 122,600 | 9.5 | 172,900 | 10.5 | 197,000 | 10.3 | ||||||
Russians | – | – | – | – | 25,900 | 2.0 | 42,500 | 2.6 | 101,000 | 5.3 | ||||||
Ossetians | 29,300 | 3.7 | 32,300 | 3.6 | 45,500 | 3.6 | 71,000 | 4.3 | 81,500 | 4.2 | ||||||
Transcaucasian Tatars | 30,000 | 3.8 | 27,000 | 3.0 | 51,500 | 4.0 | 62,600 | 3.8 | 81,100 | 4.2 | ||||||
Abkhazians | 52,000 | 6.6 | 56,600 | 6.3 | 60,000 | 4.6 | 38,000 | 2.3 | 42,600 | 2.2 | ||||||
Greeks | 500 | 0.1 | 7,000 | 0.8 | 12,000 | 0.9 | 28,800 | 1.8 | 38,500 | 2.0 | ||||||
Jews | 3,300 | 0.4 | 4,000 | 0.5 | 7,800 | 0.6 | 11,700 | 0.7 | 17,200 | 0.9 | ||||||
Germans | – | – | – | – | 4,200 | 0.3 | 5,500 | 0.3 | 7,400 | 0.4 | ||||||
Others | – | – | 4,100 | 0.5 | 9,100 | 0.7 | 20,800 | 1.3 | 21,800 | 1.1 | ||||||
Total | 784,700 | 892,100 | 1,289,200 | 1,641,900 | 1,919,400 | |||||||||||
1 Source: [42] 2 Source: [42] 3 Source: [43] 4 Source: [43] 5 Source: [43] |
Ethnic group | census 19261 | census 19392 | census 19593 | census 19704 | census 19795 | census 19896 | census 20026 | census 20147 | ||||||||
---|---|---|---|---|---|---|---|---|---|---|---|---|---|---|---|---|
Number | % | Number | % | Number | % | Number | % | Number | % | Number | % | Number | % | Number | % | |
Georgians | 1,788,186 | 66.8 | 2,173,922 | 61.4 | 2,600,588 | 64.3 | 3,130,741 | 66.8 | 3,433,011 | 68.8 | 3,787,393 | 70.1 | 3,661,173 | 83.8 | 3,224,564 | 86.8 |
Azerbaijanis | 137,921 [44] | 5.2 | 188,058 [45] | 5.3 | 153,600 | 3.8 | 217,758 | 4.6 | 255,678 | 5.1 | 307,556 | 5.7 | 284,761 | 6.5 | 233,024 | 6.3 |
Armenians | 307,018 | 11.5 | 415,013 | 11.7 | 442,916 | 11.0 | 452,309 | 9.7 | 448,000 | 9.0 | 437,211 | 8.1 | 248,929 | 5.7 | 168,102 | 4.5 |
Russians | 96,085 | 3.6 | 308,684 | 8.7 | 407,886 | 10.1 | 396,694 | 8.5 | 371,608 | 7.4 | 341,172 | 6.3 | 67,671 | 1.5 | 26,453 | 0.7 |
Ossetians | 113,298 | 4.2 | 147,677 | 4.2 | 141,178 | 3.5 | 150,185 | 3.2 | 160,497 | 3.2 | 164,055 | 3.0 | 38,028 | 0.9 | 14,385 | 0.4 |
Yazidis | 2,262 | 0.1 | 12,915 | 0.4 | 16,212 | 0.4 | 20,690 | 0.4 | 25,688 | 0.5 | 33,331 | 0.6 | 18,329 | 0.4 | 12,174 | 0.3 |
Kurds | 7,955 | 0.3 | 2,514 | 0.1 | 1,596 | 0.0 | ||||||||||
Ukrainians | 14,356 | 0.5 | 45,595 | 1.3 | 52,236 | 1.3 | 49,622 | 1.1 | 45,036 | 0.9 | 52,443 | 1.0 | 7,039 | 0.2 | 6,034 | 0.2 |
Greeks | 54,051 | 2.0 | 84,636 | 2.4 | 72,938 | 1.8 | 89,246 | 1.9 | 95,105 | 1.9 | 100,324 | 1.9 | 15,166 | 0.3 | 5,544 | 0.2 |
Assyrians | 2,904 | 0.1 | 4,707 | 0.1 | 5,005 | 0.1 | 5,617 | 0.1 | 5,286 | 0.1 | 6,206 | 0.1 | 3,299 | 0.1 | 2,377 | 0.1 |
Jews | 30,389 | 1.1 | 42,300 | 1.2 | 51,582 | 1.3 | 55,382 | 1.2 | 28,298 | 0.6 | 24,795 | 0.5 | 2,333 | 0.0 | 1,405 | 0.0 |
Abkhazians | 56,847 | 2.1 | 57,805 | 1.6 | 62,878 | 1.5 | 79,449 | 1.7 | 85,285 | 1.7 | 95,853 | 1.8 | 3,527 | 0.1 | 864 | 0.0 |
Others | 65,961 | 2.5 | 58,711 | 1.7 | 37,026 | 0.9 | 38,665 | 0.8 | 39,690 | 0.8 | 50,502 | 0.9 | 18,766 | 0.4 | 17,282 | 0.5 |
Total | 2,677,233 | 3,540,023 | 4,044,045 | 4,686,358 | 4,993,182 | 5,400,841 | 4,371,535 | 3,713,804 | ||||||||
1 Source: . 2 Source: . 3 Source: . 4 Source: . 5 Source: . 6 Source: . 7 Source: . |
The most widespread language group is the Kartvelian family, which includes Georgian, Svan, Mingrelian and Laz. [46] [47] [48] [49] [50] [51] The official languages of Georgia are Georgian, with Abkhaz having official status within the autonomous region of Abkhazia. Georgian is the primary language of 87.7 percent of the population, followed by 6.2 percent speaking Azerbaijani, 3.9 percent Armenian, 1.2 percent Russian, and 1 percent other languages. [52]
Language | 2002 census [53] | 2014 census [54] | ||
---|---|---|---|---|
Number | % | Number | % | |
Georgian | 3,677,995 | 84.14 | 3,254,852 | 87.64 |
Azerbaijani | 283,632 | 6.49 | 231,436 | 6.23 |
Armenian | 235,653 | 5.39 | 144,812 | 3.90 |
Russian | 83,007 | 1.90 | 45,920 | 1.24 |
Ossetian | 31,381 | 0.72 | 5,698 | 0.15 |
Other | 59,867 | 1.36 | 31,014 | 0.84 |
Not stated | – | – | 72 | 0.00 |
Total | 4,371,535 | 3,713,804 |
Religion | 2002 [55] | 2014 [56] | ||
---|---|---|---|---|
Number | % | Number | % | |
Christianity | 3,872,099 | 88.58 | 3,240,724 | 87.27 |
–Georgian Orthodox Church | 3,679,233 | 83.87 | 3,097,573 | 83.41 |
–Armenian Apostolic Church | 171,139 | 3.92 | 109,041 | 2.94 |
–Catholic Church | 34,727 | 0.79 | 19,195 | 0.52 |
–Jehovah's Witnesses | – | – | 12,395 | 0.33 |
–Protestantism | – | – | 2,520 | 0.07 |
Islam | 433,784 | 9.92 | 398,677 | 10.73 |
Yazidism | – | – | 8,591 | 0.23 |
Judaism | 3,541 | 0.08 | 1,417 | 0.04 |
Other religions | 62,111 | 1.42 | 1,429 | 0.04 |
No religion | – | – | 19,080 | 0.51 |
Refusal | – | – | 9,635 | 0.26 |
Religion not stated | – | – | 34,251 | 0.92 |
Total population | 4,371,535 | 100.0 | 3,713,804 | 100.0 |
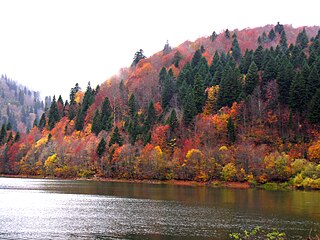
Adjara or Achara, officially known as the Autonomous Republic of Adjara, is a political-administrative region of Georgia. It is in the country's southwestern corner, on the coast of the Black Sea, near the foot of the Lesser Caucasus Mountains, north of Turkey. It is an important tourist destination and includes Georgia's second most populous city of Batumi as its capital. About 350,000 people live on its 2,880 km2 (1,110 sq mi).
Georgia is a transcontinental country in Eastern Europe and West Asia. It is part of the Caucasus region, bounded by the Black Sea to the west, Russia to the north and northeast, Turkey to the southwest, Armenia to the south, and Azerbaijan to the southeast. Georgia covers an area of 69,700 square kilometres (26,900 sq mi). It has a population of 3.7 million, of which over a third live in the capital and largest city, Tbilisi. Georgians, who are indigenous to the region, constitute a majority and a titular nation in Georgia.
South Ossetia, officially the Republic of South Ossetia or the State of Alania, is a partially recognised landlocked state in the South Caucasus. It has an officially stated population of just over 56,500 people (2022), who live in an area of 3,900 square kilometres (1,500 sq mi), with 33,000 living in the capital city, Tskhinvali.
The South Caucasus, also known as Transcaucasia or the Transcaucasus, is a geographical region on the border of Eastern Europe and West Asia, straddling the southern Caucasus Mountains. The South Caucasus roughly corresponds to modern Armenia, Georgia, and Azerbaijan, which are sometimes collectively known as the Caucasian States. The total area of these countries measures about 186,100 square kilometres. The South Caucasus and the North Caucasus together comprise the larger Caucasus geographical region that divides Eurasia.
Rustavi is a city in the southeast of Georgia, in the region of Kvemo Kartli and 20 km (12 mi) southeast of capital Tbilisi. It has a population of 132,333, making it the fourth most populous city in Georgia. Its economy is dominated by the Rustavi Metallurgical Plant.
Samtskhe–Javakheti is a region (mkhare) in southern Georgia with a population of 147.400 (2023) and an area of 6,413 km2 (2,476 sq mi). The region has Akhaltsikhe as its administrative center. Samtskhe–Javakheti is made up of the historical Georgian provinces Meskheti, Javakheti and Tori.
Vakhtang I Gorgasali, of the Chosroid dynasty, was a king (mepe) of Iberia, natively known as Kartli in the second half of the 5th and first quarter of the 6th century.
Samegrelo-Zemo Svaneti is a region (Mkhare) in western Georgia with a population of 308,358 (2021) and a surface of 7,468 km2 (2,883 sq mi). The region has Zugdidi as its administrative center, while Giorgi Guguchia is governor of the region since June 2021. Samegrelo-Zemo Svaneti is compiled of the historical Georgian provinces of Samegrelo (Mingrelia) and Zemo Svaneti.
Adigeni is a municipality in Georgia's southern region of Samtskhe-Javakheti. Covering an area of about 799.5 km2 (309 sq mi). As of 2021 it had a population of 16,092 people. The borough (daba) Adigeni is its administrative centre.
Gardabani is a city of 11,650 residents (2021) in the southern Georgian region of Kvemo Kartli and is the administrative centre of the Gardabani Municipality. It is located 34 kilometres (21 mi) southeast of capital Tbilisi and 10 kilometres (6.2 mi) from Rustavi in the Kvemo Kartli Plain at an elevation of 300 metres (980 ft) above sea level. Until 1947 Gardabani was known as Karayazi and the city status was granted in 1969, after a thermal power plant was built for Tbilisi in the 1960s causing rapid growth. Since then more plower plants have been built and the city nowadays supplies almost all thermally generated electricity in the country.
The demographics of Abkhazia include population density, ethnicity, education level, health, socioeconomic status, religious affiliations and other aspects of the population.
Ganarjiis Mukhuri is a village in the Samegrelo-Zemo Svaneti region of western Georgia, in the Zugdidi municipality. It is situated at the border with Abkhazia and the city of Zugdidi. The village area is located by the Black Sea and on the right bank of the Enguri River, with the village center six kilometers from the sea. Within the administrative division of the municipality, Ganmukhuri is not part of a community, but is an so called independent village.
The Ambrolauri Municipality is a self-governing subdivision in western Georgia. Its governing bodies are based in the city of Ambrolauri. Together with the neighboring municipalities Lentekhi, Oni, and Tsageri, the Ambrolauri Municipality forms the region of Racha-Lechkhumi and Kvemo Svaneti. The municipality has an area of is 1142 km2, and population of 10,405 (2021).
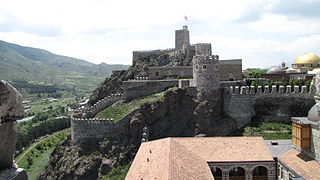
Akhaltsikhe ) is a municipality in Georgia's southern region of Samtskhe-Javakheti. Covering an area of 1,010.4 km2 (390 sq mi). As of 2021 it had a population of 39,463 people. The city of Akhaltsikhe is its administrative centre.
Tetritskaro is a district of Georgia, in the region of Kvemo Kartli. Its main town is Tetritskaro. Tetritskaro municipality is located in the eastern part of Georgia and is a self-governing unit in the Kvemo Kartli region. The municipality is bordered on the east by Gardabani and Marneuli, on the west by Tsalka and Dmanisi, on the north by Kaspi and Mtskheta, and the south by Bolnisi. The area of the municipality is 1,175.5 km2 (453.9 sq mi), the minimum altitude is 650 metres (2,130 ft) above sea level, and the maximum altitude where the settlement is located is 1,140 metres (3,740 ft). The administrative center of the municipality - Tetritskaro - is 57 km (35 mi) away from Tbilisi, 60 km (37 mi) from the center of the region - Rustavi - and seven kilometres (4.3 mi) from the main railway (Tbilisi-Marabda-Akhalkalaki).
Ochkhamuri is a small town (daba) on the Ochkhamuri river in Adjara, Georgia, with the population of 5,355 as of the Georgian census of 2014.
The Kurds in Georgia form a major part of the historically significant Kurdish population in the post-Soviet space, and are members of the eponymous ethnic group that are citizens of Georgia. In the 20th century, most Kurds fled religious persecution in the Ottoman Empire to the Russian Empire. The return of their Kurdish surnames needs effort according to a Kurdish activist in Georgia. The Kurds also have their own schools, school books and a printing press in Georgia. Illiteracy among them disappeared in the early 1900s. Kurds in Georgia are politically neutral; however, in 1999 they staged a huge demonstration in Tbilisi, demanding the release of the founder of the Kurdistan Workers' Party, Abdullah Öcalan. Kurds in Georgia today use Cyrillic script. Earlier, in the 1920s, they used the Latin script.
Alexander "Sasha" Berulava was a Georgian journalist, writer, and human rights activist, founder of the Georgian Television of Abkhazia, who was murdered by Abkhaz separatists during the ethnic cleansing of Georgians in Abkhazia in 1993 together with other members of the Government of Abkhazia.
Trialeti is a daba in Tsalka Municipality in the Kvemo Kartli region of Georgia. It is located on the Chochiani Plateau, above the right bank of the Khrami river, 1,500 m (4,900 ft) above sea level and 7 km (4.3 mi) from the municipal center Tsalka. The Tetritskaro-Tsalka regional road passes through Trialeti.