List of Indian states and union territories by GDP per capita

Last updated

NSDP per capita of Indian states and union territories, 2018-19 NSDP Per Capita of Indian States and UT's, 2018-19.png
NSDP per capita of Indian states and union territories, 2018–19

This is a list of Indian states and union territories by NSDP per capita. Net state domestic product (NSDP) is the state counterpart to a country's Net domestic product (NDP), which equals the gross domestic product (GDP) minus depreciation on capital goods. [1] [2]

Contents

List

The following table gives the latest available nominal NSDP per capita figures for the States and union territories of India at current prices in Indian rupees.

Indian states and union territories by NSDP per capita [3]
Rank [lower-alpha 1] State/Union territoryNSDP per capita at current prices (Rupees ₹)Change
202122202223
1 Goa 475,401532,854Increase2.svg12.1%
2 Sikkim 463,509519,964Increase2.svg12.2%
3 Delhi 376,217430,120Increase2.svg14.3%
4 Chandigarh 337,538393,649Increase2.svg16.6%
5 Telangana 269,161311,649Increase2.svg15.8%
6 Karnataka 266,866304,474Increase2.svg14.1%
7 Haryana 264,729296,592Increase2.svg12%
8 Puducherry 249,764274,902Increase2.svg10.1%
9 Tamil Nadu 242,253275,583Increase2.svg13.8%
10 Gujarat 241,930273,558Increase2.svg13.1%
11 Kerala 234,435263,945Increase2.svg12.6%
12 Andaman and Nicobar Islands 229,080NANA
13 Maharashtra 215,233NANA
14 Uttarakhand 205,246230,994Increase2.svg12.5%
15 Arunachal Pradesh 204,023228,650Increase2.svg12.1%
16 Mizoram 198,962NANA
17 Andhra Pradesh 197,214219,881Increase2.svg11.5%
18 Himachal Pradesh 195,795218,788Increase2.svg11.7%
19 Punjab 169,636182,515Increase2.svg7.6%
20 Tripura 137,472159,419Increase2.svg16%
21 Rajasthan 133,960151,559Increase2.svg13.1%
22 Odisha 126,437145,202Increase2.svg14.8%
23 Chhattisgarh 122,934137,329Increase2.svg11.7%
24 West Bengal 121,904139,442Increase2.svg14.4%
25 Nagaland 121,664138,633Increase2.svg13.9%
26 Madhya Pradesh 116,689132,010Increase2.svg13.1%
27 Jammu and Kashmir [lower-alpha 2] 116,530133,743Increase2.svg14.8%
28 Assam 103,964120,336Increase2.svg15.7%
29 Meghalaya 103,335112,737Increase2.svg9.1%
30 Manipur 91,556NANA
31 Jharkhand 84,00691,887Increase2.svg9.3%
32 Uttar Pradesh 73,88483,664Increase2.svg13.3%
33 Bihar 47,45054,111Increase2.svg13.9%

Historical Data

Indian states and union territories by NSDP per capita [4]
Rank [lower-alpha 1] State/Union territoryNSDP per capita at current prices (Rupees ₹)
200405200910201011201112201213201314201415201516201617201718201819201920202021
1 Goa 76,968149,164168,024259,444234,354215,776289,185334,576378,953411,740423,716435,949423,047
2 Sikkim 26,69090,749108,972158,667174,183194,624214,148245,987280,729349,163375,773412,627415,045
3 Delhi 63,877125,936145,129185,001205,568227,900247,209270,261295,558318,323338,730355,798322,311
4 Chandigarh 74,173117,371126,651158,967180,457203,356212,594230,009252,236280,512307,812330,703290,454
5 Telangana 24,40951,95566,95191,121101,007112,162124,104140,840159,395179,358209,848231,326225,734
6 Karnataka 26,88251,36462,25190,263102,319118,829130,024148,108169,898185,840205,245222,141221,781
7 Haryana 37,97282,03793,852106,085121,269137,770147,382164,963184,982208,437223,022232,530224,587
8 Puducherry 48,30296,860101,072119,649130,548148,147146,921172,727187,356198,357204,140217,937208,862
9 Tamil Nadu 30,06264,33878,47393,112105,340116,960129,494142,028156,595175,276194,373206,165209,628
10 Gujarat 32,02164,09777,48587,481102,826113,139127,017139,254156,295176,961197,457212,428207,324
11 Kerala 32,35162,11469,94397,912110,314123,388135,537148,133166,246183,252205,437208,879194,432
12 Andaman & Nicobar Islands 40,92178,93680,55889,10098,777111,087126,344137,064153,904178,709204,254219,653205,368
13 Maharashtra 36,07769,76584,85899,597112,092125,261132,836146,815163,726172,663182,865189,889183,704
14 Uttarakhand 24,72662,75773,819100,314113,654126,356136,099147,936161,752180,858186,207190,558174,526
15 Arunachal Pradesh 26,72151,06860,96173,54082,62694,135114,789116,985124,129138,836155,103182,171181,537
16 Mizoram 24,66242,71550,95657,65465,01377,584103,049114,055127,107155,222164,708195,365173,521
17 Andhra Pradesh 25,95950,51558,73369,00074,68782,87093,903108,002120,676138,299154,031160,341168,063
18 Himachal Pradesh 33,34858,40268,29787,72199,730114,095123,299135,512150,290165,497174,804186,559173,152
19 Punjab 33,10361,80569,58285,57794,318103,831108,970118,858128,780139,835149,974154,385150,620
20 Tripura 24,39439,81546,05047,15552,57461,81569,85784,26791,596100,444113,016121,456118,401
21 Rajasthan 18,56535,25444,64457,19263,65869,48076,42983,42691,92498,698106,604115,534114,850
22 Odisha 17,65033,02939,53748,38754,76260,68763,34564,83577,50787,05598,005104,633103,203
23 Chhattisgarh 18,55934,36641,16555,17760,84969,88072,93672,99183,28588,793102,024106,611106,117
24 West Bengal 22,64941,03947,24551,54358,19565,93268,87675,99282,29191,401103,920110,316105,109
25 Nagaland 30,44150,26355,58253,01061,22571,51078,36782,46691,347102,003109,198122,759119,781
26 Madhya Pradesh 15,44228,65132,45338,49744,77351,84955,67862,08074,32481,96692,337101,909102,007
27 Jammu and Kashmir [lower-alpha 2] 21,73433,65040,08951,77557,27961,90762,32774,95078,96087,71098,738101,868101,645
28 Assam 16,78228,38333,08741,14244,59949,73452,89560,81766,33075,15181,03490,12386,947
29 Meghalaya 23,07938,81943,76659,79464,47766,28166,48571,59477,58582,45788,95495,42290,751
30 Manipur 18,54726,62128,33639,76241,23047,79852,71755,44759,34571,50773,79578,57475,784
31 Jharkhand 18,51028,22334,72141,25447,36050,00657,30152,75460,01867,48475,42175,01669,963
32 Uttar Pradesh 12,95023,67126,69832,00235,81240,12442,26747,11852,67157,94462,35065,66061,809
33 Bihar 79,91415,45719,11121,75024,48726,94828,67130,40434,04536,85040,71544,17542,083

Notes

  1. 1 2 Ranking is based on 2021-22 data
  2. 1 2 includes Ladakh

Related Research Articles

<span class="mw-page-title-main">Gross domestic product</span> Market value of goods and services produced within a country

Gross Domestic Product (GDP) is a monetary measure of the market value of all the final goods and services produced and rendered in a specific time period by a country or countries. GDP is often used to measure the economic health of a country or region. Definitions of GDP are maintained by several national and international economic organizations, such as the OECD and the International Monetary Fund.

A variety of measures of national income and output are used in economics to estimate total economic activity in a country or region, including gross domestic product (GDP), gross national product (GNP), net national income (NNI), and adjusted national income. All are specially concerned with counting the total amount of goods and services produced within the economy and by various sectors. The boundary is usually defined by geography or citizenship, and it is also defined as the total income of the nation and also restrict the goods and services that are counted. For instance, some measures count only goods & services that are exchanged for money, excluding bartered goods, while other measures may attempt to include bartered goods by imputing monetary values to them.

<span class="mw-page-title-main">Gross national income</span> Total domestic and foreign economic output claimed by residents of a country

The gross national income (GNI), previously known as gross national product (GNP), is the total domestic and foreign output claimed by residents of a country, consisting of gross domestic product (GDP), plus factor incomes earned by foreign residents, minus income earned in the domestic economy by nonresidents.

<span class="mw-page-title-main">Economy of Karnataka</span>

Karnataka is one of the highest economic growth states in India with an expected GSDP growth of 9.5% in the 2021–22 fiscal year. The total expected GSDP of Karnataka in 2022–2023 is about $240 billion. Karnataka recorded the highest growth rates in terms of GDP and per capita GDP in the last decade compared to other states. In 2008–09, the tertiary sector contributed the most to GSDP, followed by the secondary sector, and the primary sector.

<span class="mw-page-title-main">Economy of West Bengal</span>

The economy of West Bengal is a mixed middle-income developing social market economy and the largest Eastern Indian economy with a substantial public sector. It is the India's sixth-largest economy by nominal GDP.

Income in India discusses the financial state in India. With rising economic growth and prosperity, India's income is also rising rapidly. As an overview, India's per capita net national income or NNI was around Rs. 98,374 in 2022-23. The per-capita income is a crude indicator of the prosperity of a country. In contrast, the gross national income at constant prices stood at over 128 trillion rupees. The same year, GRI growth rate at constant prices was around 6.6 percent. While GNI and NNI are both indicators for a country's economic performance and welfare, the GNI is related to the GDP or the Gross Domestic Product plus the net receipts from abroad, including wages and salaries, property income, net taxes and subsidies receivable from abroad. On the other hand, the NNI of a country is equal to its GNI net of depreciation.

<span class="mw-page-title-main">Economy of Assam</span>

The Economy of Assam is largely agriculture based with 69% of the population engaged in it.

Gross regional domestic product (GRDP), gross domestic product of region (GDPR), or gross state product (GSP) is a statistic that measures the size of a region's economy. It is the aggregate of gross value added (GVA) of all resident producer units in the region, and analogous to national gross domestic product. The GRDP includes regional estimates on the three major sectors including their sub-sectors, namely:

<span class="mw-page-title-main">Economy of Andhra Pradesh</span>

The economy of the Indian state of Andhra Pradesh is primarily dependent on agriculture, which directly and indirectly employs 62% of the population. GSDP as per the first revised estimate, for the year 2023-24 is ₹15,40,000 crore.The state is ranked 1st in the country for the year 2021-22 in terms of the Gross State Domestic Product (GSDP) growth at constant prices with growth rate of 11.43%. The state GSDP is expected to grow at a rate of 17% for the year 2023-24.

<span class="mw-page-title-main">Economy of Odisha</span>

The economy of Odisha is one of the fastest growing economies in India. According to 2014-15 economic survey, Odisha's gross state domestic product (GSDP) was expected to grow at 8.78%. Odisha has an agriculture-based economy which is in transition towards an industry and service-based economy.

<span class="mw-page-title-main">Economy of Uttarakhand</span>

Uttarakhand's gross state domestic product for 2024 is estimated at around $40 billion in current prices. Born out of partition of Uttar Pradesh, the new state of Uttarakhand is today around 13 percent of the GSDP of Uttar Pradesh state.
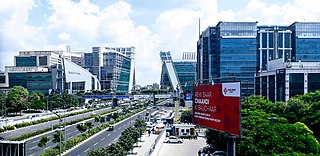
<span class="mw-page-title-main">Economy of Haryana</span>

GSDP of Haryana state is estimated to be US$140 billion in 2023-2034 which had grown at 12.96% CAGR between 2012–17, boosted by the fact that this state on DMIC in NCR contributes 7% of India's agricultural exports and 60% of India's Basmati rice export, with 7 operational SEZs and additional 23 formally approved SEZs. Haryana also produces India's 67% of passenger cars, 60% of motorcycles, 50% of tractors and 50% of the refrigerators, which places Haryana on 14th place on the list of Indian states and union territories by GDP behind only much bigger states that are significantly larger in both area and population.

NSDP may refer to:

<span class="mw-page-title-main">Union territory</span> Form of administrative division in India

A union territory is a type of administrative division in the Republic of India. Unlike the states of India, which have their own governments, union territories are federal territories governed, in part or in whole, by the Union Government of India. There are currently eight union territories in India: Andaman and Nicobar Islands, Chandigarh, Dadra and Nagar Haveli and Daman and Diu, Delhi (NCT), Jammu and Kashmir, Ladakh, Lakshadweep and Puducherry.

References

  1. Dornbusch, Rudiger; Fischer, Stanley; Startz, Richard (2004). Macroeconomics. New York: McGraw-Hill Irwin. pp. 22–23. ISBN   0-07-282340-2.
  2. "Net domestic product (NDP)". U.S. Bureau of Economic Analysis (BEA). Retrieved 23 June 2019.
  3. Per Capita Net State Domestic Product (Current Prices) (Report). Government of India . Retrieved 1 May 2024.
  4. Handbook of Statistics (Report). Reserve Bank of India . Retrieved 7 April 2020.