Data about life expectancy according to alternative survey "National Family Health Survey" (NFHS). These table allow to estimate influence of the COVID-19 pandemic to various Indian territories.
| state | 2015-2016 | change | 2019-2021 | ||||||
|---|---|---|---|---|---|---|---|---|---|
| overall | males | females | F Δ M | overall | males | females | F Δ M | ||
| India on average | 66.6 | 64.3 | 69.2 | 4.9 | −0.8 | 65.8 | 62.9 | 68.9 | 6.0 |
| Nagaland | 76.2 | 73.0 | 79.8 | 6.8 | −0.8 | 75.4 | 71.5 | 79.9 | 8.4 |
| Kerala | 73.9 | 70.1 | 77.8 | 7.7 | −2.7 | 71.2 | 67.1 | 75.5 | 8.4 |
| Chandigarh | 73.3 | 69.1 | 79.5 | 10.4 | −6.8 | 66.5 | 64.1 | 69.4 | 5.3 |
| Dadra and Nagar Haveli | 73.0 | 73.4 | 72.7 | −0.7 | — | — | — | — | — |
| Mizoram | 72.1 | 66.1 | 81.0 | 14.9 | 0.0 | 72.1 | 66.9 | 78.4 | 11.5 |
| Punjab | 71.1 | 69.0 | 73.5 | 4.5 | −4.9 | 66.2 | 63.3 | 69.4 | 6.1 |
| Himachal Pradesh | 70.8 | 67.5 | 74.3 | 6.8 | −0.2 | 70.6 | 67.9 | 73.2 | 5.3 |
| Maharashtra | 70.2 | 67.9 | 72.8 | 4.9 | −0.9 | 69.3 | 66.4 | 72.4 | 6.0 |
| Rajasthan | 70.2 | 67.3 | 73.4 | 6.1 | 1.3 | 71.5 | 68.1 | 75.4 | 7.3 |
| Manipur | 70.1 | 66.0 | 74.5 | 8.5 | −2.5 | 67.6 | 63.7 | 71.7 | 8.0 |
| Sikkim | 69.8 | 69.4 | 70.7 | 1.3 | −3.9 | 65.9 | 62.7 | 70.2 | 7.5 |
| Goa | 69.7 | 66.1 | 74.0 | 7.9 | 3.6 | 73.3 | 68.7 | 79.1 | 10.4 |
| Jammu and Kashmir | 69.2 | 67.6 | 70.8 | 3.2 | 2.6 | 71.8 | 70.9 | 72.8 | 1.9 |
| Delhi | 69.2 | 66.8 | 73.1 | 6.3 | −1.2 | 68.0 | 65.2 | 71.3 | 6.1 |
| Gujarat | 68.7 | 65.9 | 72.0 | 6.1 | −1.0 | 67.7 | 64.3 | 71.5 | 7.2 |
| Lakshadweep | 68.5 | 65.9 | 71.6 | 5.7 | 2.7 | 71.2 | 66.1 | 76.3 | 10.2 |
| Meghalaya | 68.5 | 65.0 | 72.6 | 7.6 | 0.3 | 68.8 | 66.5 | 71.4 | 4.9 |
| Haryana | 68.4 | 65.8 | 71.9 | 6.1 | −2.4 | 66.0 | 61.9 | 71.0 | 9.1 |
| West Bengal | 68.3 | 67.4 | 69.2 | 1.8 | −3.6 | 64.7 | 63.0 | 66.6 | 3.6 |
| Karnataka | 68.2 | 64.6 | 72.3 | 7.7 | −0.9 | 67.3 | 63.2 | 72.0 | 8.8 |
| Tripura | 67.8 | 64.4 | 71.8 | 7.4 | −1.8 | 66.0 | 63.7 | 68.6 | 4.9 |
| Uttarakhand | 67.6 | 64.1 | 71.6 | 7.5 | 0.7 | 68.3 | 65.4 | 71.4 | 6.0 |
| Andaman and Nicobar Islands | 67.4 | 64.1 | 71.5 | 7.4 | −0.3 | 67.1 | 62.1 | 74.3 | 12.2 |
| Jharkhand | 66.7 | 64.9 | 68.6 | 3.7 | −2.0 | 64.7 | 62.7 | 66.7 | 4.0 |
| Chhattisgarh | 66.4 | 64.6 | 68.3 | 3.7 | −2.6 | 63.8 | 60.8 | 67.0 | 6.2 |
| Puducherry | 66.3 | 60.3 | 73.9 | 13.6 | −1.7 | 64.6 | 59.0 | 70.7 | 11.7 |
| Daman and Diu | 66.2 | 61.7 | 72.5 | 10.8 | — | — | — | — | — |
| Madhya Pradesh | 66.0 | 63.6 | 68.8 | 5.2 | 0.2 | 66.2 | 63.2 | 69.5 | 6.3 |
| Uttar Pradesh | 64.9 | 63.3 | 66.6 | 3.3 | −1.9 | 63.0 | 60.6 | 65.6 | 5.0 |
| Odisha | 64.7 | 63.4 | 66.1 | 2.7 | −0.5 | 64.2 | 61.4 | 67.1 | 5.7 |
| Arunachal Pradesh | 64.6 | 63.0 | 66.5 | 3.5 | 2.9 | 67.5 | 65.0 | 70.2 | 5.2 |
| Andhra Pradesh | 64.2 | 59.9 | 69.2 | 9.3 | −0.8 | 63.4 | 59.6 | 67.8 | 8.2 |
| Tamil Nadu | 63.6 | 60.2 | 67.4 | 7.2 | 0.3 | 63.9 | 59.3 | 69.1 | 9.8 |
| Assam | 63.5 | 61.0 | 66.4 | 5.4 | 2.6 | 66.1 | 63.1 | 69.5 | 6.4 |
| Bihar | 63.0 | 62.0 | 64.0 | 2.0 | 1.4 | 64.4 | 63.3 | 65.4 | 2.1 |
| Telangana | 62.4 | 58.4 | 66.8 | 8.4 | 1.4 | 63.8 | 60.4 | 67.3 | 6.9 |
| Dadra and Nagar Haveli and Daman and Diu | — | — | — | — | — | 70.6 | 67.7 | 76.9 | 9.2 |
These are data of Indian national demographic survey "Sample Registration System" (SRS). Tables below contains only data for biggest states and union territories. Record "India on average" contains averaged data for all states and union territories.

| state | on the whole | urban | rural | urban Δ rural | |||||||||
|---|---|---|---|---|---|---|---|---|---|---|---|---|---|
| overall | males | females | F Δ M | overall | males | females | F Δ M | overall | males | females | F Δ M | ||
| India on average | 70.0 | 68.6 | 71.4 | 2.8 | 73.2 | 71.9 | 74.5 | 2.6 | 68.6 | 67.2 | 70.1 | 2.9 | 4.6 |
| Delhi | 75.8 | 74.1 | 77.7 | 3.6 | 75.8 | 74.1 | 77.8 | 3.7 | 74.0 | — | 76.6 | — | 1.8 |
| Kerala | 75.0 | 71.9 | 78.0 | 6.1 | 74.7 | 71.5 | 78.0 | 6.5 | 75.2 | 72.3 | 78.1 | 5.8 | −0.5 |
| Jammu and Kashmir | 74.3 | 72.6 | 76.3 | 3.7 | 78.1 | 76.0 | 80.5 | 4.5 | 72.7 | 71.1 | 74.6 | 3.5 | 5.4 |
| Himachal Pradesh | 73.5 | 70.3 | 77.5 | 7.2 | 77.1 | 74.7 | 81.0 | 6.3 | 73.2 | 69.9 | 77.2 | 7.3 | 3.9 |
| Tamil Nadu | 73.2 | 71.0 | 75.5 | 4.5 | 75.8 | 73.7 | 78.2 | 4.5 | 70.5 | 68.3 | 72.9 | 4.6 | 5.3 |
| Maharashtra | 72.9 | 71.6 | 74.3 | 2.7 | 74.6 | 73.4 | 76.1 | 2.7 | 71.6 | 70.2 | 73.0 | 2.8 | 3.0 |
| Punjab | 72.5 | 70.8 | 74.5 | 3.7 | 75.5 | 73.3 | 78.1 | 4.8 | 70.9 | 69.2 | 72.9 | 3.7 | 4.6 |
| West Bengal | 72.3 | 71.1 | 73.6 | 2.5 | 74.5 | 73.8 | 75.3 | 1.5 | 71.1 | 69.6 | 72.7 | 3.1 | 3.4 |
| Andhra Pradesh | 70.6 | 69.1 | 72.2 | 3.1 | 72.7 | 71.6 | 73.8 | 2.2 | 69.7 | 68.0 | 71.6 | 3.6 | 3.0 |
| Uttarakhand | 70.6 | 67.5 | 73.9 | 6.4 | 71.0 | 68.8 | 73.7 | 4.9 | 70.3 | 67.0 | 73.9 | 6.9 | 0.7 |
| Gujarat | 70.5 | 68.1 | 73.2 | 5.1 | 72.2 | 70.9 | 73.6 | 2.7 | 69.2 | 65.9 | 73.1 | 7.2 | 3.0 |
| Odisha | 70.3 | 69.1 | 71.4 | 2.3 | 72.2 | 70.9 | 73.2 | 2.3 | 69.8 | 68.7 | 71.0 | 2.3 | 2.4 |
| Telangana | 70.0 | 68.7 | 71.4 | 2.7 | 72.2 | 72.0 | 72.4 | 0.4 | 68.4 | 66.5 | 70.5 | 4.0 | 3.8 |
| Haryana | 69.9 | 67.3 | 73.0 | 5.7 | 72.0 | 69.5 | 75.1 | 5.6 | 68.7 | 66.1 | 71.9 | 5.8 | 3.3 |
| Karnataka | 69.8 | 67.9 | 71.9 | 4.0 | 73.3 | 71.9 | 74.8 | 2.9 | 68.2 | 66.0 | 70.6 | 4.6 | 5.1 |
| Jharkhand | 69.6 | 70.5 | 68.9 | −1.6 | 72.2 | 71.9 | 72.4 | 0.5 | 68.8 | 70.0 | 67.9 | −2.1 | 3.4 |
| Bihar | 69.5 | 69.7 | 69.2 | −0.5 | 71.9 | 72.3 | 71.3 | −1.0 | 69.1 | 69.3 | 68.9 | −0.4 | 2.8 |
| Rajasthan | 69.4 | 67.1 | 71.7 | 4.6 | 72.6 | 71.5 | 73.6 | 2.1 | 68.4 | 65.8 | 71.2 | 5.4 | 4.2 |
| Assam | 67.9 | 67.3 | 68.6 | 1.3 | 74.1 | 73.3 | 75.0 | 1.7 | 66.7 | 66.2 | 67.4 | 1.2 | 7.4 |
| Madhya Pradesh | 67.4 | 65.5 | 69.5 | 4.0 | 70.8 | 69.3 | 72.4 | 3.1 | 66.4 | 64.3 | 68.7 | 4.4 | 4.4 |
| Uttar Pradesh | 66.0 | 65.3 | 66.7 | 1.4 | 69.2 | 69.1 | 69.3 | 0.2 | 65.0 | 64.2 | 65.9 | 1.7 | 4.2 |
| Chhattisgarh | 65.1 | 63.5 | 66.8 | 3.3 | 68.0 | 66.7 | 69.4 | 2.7 | 64.3 | 62.6 | 66.0 | 3.4 | 3.7 |

| state | on the whole | urban | rural | urban Δ rural | |||||||||
|---|---|---|---|---|---|---|---|---|---|---|---|---|---|
| overall | males | females | F Δ M | overall | males | females | F Δ M | overall | males | females | F Δ M | ||
| India on average | 69.7 | 68.4 | 71.1 | 2.7 | 73.0 | 71.8 | 74.2 | 2.4 | 68.3 | 66.9 | 69.7 | 2.8 | 4.7 |
| Delhi | 75.9 | 74.3 | 77.5 | 3.2 | 75.9 | 74.4 | 77.6 | 3.2 | 73.6 | 71.3 | 75.6 | 4.3 | 2.3 |
| Kerala | 75.2 | 72.3 | 78.0 | 5.7 | 75.1 | 72.1 | 78.0 | 5.9 | 75.2 | 72.4 | 78.1 | 5.7 | −0.1 |
| Jammu and Kashmir | 74.2 | 72.6 | 76.1 | 3.5 | 77.6 | 75.7 | 79.6 | 3.9 | 72.8 | 71.2 | 74.6 | 3.4 | 4.8 |
| Himachal Pradesh | 73.1 | 69.9 | 77.1 | 7.2 | 77.8 | 74.9 | 82.3 | 7.4 | 72.8 | 69.4 | 76.8 | 7.4 | 5.0 |
| Punjab | 72.8 | 71.1 | 74.7 | 3.6 | 75.4 | 73.0 | 78.6 | 5.6 | 71.3 | 69.7 | 73.3 | 3.6 | 4.1 |
| Maharashtra | 72.7 | 71.6 | 74.0 | 2.4 | 74.5 | 73.2 | 76.0 | 2.8 | 71.4 | 70.2 | 72.5 | 2.3 | 3.1 |
| Tamil Nadu | 72.6 | 70.6 | 74.9 | 4.3 | 74.9 | 73.0 | 77.1 | 4.1 | 70.4 | 68.3 | 72.7 | 4.4 | 4.5 |
| West Bengal | 72.1 | 71.0 | 73.2 | 2.2 | 74.3 | 73.6 | 75.1 | 1.5 | 70.9 | 69.5 | 72.2 | 2.7 | 3.4 |
| Uttarakhand | 70.6 | 67.6 | 73.9 | 6.3 | 71.0 | 68.7 | 73.7 | 5.0 | 70.4 | 67.1 | 73.9 | 6.8 | 0.6 |
| Andhra Pradesh | 70.3 | 68.9 | 71.8 | 2.9 | 72.7 | 71.8 | 73.5 | 1.7 | 69.4 | 67.7 | 71.2 | 3.5 | 3.3 |
| Gujarat | 70.2 | 67.9 | 72.8 | 4.9 | 72.0 | 70.8 | 73.2 | 2.4 | 68.9 | 65.7 | 72.5 | 6.8 | 3.1 |
| Haryana | 69.9 | 67.7 | 72.6 | 4.9 | 72.4 | 70.1 | 75.0 | 4.9 | 68.6 | 66.3 | 71.4 | 5.1 | 3.8 |
| Telangana | 69.8 | 68.6 | 71.1 | 2.5 | 71.9 | 71.7 | 72.1 | 0.4 | 68.3 | 66.6 | 70.1 | 3.5 | 3.6 |
| Odisha | 69.8 | 68.5 | 71.1 | 2.6 | 72.2 | 71.3 | 73.1 | 1.8 | 69.3 | 68.0 | 70.7 | 2.7 | 2.9 |
| Karnataka | 69.5 | 67.9 | 71.3 | 3.4 | 72.8 | 71.7 | 73.9 | 2.2 | 67.9 | 66.0 | 70.0 | 4.0 | 4.9 |
| Jharkhand | 69.4 | 70.2 | 68.8 | −1.4 | 72.2 | 71.8 | 72.6 | 0.8 | 68.6 | 69.6 | 67.7 | −1.9 | 3.6 |
| Bihar | 69.2 | 69.6 | 68.8 | −0.8 | 72.0 | 72.5 | 71.4 | −1.1 | 68.8 | 69.2 | 68.4 | −0.8 | 3.2 |
| Rajasthan | 69.0 | 66.8 | 71.3 | 4.5 | 72.6 | 71.8 | 73.3 | 1.5 | 67.9 | 65.4 | 70.6 | 5.2 | 4.7 |
| Assam | 67.5 | 66.8 | 68.3 | 1.5 | 74.1 | 73.3 | 74.9 | 1.6 | 66.2 | 65.6 | 67.0 | 1.4 | 7.9 |
| Madhya Pradesh | 67.0 | 65.2 | 69.1 | 3.9 | 70.7 | 69.4 | 72.2 | 2.8 | 65.9 | 63.8 | 68.1 | 4.3 | 4.8 |
| Uttar Pradesh | 65.6 | 65.0 | 66.2 | 1.2 | 68.9 | 68.8 | 69.0 | 0.2 | 64.6 | 63.8 | 65.3 | 1.5 | 4.3 |
| Chhattisgarh | 65.3 | 63.7 | 66.9 | 3.2 | 68.3 | 67.0 | 69.8 | 2.8 | 64.4 | 62.8 | 66.0 | 3.2 | 3.9 |


This is a list of Indian states by life expectancy at birth. The figures come from the Human Development Index Report, published in 2011, by United Nations Development Programme (UNDP) India [4] and Sample Registration Survey (SRS) based life table 2010–14. [5] [6]
The report provides life expectancy at birth based on mortality rates in years 2002–06, 2010–14, 2019, and 2019-21.
| Rank | State | Life expectancy at birth | |||||
|---|---|---|---|---|---|---|---|
| 2021 | 2019-21 [1] [7] [8] | 2019 [9] | 2014–17 [10] | 2010–14 [6] | 2002–06 [11] | ||
| 0 | India | 67.24 | 65.8 | 70.91 | 69 [12] [13] | 68 | 63.5 |
| 1 | Nagaland | 69.84 | 75.4 | 73.65 | - | - | - |
| 2 | Goa | 72.59 | 73.3 | 76.55 | - | - | - |
| 3 | Mizoram | 67.15 | 72.1 | 70.81 | - | - | - |
| 4 | Jammu and Kashmir | 69.56 | 71.8 | 73.36 | 74.1 | 72.6 | - |
| 5 | Rajasthan | 67.13 | 71.5 | 70.80 | 68.5 | 67.7 | 62.0 |
| 6 | Kerala | 74.23 | 71.2 | 78.29 | 74.7 | 69.9 | 64.1 |
| 6 | Lakshadweep | 71.01 | 71.2 | 74.88 | - | - | - |
| 8 | Himachal Pradesh | 69.19 | 70.6 | 72.96 | 72.6 | 71.6 | 67.02 |
| 8 | Daman and Diu | 70.6 | 74.04 | - | - | - | |
| 8 | Dadra and Nagar Haveli | 70.6 | 73.57 | - | - | - | |
| 11 | Maharashtra | 70.6 | 69.3 | 74.46 | 72.5 | 71.6 | 67.2 |
| 12 | Meghalaya | 68.93 | 68.8 | 72.69 | - | - | - |
| 13 | Uttarakhand | 67.66 | 68.3 | 71.35 | 71.7 | 71.7 | 60.0 |
| 14 | Delhi | 68.0 | 74.19 | 75.2 | 74.9 | 73.8 | |
| 15 | Gujarat | 68.44 | 67.7 | 72.18 | 69.7 | 68.7 | - |
| 16 | Manipur | 70.87 | 67.6 | 74.73 | - | - | - |
| 17 | Arunachal Pradesh | 69.87 | 67.5 | 73.68 | - | - | - |
| 18 | Karnataka | 70.5 | 67.3 | 74.34 | 69.2 | 68.8 | 65.3 |
| 19 | Andaman and Nicobar Islands | 73.31 | 67.1 | 77.32 | - | - | - |
| 20 | Chandigarh | 70.71 | 66.5 | 74.57 | - | - | - |
| 21 | Punjab | 69.73 | 66.2 | 73.54 | 72.4 | 71.6 | 69.4 |
| 21 | Madhya Pradesh | 65.05 | 66.2 | 68.60 | 66 | 64.2 | 58.0 |
| 23 | Assam | 66.38 | 66.1 | 70 | 66.2 | 63.9 | 58.9 |
| 24 | Haryana | 69.12 | 66.0 | 72.90 | 69.7 | 68.6 | - |
| 24 | Tripura | 70.25 | 66.0 | 74.08 | - | - | - |
| 26 | Sikkim | 71.04 | 65.9 | 74.92 | - | - | - |
| 27 | West Bengal | 69.48 | 64.7 | 73.27 | 71.2 | 70.2 | 64.9 |
| 27 | Jharkhand | 66.49 | 64.7 | 70.12 | 68.6 | 66.6 | 58.0 |
| 29 | Puducherry | 71.6 | 64.6 | 75.51 | - | - | - |
| 30 | Bihar | 66.3 | 64.4 | 69.92 | 68.9 | 68.1 | 61.6 |
| 31 | Odisha | 66.62 | 64.2 | 70.16 | 68.4 | 65.8 | 59.6 |
| 32 | Tamil Nadu | 71.4 | 63.9 | 75.29 | 71.7 | 70.6 | 66.2 |
| 33 | Telangana | 68.59 | 63.8 | 72.33 | - | - | - |
| 33 | Chhattisgarh | 64.76 | 63.8 | 68.30 | 65.2 | 64.8 | 58.0 |
| 35 | Andhra Pradesh | 67.69 | 63.4 [14] | 71.39 [15] | 69.7 | 68.5 | 64.4 |
| 36 | Uttar Pradesh | 63.39 | 63.0 | 66.85 | 65 | 64.1 | 60.0 |
Data about life expectancy according to a 2024 study by Yadav et al. which estimates district and state-wise life expectancy model-based (Bayesian hierarchical model) using NFHS-5 data on infant mortality rate and life tables showing age-specific mortality rates. [16]
| state | 2019-2021 [16] | |||
|---|---|---|---|---|
| overall | males | females | F Δ M | |
| India on average | 73.2 | 71.9 | 74.5 | 2.6 |
| Nagaland | 84.1 | 82.5 | 85.9 | 3.4 |
| Sikkim | 83.0 | 82.8 | 83.2 | 0.4 |
| Tamil Nadu | 81.3 | 80.1 | 82.7 | 2.6 |
| Kerala | 79.9 | 80.1 | 79.7 | -0.4 |
| Goa | 78.7 | 79.0 | 78.3 | -0.7 |
| Puducherry | 78.2 | 78.2 | 78.2 | 0.0 |
| Lakshadweep | 78.2 | 78.2 | 78.2 | 0.0 |
| Karnataka | 75.9 | 73.8 | 78.2 | 4.4 |
| Haryana | 75.8 | 73.2 | 78.7 | 5.5 |
| Punjab | 75.1 | 74.6 | 75.7 | 1.1 |
| Jammu and Kashmir | 75.0 | 75.0 | 75.0 | 0.0 |
| Mizoram | 74.9 | 74.8 | 74.9 | 0.1 |
| Maharashtra | 74.6 | 74.3 | 74.9 | 0.6 |
| Meghalaya | 74.4 | 72.9 | 76.0 | 3.1 |
| Gujarat | 74.3 | 74.0 | 74.7 | 0.7 |
| Himachal Pradesh | 74.2 | 73.9 | 74.5 | 0.6 |
| Arunachal Pradesh | 74.2 | 73.7 | 74.7 | 1.0 |
| Manipur | 74.0 | 71.4 | 76.7 | 5.3 |
| Delhi | 72.4 | 72.6 | 72.3 | -0.3 |
| Uttarakhand | 72.3 | 72.6 | 72.0 | -0.6 |
| Assam | 71.6 | 68.9 | 74.5 | 5.6 |
| Tripura | 71.1 | 69.9 | 72.2 | 2.3 |
| Rajasthan | 70.9 | 65.7 | 76.8 | 11.1 |
| Chhattisgarh | 70.2 | 69.6 | 70.9 | 1.3 |
| Uttar Pradesh | 69.8 | 68.9 | 70.7 | 1.8 |
| Odisha | 69.5 | 68.5 | 70.6 | 2.1 |
| Bihar | 69.3 | 68.5 | 70.3 | 1.8 |
| Telangana | 69.0 | 69.2 | 68.7 | -0.5 |
| Jharkhand | 68.4 | 66.9 | 70.1 | 3.2 |
| West Bengal | 68.1 | 68.0 | 68.1 | 0.1 |
| Madhya Pradesh | 68.1 | 66.7 | 69.6 | 2.9 |
| Chandigarh | 65.9 | 61.9 | 70.7 | 8.8 |
| Andhra Pradesh | 64.8 | 62.2 | 67.7 | 5.5 |
| Andaman and Nicobar Islands | — | — | — | — |
| Dadra and Nagar Haveli and Daman and Diu | — | — | — | — |
Data source: Yadav et al. [16]
| Year | Combined | Rural | Urban | ||||||
|---|---|---|---|---|---|---|---|---|---|
| Total | Male | Female | Total | Male | Female | Total | Male | Female | |
| 1973 | 49.7 | 50.5 | 49.0 | 48.0 | 48.9 | 47.1 | 58.9 | 58.8 | 59.2 |
| 1978 | 52.3 | 52.5 | 52.1 | 50.6 | 51.0 | 50.3 | 60.1 | 59.6 | 60.8 |
| 1983 | 55.4 | 55.4 | 55.7 | 53.7 | 54.0 | 53.6 | 62.8 | 61.6 | 64.1 |
| 1988 | 57.7 | 57.7 | 58.1 | 56.1 | 56.1 | 56.2 | 63.4 | 62.0 | 64.9 |
| 1989 | 58.3 | 58.1 | 58.6 | 56.8 | 56.7 | 56.9 | 63.8 | 62.3 | 65.3 |
| 1990 | 58.7 | 58.6 | 59.0 | 57.4 | 57.2 | 57.4 | 64.1 | 62.8 | 65.5 |
| 1991 | 59.4 | 59.0 | 59.7 | 58.0 | 57.9 | 58.1 | 64.9 | 63.5 | 66.3 |
| 1992 | 60.0 | 59.4 | 60.4 | 58.6 | 58.2 | 58.7 | 65.4 | 64.1 | 66.7 |
| 1993 | 60.3 | 59.7 | 60.9 | 58.9 | 58.5 | 59.3 | 65.9 | 64.5 | 67.3 |
| 1994 | 60.7 | 60.1 | 61.4 | 59.4 | 58.9 | 59.8 | 66.3 | 64.9 | 67.7 |
| 1995 | 61.1 | 60.4 | 61.8 | 59.9 | 59.3 | 60.2 | 66.6 | 65.1 | 68.0 |
| 1996 | 61.4 | 60.6 | 62.2 | 60.1 | 59.5 | 60.5 | 66.8 | 65.3 | 68.2 |
| 1997 | 61.5 | 60.8 | 62.3 | 60.3 | 59.7 | 60.9 | 66.4 | 65.1 | 67.9 |
| 1998 | 61.9 | 61.2 | 62.7 | 60.7 | 60.1 | 61.3 | 66.7 | 65.4 | 68.3 |
| 1999 | 62.3 | 61.4 | 63.3 | 61.1 | 60.3 | 61.9 | 67.1 | 65.7 | 68.7 |
| 2000 | 62.9 | 61.9 | 64.0 | 61.6 | 60.7 | 62.5 | 67.6 | 66.1 | 69.2 |
| 2001 | 63.4 | 62.3 | 64.6 | 62.2 | 61.1 | 63.2 | 68.0 | 66.5 | 69.7 |
| 2002 | 63.9 | 62.8 | 65.2 | 62.7 | 61.6 | 63.8 | 68.4 | 66.9 | 70.0 |
| 2003 | 64.3 | 63.1 | 65.6 | 63.0 | 61.9 | 64.2 | 68.6 | 67.2 | 70.3 |
| 2004 | 64.7 | 63.5 | 66.1 | 63.5 | 62.3 | 64.7 | 68.9 | 67.4 | 70.6 |
| 2005 | 65.0 | 63.7 | 66.5 | 63.8 | 62.6 | 65.2 | 69.0 | 67.5 | 70.7 |
| 2006 | 65.4 | 64.0 | 66.9 | 64.2 | 62.9 | 65.7 | 69.0 | 67.5 | 70.8 |
| 2007 | 65.7 | 64.3 | 67.2 | 64.5 | 63.2 | 66.0 | 69.2 | 67.6 | 71.0 |
| 2008 | 66.1 | 64.6 | 67.7 | 64.9 | 63.5 | 66.5 | 69.6 | 68.0 | 71.4 |
| 2009 | 66.5 | 64.9 | 68.2 | 65.3 | 63.8 | 67.0 | 70.1 | 68.4 | 71.9 |
| 2010 | 67.0 | 65.4 | 68.8 | 65.8 | 64.2 | 67.6 | 70.6 | 69.0 | 72.4 |
| 2011 | 67.5 | 65.8 | 69.3 | 66.3 | 64.6 | 68.1 | 71.2 | 69.6 | 73.0 |
| 2012 | 67.9 | 66.4 | 69.6 | 66.7 | 65.1 | 68.4 | 71.5 | 70.0 | 73.5 |


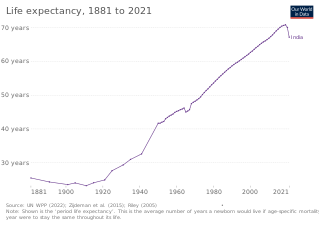


India is the most populous country in the world with one-sixth of the world's population. According to estimates from the United Nations (UN), India has overtaken China as the country with the largest population in the world, with a population of 1,425,775,850 at the end of April 2023.

The Kerala model refers to the practices adopted by the Indian state of Kerala to further human development. It is characterised by results showing strong social indicators when compared to the rest of the country such as high literacy and life expectancy rates, highly improved access to healthcare, and low infant mortality and birth rates. Despite having a lower per capita income, the state is sometimes compared to developed countries. These achievements along with the factors responsible for such achievements have been considered characteristic results of the Kerala model. Academic literature discusses the primary factors underlying the success of the Kerala model as its decentralization efforts, the political mobilization of the poor, and the active involvement of civil society organizations in the planning and implementation of development policies.
Barnala is one of the districts of Indian state of Punjab. It was carved out of Sangrur district, in November 2006. It is a centrally located district bordered by Ludhiana district on the north, Moga district on northwest, Bathinda district on west, Sangrur district on east and Mansa district on south. As per census 2011, Population of District Barnala is 5,96,294. Barnala boasts a significant number of colleges that offer a diverse range of educational opportunities in fields such as engineering, arts, medicine, and commerce. Furthermore, the town is renowned for its thriving industrial sector. Two main Industries: Trident Group and a large Industry producing Combines, Standard Combines were also established here.

Maternal mortality in India is the maternal death of a woman in India during pregnancy or after pregnancy, including post-abortion or post-birth periods. Different countries and cultures have different rates and causes for maternal death. Within India, there is a marked variation in healthcare access between regions and in socioeconomic factors, accordingly, there is also variation in maternal deaths for various states, regions, and demographics of women.