Map
North America population by country [1]
United States (56.3%)
Mexico (21.3%)
Canada (6.4%)
Guatemala (3.0%)
Haiti (1.9%)
Dominican Republic (1.9%)
Cuba (1.9%)
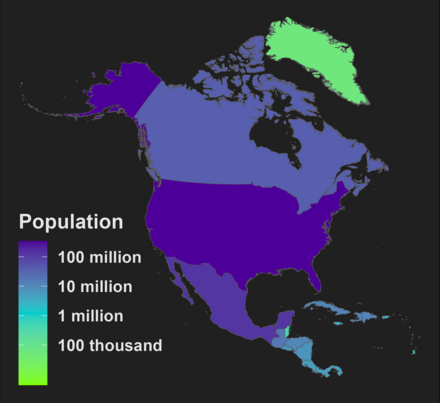
This is a list of North American countries and dependencies by population in North America, total projected population from the United Nations [1] and the latest official figure.
North America population by country [1]
| Country / dependency | % total | North America population | % change | Official figure | Official date | ||
|---|---|---|---|---|---|---|---|
| 1 | 56.3% | 339,996,564 | 0.5% | 333,287,557 | 1 Jul 2022 [2] | [lower-alpha 1] | |
| 2 | 21.3% | 128,455,567 | 0.7% | 129,035,733 | 1 Jan 2023 [3] | ||
| 3 | 6.4% | 38,781,292 | 0.9% | 39,566,248 | 1 Jan 2023 [4] | ||
| 4 | 3.0% | 18,092,026 | 1.4% | 17,602,431 | 1 Jul 2023 [5] | ||
| 5 | 1.9% | 11,724,764 | 1.2% | 9,801,664 | 1 Jul 2012 [6] | ||
| 6 | 1.9% | 11,332,973 | 0.9% | 10,711,155 | 1 Jul 2023 [7] | ||
| 7 | 1.9% | 11,194,449 | -0.2% | 11,113,215 | 1 Jul 2023 [8] | ||
| 8 | 1.8% | 10,593,798 | 1.5% | 9,745,100 | 1 Jul 2023 [9] | ||
| 9 | 1.2% | 7,046,311 | 1.4% | 6,664,364 | 30 Jun 2021 [10] | ||
| 10 | 1.1% | 6,364,943 | 0.5% | 6,765,800 | 30 Jun 2020 [11] | ||
| 11 | 0.9% | 5,212,173 | 0.6% | 5,163,021 | 30 Jun 2020 [12] | ||
| 12 | 0.7% | 4,468,087 | 1.3% | 4,278,500 | 1 Jul 2020 [13] | ||
| 0.5% | 3,260,314 | 0.2% | 3,221,789 | 1 Jul 2022 [14] | |||
| 13 | 0.5% | 2,825,544 | -0.1% | 2,734,092 | 1 Jul 2019 [15] | ||
| 14 | 0.3% | 1,534,937 | 0.3% | 1,365,805 | 30 Jun 2022 [16] | ||
| 15 | 0.1% | 412,624 | 0.6% | 395,640 | 1 Jul 2019 [17] | ||
| 16 | 0.1% | 410,825 | 1.4% | 441,471 | 1 Jul 2022 [18] | ||
| 0.1% | 395,839 | 0.0% | 375,845 | 1 Jan 2023 [19] | |||
| 0.1% | 366,981 | -0.1% | 347,686 | 1 Jan 2023 [19] | |||
| 17 | 0.05% | 281,996 | 0.1% | 277,821 | 1 May 2010 [20] | ||
| 0.03% | 192,077 | 0.5% | 148,925 | 1 Jan 2023 [21] | |||
| 18 | 0.03% | 180,251 | 0.2% | 178,696 | 1 Jul 2018 [22] | ||
| 19 | 0.02% | 126,184 | 0.6% | 112,579 | 1 Jul 2019 [23] | ||
| 0.02% | 106,277 | -0.2% | 107,457 | 31 Dec 2021 [24] | |||
| 20 | 0.02% | 103,699 | -0.2% | 110,418 | 1 Jul 2022 [25] | ||
| 0.02% | 98,750 | -0.7% | 87,146 | 1 Apr 2020 [26] | |||
| 21 | 0.02% | 94,298 | 0.6% | 100,772 | 1 Jan 2022 [27] | ||
| 22 | 0.01% | 73,040 | 0.4% | 71,293 | 14 May 2011 [28] | ||
| 0.01% | 69,310 | 0.9% | 71,432 | 10 Oct 2021 [29] | |||
| 0.01% | 64,069 | -0.2% | 63,982 | 1 Jul 2023 [30] | |||
| 0.01% | 56,643 | 0.3% | 50,145 | 1 Apr 2023 [31] | |||
| 23 | 0.01% | 47,755 | 0.2% | 47,195 | 15 May 2011 [32] | ||
| 0.01% | 46,062 | 0.8% | 46,131 | 1 Jul 2021 [33] | |||
| 0.01% | 44,222 | 0.1% | 42,938 | 1 Jan 2023 [34] | |||
| 0.01% | 32,077 | 0.9% | 32,358 | 1 Jan 2020 [35] | |||
| 0.01% | 31,538 | 0.7% | 28,054 | 12 Jul 2010 [36] | |||
| 0.004% | 27,148 | 0.4% | 27,726 | 1 Jan 2022 [37] | |||
| 0.003% | 15,900 | 0.3% | 15,780 | 1 Dec 2022 [38] | |||
| 0.002% | 10,994 | 0.2% | 10,585 | 1 Jan 2020 [35] | |||
| 0.001% | 5,840 | -0.4% | 6,092 | 1 Jan 2020 [35] | |||
| 0.001% | 4,387 | -0.1% | 4,433 | 1 Jul 2022 [39] | |||
| Total | 100% | 604,182,528 | 0.6% | 594,259,074 |
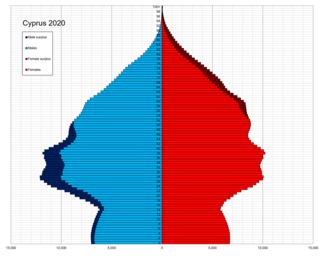
The people of Cyprus are broadly divided into two main ethnic communities, Greek Cypriots and Turkish Cypriots, who share many cultural traits but maintain distinct identities based on ethnicity, religion, language, and close ties with Greece and Turkey respectively. Before the dispute started in 1964 the peoples of Cyprus were dispersed over the entire island.

The demographic features of the population of Georgia include population growth, population density, ethnicity, education level, health, economic status, religious affiliations, and other aspects of the population.

India is the most populous country in the world with one-sixth of the world's population. According to estimates from the United Nations (UN), India has overtaken China as the country with the largest population in the world, with a population of 1,425,775,850 at the end of April 2023.

Laos is a country in Southeast Asia. The country's population was estimated at about 7.43 million in 2021, dispersed unevenly across the country. Most people live in valleys of the Mekong River and its tributaries. Vientiane Prefecture, which includes Vientiane, the capital and largest city of the country, had 820,924 residents as of the 2015 census. The country's population density is 26.7/km2.
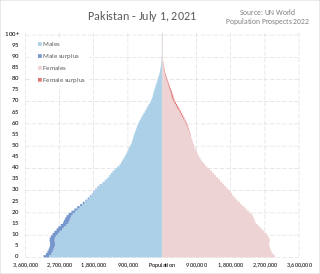
Pakistan had a population of 241,492,197 according to the final results of the 2023 Census. This figure includes Pakistan's four provinces e.g. Punjab, Sindh, KPK, Balochistan and Islamabad Capital Territory. AJK and Gilgit-Baltistan's census data is yet to be approved by CCI Council of Pakistan. Pakistan is the world's fifth most populous country.

This is a demography of the population of Panama including population density, ethnicity, education level, health of the populace, economic status, religious affiliations, and other aspects of the population. Panama's 2020 census has been postponed due to the COVID-19 pandemic but the government are currently assessing additional implications. They are evaluating the preparatory processes that can begin now, such as procurement.
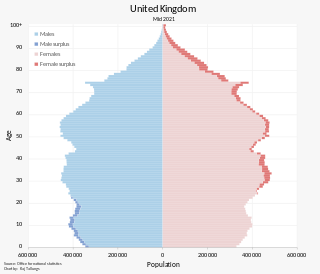
The population of the United Kingdom was estimated at almost 67.6 million people in 2022. It is the 21st most populated country in the world and has a population density of 279 people per square kilometre, with England having significantly greater density than Wales, Scotland, and Northern Ireland. Almost a third of the population lives in south east England, which is predominantly urban and suburban, with about 9 million in the capital city, London, whose population density is just over 5,200 per square kilometre.

Demographic features of the population of Albania include population density, ethnicity, education level, health of the populace, economic status, religious affiliations and other aspects. The demography of the Albania is monitored by the Institute of Statistics of Albania. The institute has performed demographic censuses since the 1920s. The latest census in Albania was performed in April 2011, and has been deemed as unreliable both within and outside Albania.
Population decline, also known as depopulation, is a reduction in a human population size. Throughout history, Earth's total human population has continued to grow; however, current projections suggest that this long-term trend of steady population growth may be coming to an end.
The Australian Bureau of Statistics (ABS) is an Australian Government agency that collects and analyses statistics on economic, population, environmental, and social issues to advise the Australian Government.
This is a list of countries and territories in Europe by population density. Data are from the United Nations unless otherwise specified.