List of countries by inequality-adjusted Human Development Index

Last updated

World map representing the inequality-adjusted Human Development Index categories (based on 2022 data, published in 2024).
.mw-parser-output .legend{page-break-inside:avoid;break-inside:avoid-column}.mw-parser-output .legend-color{display:inline-block;min-width:1.25em;height:1.25em;line-height:1.25;margin:1px 0;text-align:center;border:1px solid black;background-color:transparent;color:black}.mw-parser-output .legend-text{}
0.800-1.000 (very high)
0.700-0.799 (high)
0.550-0.699 (medium)
0.220-0.549 (low)
Data unavailable 2022-24 UN Human Development Report (inequality-adjusted).svg
World map representing the inequality-adjusted Human Development Index categories (based on 2022 data, published in 2024).
  0.800–1.000 (very high)
  0.700–0.799 (high)
  0.550–0.699 (medium)
  0.220–0.549 (low)
  Data unavailable
World map showing more detailed breakdown of countries by inequality-adjusted Human Development Index (based on 2022 data, published in 2024).
0.900-0.910
0.850-0.899
0.800-0.849
0.750-0.799
0.700-0.749
0.650-0.699
0.600-0.649
0.550-0.599
0.500-0.549
0.450-0.499
0.400-0.449
0.350-0.399
0.300-0.349
0.250-0.299
0.222-0.249
Data unavailable 2024 Inequality-Adjusted Human Development Index.svg
World map showing more detailed breakdown of countries by inequality-adjusted Human Development Index (based on 2022 data, published in 2024).
  0.900–0.910
  0.850–0.899
  0.800–0.849
  0.750–0.799
  0.700–0.749
  0.650–0.699
  0.600–0.649
  0.550–0.599
  0.500–0.549
  0.450–0.499
  0.400–0.449
  0.350–0.399
  0.300–0.349
  0.250–0.299
  0.222–0.249
  Data unavailable

This is a list of countries by inequality-adjusted Human Development Index (IHDI), as published by the UNDP in its 2024 Human Development Report. According to the 2016 Report, "The IHDI can be interpreted as the level of human development when inequality is accounted for," whereas the Human Development Index itself, from which the IHDI is derived, is "an index of potential human development (or the maximum IHDI that could be achieved if there were no inequality)." [1] [2]

Contents

Methodology

The index captures the HDI of the average (calculated using not arithmetic, but geometric mean) person in society, which is less than the aggregate HDI when there is inequality in the distribution of health, education and income. Under perfect equality, the HDI and IHDI are equal; the greater the difference between the two, the greater the inequality.

The IHDI, estimated for the world and specific countries, captures the losses in human development due to inequality in health, education and income. Losses in all three dimensions vary across countries, ranging from just a few percent (Czech Republic, Slovenia) up to over 40% (Comoros, Central African Republic). Overall loss takes into account all three dimensions. [3]

List

The table below ranks countries according to their inequality-adjusted human development index (IHDI). Data is based on 2022 estimates.

2022 inequality-adjusted HDI (IHDI) (2024 report)

Table of countries by IHDI
Country2022 estimates (2024 report) [4] [5]
IHDIHDIOverall loss (%) due to inequality
1Flag of Iceland.svg  Iceland 0.9100.9595.1
2Flag of Norway.svg  Norway 0.9030.9666.5
3Flag of Denmark.svg  Denmark 0.8980.9525.7
4Flag of Switzerland (Pantone).svg   Switzerland 0.8910.9677.9
5Flag of Finland.svg  Finland 0.8860.9425.9
6Flag of Ireland.svg  Ireland 0.8860.9506.7
7Flag of the Netherlands.svg  Netherlands 0.8850.9466.4
8Flag of Slovenia.svg  Slovenia 0.8820.9264.8
9Flag of Germany.svg  Germany 0.8810.9507.3
10Flag of Sweden.svg  Sweden 0.8780.9527.8
11Flag of Belgium (civil).svg  Belgium 0.8780.9426.8
12Flag of the United Kingdom.svg  United Kingdom 0.8650.9408.0
13Flag of Canada (Pantone).svg  Canada 0.8640.9357.6
14Flag of Australia (converted).svg  Australia 0.8600.9469.1
15Flag of Austria.svg  Austria 0.8590.9267.2
16Flag of the United Arab Emirates.svg  United Arab Emirates 0.8590.9378.3
17Flag of New Zealand.svg  New Zealand 0.8560.9398.8
18Flag of the Czech Republic.svg  Czech Republic 0.8480.8955.3
19Flag of Japan.svg  Japan 0.8440.9208.3
20Flag of South Korea.svg  South Korea 0.8410.9299.5
21Flag of Hong Kong.svg  Hong Kong 0.8400.95612.1
22Flag of Luxembourg.svg  Luxembourg 0.8390.9279.5
23Flag of Malta.svg  Malta 0.8370.9158.5
24Flag of Estonia.svg  Estonia 0.8350.8997.1
25Flag of Cyprus.svg  Cyprus 0.8270.9078.8
26Flag of Singapore.svg  Singapore 0.8250.94913.1
27Flag of the United States.svg  United States 0.8230.92711.2
28Flag of France.svg  France 0.8200.9109.9
29Flag of Croatia.svg  Croatia 0.8170.8786.9
30Flag of Andorra.svg  Andorra 0.8100.8848.4
31Flag of Israel.svg  Israel 0.8080.91511.7
32Flag of Slovakia.svg  Slovakia 0.8080.8555.5
33Flag of Latvia.svg  Latvia 0.8020.8798.8
34Flag of Italy.svg  Italy 0.8020.90611.5
35Flag of Greece.svg  Greece 0.8010.89310.3
36Flag of Hungary.svg  Hungary 0.8000.8516.0
37Flag of Poland.svg  Poland 0.7970.8819.5
38Flag of Spain.svg  Spain 0.7960.91112.6
39Flag of Lithuania.svg  Lithuania 0.7950.8799.6
40Flag of Portugal.svg  Portugal 0.7740.87411.4
41Flag of Montenegro.svg  Montenegro 0.7560.84410.4
42Flag of Belarus.svg  Belarus 0.7500.8016.4
43Flag of Russia.svg  Russia 0.7470.8219.0
44Flag of Argentina.svg  Argentina 0.7470.84912.0
45Flag of Serbia.svg  Serbia 0.7400.8058.1
46Flag of Romania.svg  Romania 0.7390.82710.6
47Flag of Kazakhstan.svg  Kazakhstan 0.7340.8028.5
48Flag of Georgia.svg  Georgia 0.7280.81410.6
49Flag of Brunei.svg  Brunei Darussalam 0.7270.82311.7
50Flag of Oman.svg  Oman 0.7210.81912.0
51Flag of Armenia.svg  Armenia 0.7210.7868.3
52Flag of Uruguay.svg  Uruguay 0.7200.83013.3
53Flag of Turkey.svg  Turkey 0.7170.85516.1
54Flag of Seychelles.svg  Seychelles 0.7150.80210.8
55Flag of Azerbaijan.svg  Azerbaijan 0.7070.7607.0
56Flag of Chile.svg  Chile 0.7040.86018.1
57Flag of Bulgaria.svg  Bulgaria 0.7030.79912.0
58Flag of Moldova.svg  Moldova 0.6980.7638.5
59Flag of Malaysia.svg  Malaysia 0.6920.80714.3
60Flag of Albania.svg  Albania 0.6870.78912.9
61Flag of Thailand.svg  Thailand 0.6810.80315.2
62Flag of North Macedonia.svg  North Macedonia 0.6790.76511.2
63Flag of Ukraine.svg  Ukraine 0.6760.7347.9
64Flag of Bosnia and Herzegovina.svg  Bosnia and Herzegovina 0.6670.77914.4
65Flag of the Bahamas.svg  Bahamas 0.6630.82019.1
66Flag of the People's Republic of China.svg  China 0.6620.78816.0
67Flag of Costa Rica.svg  Costa Rica 0.6560.80618.6
68Flag of Tonga.svg  Tonga 0.6540.73911.5
69Flag of Panama.svg  Panama 0.6470.82021.1
70Flag of Mongolia.svg  Mongolia 0.6450.74113.0
71Flag of Mexico.svg  Mexico 0.6410.78117.9
72Flag of Kyrgyzstan (2023).svg  Kyrgyzstan 0.6340.7019.6
73Flag of Palau.svg  Palau 0.6330.79720.6
74Flag of Fiji.svg  Fiji 0.6320.72913.3
75Flag of Sri Lanka.svg  Sri Lanka 0.6300.78019.2
76Flag of Ecuador.svg  Ecuador 0.6300.76517.6
77Flag of the Dominican Republic.svg  Dominican Republic 0.6270.76618.1
78Flag of Mauritius.svg  Mauritius 0.6250.79621.5
79Flag of the Marshall Islands.svg  Marshall Islands 0.6200.73115.2
80Flag of Barbados.svg  Barbados 0.6170.80923.7
81Flag of Jordan.svg  Jordan 0.6150.73616.4
82Flag of Peru.svg  Peru 0.6070.76220.3
83Flag of Vietnam.svg  Vietnam 0.6070.72616.4
84Flag of Samoa.svg  Samoa 0.6020.70214.2
85Flag of Venezuela.svg  Venezuela 0.6000.69914.2
86Flag of Maldives.svg  Maldives 0.5970.76221.7
87Flag of the Philippines.svg  Philippines 0.5900.71016.9
88Flag of Algeria.svg  Algeria 0.5880.74521.1
89Flag of Indonesia.svg  Indonesia 0.5880.71317.5
90Flag of Palestine.svg  Palestine 0.5870.71618.0
91Flag of Tajikistan.svg  Tajikistan 0.5850.67913.8
92Flag of Iran.svg  Iran 0.5840.78025.1
93Flag of Jamaica.svg  Jamaica 0.5840.70617.3
94Flag of Paraguay.svg  Paraguay 0.5820.73120.4
95Flag of Brazil.svg  Brazil 0.5770.76024.1
World0.5760.73922.1
96Flag of Tunisia.svg  Tunisia 0.5740.73221.6
97Flag of Colombia.svg  Colombia 0.5680.75825.1
98Flag of Egypt.svg  Egypt 0.5610.72822.9
99Bandera de Bolivia (Estado).svg  Bolivia 0.5600.69819.8
100Flag of El Salvador.svg  El Salvador 0.5480.67418.7
101Flag of Tuvalu.svg  Tuvalu 0.5450.65316.5
102Flag of Saint Lucia.svg  Saint Lucia 0.5390.72525.7
103Flag of Kiribati.svg  Kiribati 0.5280.62815.9
104Flag of Gabon.svg  Gabon 0.5260.69324.1
105Flag of Iraq.svg  Iraq 0.5190.67322.9
106Flag of Morocco.svg  Morocco 0.5080.69827.2
107Flag of Nicaragua.svg  Nicaragua 0.5070.66924.2
108Flag of Botswana.svg  Botswana 0.4880.70831.1
109Flag of Honduras.svg  Honduras 0.4800.62423.1
110Flag of Myanmar.svg  Myanmar 0.4750.60821.9
111Flag of Cape Verde.svg  Cabo Verde 0.4710.66128.7
112Flag of Bangladesh.svg  Bangladesh 0.4700.67029.9
113Flag of Laos.svg  Laos 0.4660.62024.8
114Flag of Bhutan.svg  Bhutan 0.4650.68131.7
115Flag of South Africa.svg  South Africa 0.4620.71735.6
116Flag of Sao Tome and Principe.svg  São Tomé and Príncipe 0.4590.61325.1
117Flag of Guatemala.svg  Guatemala 0.4530.62928.0
118Flag of India.svg  India 0.4440.64431.1
119Flag of Cambodia.svg  Cambodia 0.4380.60027.0
120Flag of Kenya.svg  Kenya 0.4380.60127.1
121Flag of Nepal.svg    Nepal 0.4240.60129.5
122Flag of East Timor.svg  Timor-Leste 0.4070.56628.1
123Flag of Papua New Guinea.svg  Papua New Guinea 0.4070.56828.3
124Flag of Namibia.svg  Namibia 0.3990.61534.6
125Flag of the Republic of the Congo.svg  Republic of the Congo 0.3850.59335.1
126Flag of Ghana.svg  Ghana 0.3780.60237.2
127Flag of Rwanda.svg  Rwanda 0.3770.54831.2
128Flag of Uganda.svg  Uganda 0.3770.55031.5
129Flag of Eswatini.svg  Eswatini 0.3720.61039.0
130Flag of Tanzania.svg  Tanzania 0.3720.53230.1
131Flag of Zimbabwe.svg  Zimbabwe 0.3700.55032.7
132Flag of Nigeria.svg  Nigeria 0.3690.54832.7
133Flag of Cameroon.svg  Cameroon 0.3620.58738.3
134Flag of Pakistan.svg  Pakistan 0.3600.54033.3
135Flag of Malawi.svg  Malawi 0.3590.50829.3
136Flag of Mauritania.svg  Mauritania 0.3510.54035.0
137Flag of Togo.svg  Togo 0.3450.54736.9
138Flag of Angola.svg  Angola 0.3440.59141.8
139Flag of Zambia.svg  Zambia 0.3440.56939.5
140Flag of Djibouti.svg  Djibouti 0.3410.51533.8
141Flag of Haiti.svg  Haiti 0.3350.55239.3
142Flag of Senegal.svg  Senegal 0.3340.51735.4
143Flag of the Comoros.svg  Comoros 0.3340.58643.0
144Flag of Lesotho.svg  Lesotho 0.3320.52136.3
145Flag of Sudan.svg  Sudan 0.3310.51635.9
146Flag of Madagascar.svg  Madagascar 0.3280.48732.6
147Flag of Ethiopia.svg  Ethiopia 0.3240.49234.1
148Flag of Cote d'Ivoire.svg  Côte d'Ivoire 0.3180.53440.4
149Flag of the Democratic Republic of the Congo.svg  Democratic Republic of the Congo 0.3150.48134.5
150Flag of The Gambia.svg  Gambia 0.3110.49537.2
151Flag of Liberia.svg  Liberia 0.3100.48736.3
152Flag of Guinea-Bissau.svg  Guinea-Bissau 0.3100.48335.8
153Flag of Benin.svg  Benin 0.3090.50438.7
154Flag of the Taliban.svg  Afghanistan 0.3000.46235.1
155Flag of Yemen.svg  Yemen 0.2850.42432.8
156Flag of Guinea.svg  Guinea 0.2850.47139.5
157Flag of Sierra Leone.svg  Sierra Leone 0.2770.45839.5
158Flag of Mali.svg  Mali 0.2770.41032.4
159Flag of Burundi.svg  Burundi 0.2730.42035.0
160Flag of Mozambique.svg  Mozambique 0.2700.46141.4
161Flag of Niger.svg  Niger 0.2620.39433.5
162Flag of Burkina Faso.svg  Burkina Faso 0.2610.43840.4
163Flag of Chad.svg  Chad 0.2380.39439.6
164Flag of the Central African Republic.svg  Central African Republic 0.2370.38738.8
165Flag of South Sudan.svg  South Sudan 0.2220.38141.7

See also

Related Research Articles

<span class="mw-page-title-main">Economy of Cameroon</span>

The economy of Cameroon was one of the most prosperous in Africa for a quarter of a century after independence. The drop in commodity prices for its principal exports – petroleum, cocoa, coffee, and cotton – in the mid-1980s, combined with an overvalued currency and economic mismanagement, led to a decade-long recession. Real per capita GDP fell by more than 60% from 1986 to 1994. The current account and fiscal deficits widened, and foreign debt grew. Yet because of its oil reserves and favorable agricultural conditions, Cameroon still has one of the best-endowed primary commodity economies in sub-Saharan Africa.

<span class="mw-page-title-main">Economy of the Central African Republic</span>

The economy of the Central African Republic is $2.321 billion by gross domestic product as of 2019, even lower than much smaller countries such as Barbados with an estimated annual per capita income of just $805 as measured by purchasing power parity in 2019.

<span class="mw-page-title-main">Economy of Maldives</span>

In ancient times, Maldives were renowned for cowries, coir rope, dried tuna fish, ambergris (maavaharu) and coco de mer (tavakkaashi). Local and foreign trading ships used to load these products in the Maldives and bring them abroad.

<span class="mw-page-title-main">Economy of Saint Vincent and the Grenadines</span>

The economy of Saint Vincent and the Grenadines is heavily dependent on agriculture, being the world's leading producer of arrowroot and grows other exotic fruit, vegetables and root crops. Bananas alone account for upwards of 60% of the work force and 50% of merchandise exports in Saint Vincent and the Grenadines. Such reliance on a single crop makes the economy vulnerable to external factors. St. Vincent's banana growers benefited from preferential access to the European market. In view of the European Union's announced phase-out of this preferred access, economic diversification is a priority.

<span class="mw-page-title-main">Human Development Index</span> Composite statistic of life expectancy, education, and income indices

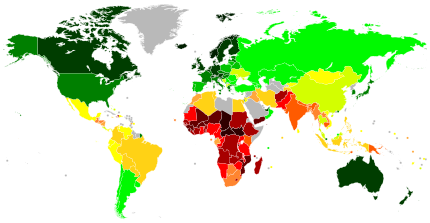
The Human Development Index (HDI) is a statistical composite index of life expectancy, education, and per capita income indicators, which is used to rank countries into four tiers of human development. A country scores a higher level of HDI when the lifespan is higher, the education level is higher, and the gross national income GNI (PPP) per capita is higher. It was developed by Pakistani economist Mahbub ul-Haq and was further used to measure a country's development by the United Nations Development Programme (UNDP)'s Human Development Report Office.

<span class="mw-page-title-main">Capability approach</span> Normative approach to human welfare

The capability approach is a normative approach to human welfare that concentrates on the actual capability of persons to achieve lives they value rather than solely having a right or freedom to do so. It was conceived in the 1980s as an alternative approach to welfare economics.

The Human Poverty Index (HPI) was an indication of the poverty of community in a country, developed by the United Nations to complement the Human Development Index (HDI) and was first reported as part of the Human Development Report in 1997. It is developed by United Nations Development Program which also publishes indexes like HDI It was considered to better reflect the extent of deprivation in deprived countries compared to the HDI. In 2010, it was supplanted by the UN's Multidimensional Poverty Index.

<span class="mw-page-title-main">Human Development Report</span> Annual report by the Human Development Report Office of the United Nations Development Programme

The Human Development Report (HDR) is an annual Human Development Index report published by the Human Development Report Office of the United Nations Development Programme (UNDP).

The Gender Development Index (GDI) is an index designed to measure gender equality.

<span class="mw-page-title-main">Multidimensional Poverty Index</span> Range of poverty indicators

Multidimensional Poverty Indices use a range of indicators to calculate a summary poverty figure for a given population, in which a larger figure indicates a higher level of poverty. This figure considers both the proportion of the population that is deemed poor, and the 'breadth' of poverty experienced by these 'poor' households, following the Alkire & Foster 'counting method'. The method was developed following increased criticism of monetary and consumption based poverty measures, seeking to capture the deprivations in non-monetary factors that contribute towards well-being. While there is a standard set of indicators, dimensions, cutoffs and thresholds used for a 'Global MPI', the method is flexible and there are many examples of poverty studies that modify it to best suit their environment. The methodology has been mainly, but not exclusively, applied to developing countries.

<span class="mw-page-title-main">Gender Inequality Index</span> United Nations index for gender inequality

The Gender Inequality Index (GII) is an index for the measurement of gender disparity that was introduced in the 2010 Human Development Report 20th anniversary edition by the United Nations Development Programme (UNDP). According to the UNDP, this index is a composite measure to quantify the loss of achievement within a country due to gender inequality. It uses three dimensions to measure opportunity cost: reproductive health, empowerment, and labor market participation. The new index was introduced as an experimental measure to remedy the shortcomings of the previous indicators, the Gender Development Index (GDI) and the Gender Empowerment Measure (GEM), both of which were introduced in the 1995 Human Development Report.

Measures of gender equality or inequality are statistical tools employed to quantify the concept of gender equality.

References

  1. Human Development Reports, Composite indices — HDI and beyond (2015) 87
  2. "Inequality-adjusted Human Development Index (IHDI)". Hdr.undp.org. Retrieved 2010-11-05.
  3. "Frequently Asked Questions - Inequality-adjusted Human Development Index (IHDI)". United Nations.
  4. "Download IHDI dataset". hdr.undp.org. UNDP . Retrieved 13 September 2022.
  5. "All composite indices and components time series (1990-2021)". hdr.undp.org. UNDP . Retrieved 13 September 2022.