Rockingham County is a county in the U.S. state of New Hampshire. As of the 2020 census, the population was 314,176, making it New Hampshire's second-most populous county. The county seat is Brentwood. Rockingham County is part of the Boston-Cambridge-Newton, MA-NH Metropolitan Statistical Area and the greater Boston-Worcester-Providence, MA-RI-NH-CT Combined Statistical Area. Per the 2020 census, it was New Hampshire's fastest growing county from 2010 to 2020.

Merrimack County is a county in the U.S. state of New Hampshire. As of the 2020 Census, the population was 153,808, making it the third most populous county in New Hampshire. Its county seat is Concord, the state capital. The county was organized in 1823 from parts of Hillsborough and Rockingham counties, and is named for the Merrimack River. Merrimack County comprises the Concord, NH Micropolitan Statistical Area, which in turn constitutes a portion of the Boston–Worcester–Providence, MA–RI–NH–CT Combined Statistical Area. In 2010, the center of population of New Hampshire was located in Merrimack County, in the town of Pembroke.
Hillsborough County is the most populous county in the U.S. state of New Hampshire. As of the 2020 census, the population was 422,937, almost one-third the population of the entire state. Its county seats are Manchester and Nashua, the state's two biggest cities. Hillsborough is northern New England's most populous county as well as its most densely populated.

Amherst is a town in Hillsborough County in the state of New Hampshire, United States. The population was 11,753 at the 2020 census. Amherst is home to Ponemah Bog Wildlife Sanctuary, Hodgman State Forest, the Joe English Reservation and Baboosic Lake.

Bow is a town in Merrimack County, New Hampshire, United States. The population was 8,229 at the 2020 census, up from 7,519 at the 2010 census, an increase of 9.4%.
The State of New Hampshire has a republican form of government modeled after the Government of the United States, with three branches: the executive, consisting of the Governor of New Hampshire and the other elected constitutional officers; the legislative, called the New Hampshire General Court, which includes the Senate and the House of Representatives; and the judicial, consisting of the Supreme Court of New Hampshire and lower courts.

The New Hampshire House of Representatives is the lower house in the New Hampshire General Court, the bicameral legislature of the state of New Hampshire. The House of Representatives consists of 400 members coming from 203 legislative districts across the state, created from divisions of the state's counties. On average, each legislator represents about 3,300 residents, which is the smallest lower house representative-to-population ratio in the country.
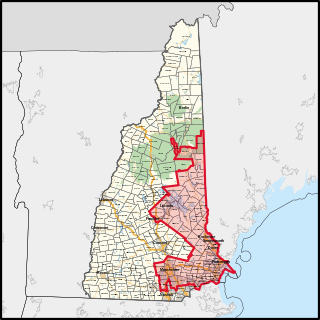
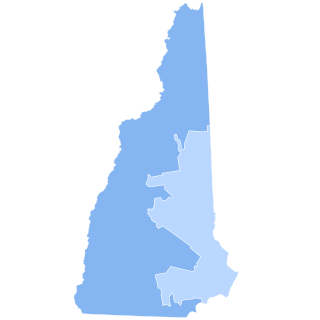
New Hampshire's 1st congressional district covers parts of Southern New Hampshire and the eastern portion of the state. The district contains parts of Hillsborough, Rockingham, Merrimack, Grafton, and Belknap counties; and the entirety of Strafford and Carroll counties.
New Hampshire is often noted for its moderate politics and its status as a prominent swing state. Voters predominantly selected Republicans for national office during the 19th and 20th centuries until 1992. Since then, the state has been considered a swing state. Since 2006, control of the state legislature and New Hampshire's congressional seats have switched back and forth between Republicans and Democrats. Although the state has voted for the Democratic candidate in the last four presidential elections since 2004, it has done so by relatively small margins.

The 2008 United States House of Representatives elections in New Hampshire were held on November 4, 2008, to determine who would represent the state of New Hampshire in the United States House of Representatives during the 111th Congress from January 3, 2009, until January 3, 2011. Both seats were held by Democratic incumbents before the election, which coincided with the 2008 presidential election, as well as the state's senatorial and gubernatorial elections.

The 2010 congressional elections in New Hampshire were held on November 2, 2010 to determine who will represent the state of New Hampshire in the United States House of Representatives. It coincided with the state's senatorial and gubernatorial elections. Representatives are elected for two-year terms; those elected served in the 112th Congress from January 2011 until January 2013.
The 2012 United States House of Representatives elections in New Hampshire were held on Tuesday, November 6, 2012 to elect the two U.S. representatives from the state of New Hampshire. The elections coincided with the elections of other federal and state offices, including a quadrennial presidential election.

The 2018 New Hampshire House of Representatives elections took place as part of the biennial United States elections. New Hampshire voters elected all 400 state representatives from 103 districts. State representatives serve two-year terms in the New Hampshire House of Representatives. A primary election on September 11, 2018 determined which candidates appear on the November 6 general election ballot. All the members elected served in the 166th New Hampshire General Court.
The 2018 New Hampshire Executive Council elections were held on November 6, 2018 to elect all five members of the Executive Council of New Hampshire. The party primaries were held on September 11.

The 2022 United States House of Representatives elections in New Hampshire were held on November 8, 2022, to elect the two U.S. representatives from the state of New Hampshire, one from each of the state's two congressional districts.

The 2020 New Hampshire House of Representatives elections took place as part of the biennial United States elections. New Hampshire voters elected all 400 state representatives from 204 districts. State representatives serve two-year terms in the New Hampshire House of Representatives. A primary election on September 8, 2020 determined which candidates appeared on the November 3 general election ballot. All the members elected will serve in the 167th New Hampshire General Court.
The 2020 New Hampshire Executive Council elections took place on Tuesday, November 3, 2020, to elect all five members of the Executive Council of New Hampshire. The party primaries were held on September 8.

The 2022 New Hampshire House of Representatives election was held in the U.S. state of New Hampshire on November 8, 2022, to elect all 400 members of the House of Representatives of the 168th New Hampshire General Court.
The 2022 New Hampshire Senate elections took place as part of the biennial 2022 United States elections. New Hampshire voters elected state senators in all of the state's 24 senate districts. State senators serve two-year terms in the New Hampshire Senate, with all of the seats up for election each cycle. The primary elections held on September 13, 2022, determined which candidates would appear on the November 8, 2022, general election ballot.
The 2024 United States House of Representatives elections in New Hampshire will be held on November 5, 2024, to elect the two U.S. representatives from the state of New Hampshire, one from each of the state's two congressional districts. The primary elections are scheduled for September 10, 2024.