North Devon | |
---|---|
County constituency for the House of Commons | |
County | Devon |
Electorate | 75,098 (December 2010) [1] |
Major settlements | Barnstaple and Ilfracombe |
Current constituency | |
Created | 1950 |
Member of Parliament | Selaine Saxby (Conservative) |
Seats | One |
Created from | Barnstaple and South Molton |
1832–1885 | |
Seats | Two |
Type of constituency | County constituency |
Created from | Devon |
Replaced by | South Molton Barnstaple Tiverton Honiton |
North Devon is a constituency [n 1] represented in the House of Commons of the UK Parliament since 2019 by Selaine Saxby of the Conservative Party. [n 2]
1832–1868: The Hundreds of Bampton, Black Torrington, Braunton, Crediton, Fremington, Halberton, Hartland, Hayridge, Hemyock, North Tawton and Winkleigh, Shebbear, Sherwill, South Molton, Tiverton, Witheridge, and West Budleigh. [2]
1868–1885: The Hundreds of Bampton, Braunton, Crediton, Fremington, Halberton, Hartland, Hayridge, Hemyock, North Tawton, Shebbear, Sherwill, South Molton, Tiverton, Winkleigh, Witheridge, and West Budleigh. [3]
1950–1974: The Boroughs of Barnstaple and South Molton, the Urban Districts of Ilfracombe and Lynton, and the Rural Districts of Barnstaple and South Molton.
1974–1983: The Boroughs of Barnstaple and Bideford, the Urban Districts of Ilfracombe, Lynton, and Northam, and the Rural Districts of Barnstaple, Bideford, and South Molton.
1983–2010: The District of North Devon, and the District of Mid Devon wards of Taw, Taw Vale, and West Creedy.
2010–present: The District of North Devon.
Further to the 2023 Periodic Review of Westminster constituencies, enacted by the Parliamentary Constituencies Order 2023, the composition of the constituency from the 2024 United Kingdom general election will be unchanged. [4]
A two-seat constituency of the same name existed from 1832 to 1885, formally titled the 'Northern Division of Devon'.
This began at the 1832 general election, when the Reform Act 1832 divided the former two-seat Devon into Northern and Southern divisions, each of which elected two MPs using the bloc vote system of election. The constituency was abolished for the 1885 general election, when the Redistribution of Seats Act split the county into smaller single-seat divisions. Its second creation is current, and began at the 1950 general election (covering a smaller area than before). Prior to 1950, its territory was split between the old constituencies of Barnstaple and South Molton.
In the 20th century this area had a prominent national MP, Jeremy Thorpe, who led a Liberal Party revival countrywide, with particular strength in the south-west. The Liberal Democrats and its predecessor the Liberal Party have, since the Second World War, performed strongly in this seat; it was held for twenty years by Thorpe as the Liberal leader. He lost it in the 1979 general election, amid a scandal as a married man in love with Norman Scott and Thorpe's alleged involvement in a plot to murder him, of which he was found not guilty the same year. At the 1992 general election Liberal Democrat Nick Harvey regained the seat from the Conservatives. He lost the seat 23 years later.
Election | 1st Member [5] | 1st Party | 2nd Member [5] | 2nd Party | ||
---|---|---|---|---|---|---|
1832 | Viscount Ebrington | Whig [6] [7] | Hon. Newton Fellowes | Whig [6] [8] | ||
1837 | Sir Thomas Dyke Acland, Bt | Conservative [6] | ||||
1839 by-election | Lewis William Buck | Conservative [6] | ||||
1857 | James Wentworth Buller | Whig [6] [9] | Charles Trefusis | Conservative | ||
1859 | Liberal | |||||
1865 by-election | Sir Thomas Dyke Acland, Bt | Liberal | ||||
1866 by-election | Sir Stafford Northcote, Bt | Conservative | ||||
1885 by-election | John Moore-Stevens | Conservative | ||||
1885 | constituency abolished by Redistribution of Seats Act |
The Member of Parliament for the constituency is Selaine Saxby who succeeded the previous conservative MP Peter Heaton-Jones at the 2019 UK General Election.
Party | Candidate | Votes | % | ±% | |
---|---|---|---|---|---|
Labour | Nicky Edwards | ||||
Reform UK | Nigel James [10] | ||||
Green | Cassius Lay [11] | ||||
Liberal Democrats | Ian Roome [12] | ||||
Conservative | Selaine Saxby [13] | ||||
Majority | |||||
Turnout |
Party | Candidate | Votes | % | ±% | |
---|---|---|---|---|---|
Conservative | Selaine Saxby | 31,479 | 56.5 | +10.7 | |
Liberal Democrats | Alex White | 16,666 | 29.9 | −8.1 | |
Labour | Finola O'Neill | 5,097 | 9.1 | −3.6 | |
Green | Robbie Mack | 1,759 | 3.2 | +1.8 | |
Independent | Steve Cotten | 580 | 1.0 | New | |
Majority | 14,813 | 26.6 | +18.8 | ||
Turnout | 55,581 | 73.3 | +0.1 | ||
Conservative hold | Swing | ||||
Party | Candidate | Votes | % | ±% | |
---|---|---|---|---|---|
Conservative | Peter Heaton-Jones | 25,517 | 45.8 | +3.1 | |
Liberal Democrats | Nick Harvey | 21,185 | 38.0 | +8.6 | |
Labour | Mark Cann | 7,063 | 12.7 | +5.6 | |
UKIP | Steve Crowther | 1,187 | 2.1 | −12.7 | |
Green | Ricky Knight | 753 | 1.4 | −4.4 | |
Majority | 4,332 | 7.8 | −5.5 | ||
Turnout | 55,705 | 73.2 | +3.0 | ||
Conservative hold | Swing | −2.7 | |||
Party | Candidate | Votes | % | ±% | |
---|---|---|---|---|---|
Conservative | Peter Heaton-Jones [17] | 22,341 | 42.7 | +6.7 | |
Liberal Democrats | Nick Harvey [18] | 15,405 | 29.4 | −18.0 | |
UKIP | Steve Crowther [19] | 7,719 | 14.8 | +7.6 | |
Labour | Mark Cann [17] | 3,699 | 7.1 | +1.9 | |
Green | Ricky Knight [17] | 3,018 | 5.8 | +4.4 | |
Communist | Gerry Sables | 138 | 0.3 | +0.1 | |
Majority | 6,936 | 13.3 | +1.9 | ||
Turnout | 52,453 | 70.2 | +1.3 | ||
Conservative gain from Liberal Democrats | Swing | +12.3 | |||
Party | Candidate | Votes | % | ±% | |
---|---|---|---|---|---|
Liberal Democrats | Nick Harvey | 24,305 | 47.4 | +0.9 | |
Conservative | Philip Milton | 18,484 | 36.0 | +0.3 | |
UKIP | Steve Crowther | 3,720 | 7.2 | +2.0 | |
Labour | Mark Cann | 2,671 | 5.2 | −3.7 | |
Green | L'Anne Knight | 697 | 1.4 | −2.3 | |
BNP | Gary Marshall | 614 | 1.2 | New | |
Independent | Rodney Cann | 588 | 1.1 | New | |
English Democrat | Nigel Vidler | 146 | 0.3 | New | |
Communist | Gerry Sables | 96 | 0.2 | New | |
Majority | 5,821 | 11.4 | +1.8 | ||
Turnout | 51,321 | 68.9 | +0.6 | ||
Liberal Democrats hold | Swing | +0.6 | |||
Party | Candidate | Votes | % | ±% | |
---|---|---|---|---|---|
Liberal Democrats | Nick Harvey | 23,840 | 45.9 | +1.7 | |
Conservative | Orlando Fraser | 18,868 | 36.3 | −1.9 | |
Labour | Mark Cann | 4,656 | 9.0 | −1.1 | |
UKIP | John Browne | 2,740 | 5.3 | +0.3 | |
Green | Ricky Knight | 1,826 | 3.5 | +1.1 | |
Majority | 4,972 | 9.6 | +3.6 | ||
Turnout | 51,930 | 68.1 | −0.2 | ||
Liberal Democrats hold | Swing | +1.8 | |||
Party | Candidate | Votes | % | ±% | |
---|---|---|---|---|---|
Liberal Democrats | Nick Harvey | 21,784 | 44.2 | −6.6 | |
Conservative | Clive E.J. Allen | 18,800 | 38.2 | −1.3 | |
Labour | Vivian G. Gale | 4,995 | 10.1 | +0.3 | |
UKIP | Roger Knapman | 2,484 | 5.0 | New | |
Green | Anthony J. Bown | 1,191 | 2.4 | New | |
Majority | 2,984 | 6.0 | −5.3 | ||
Turnout | 49,254 | 68.3 | −9.4 | ||
Liberal Democrats hold | Swing | −5.8 [n 3] | |||
Party | Candidate | Votes | % | ±% | |
---|---|---|---|---|---|
Liberal Democrats | Nick Harvey | 27,824 | 50.8 | +3.7 | |
Conservative | Richard Ashworth | 21,643 | 39.5 | −6.2 | |
Labour | Eithne "Annie" Brenton | 5,347 | 9.8 | +3.9 | |
Majority | 6,181 | 11.3 | +9.9 | ||
Turnout | 54,814 | 77.7 | −6.7 | ||
Liberal Democrats hold | Swing | +5.0 | |||
Party | Candidate | Votes | % | ±% | |
---|---|---|---|---|---|
Liberal Democrats | Nick Harvey | 27,414 | 47.1 | +4.3 | |
Conservative | Tony Speller | 26,620 | 45.7 | −5.2 | |
Labour | Paul Donner | 3,410 | 5.9 | −0.4 | |
Green | Cathrine Simmons | 658 | 1.1 | New | |
Natural Law | Gray Treadwell | 107 | 0.2 | New | |
Majority | 794 | 1.4 | N/A | ||
Turnout | 58,209 | 84.4 | +2.7 | ||
Liberal Democrats gain from Conservative | Swing | +4.7 | |||
Party | Candidate | Votes | % | ±% | |
---|---|---|---|---|---|
Conservative | Tony Speller | 28,071 | 50.9 | −4.2 | |
Liberal | Michael Pinney | 23,602 | 42.8 | +4.9 | |
Labour | Ann Marjoram | 3,467 | 6.3 | +0.6 | |
Majority | 4,469 | 8.1 | −9.1 | ||
Turnout | 55,140 | 81.7 | +1.6 | ||
Conservative hold | Swing | −4.6 | |||
Party | Candidate | Votes | % | ±% | |
---|---|---|---|---|---|
Conservative | Tony Speller | 28,066 | 55.1 | +4.7 | |
Liberal | Roger Blackmore | 19,339 | 37.9 | +1.5 | |
Labour | Peter James | 2,893 | 5.7 | −5.6 | |
Ecology | Roger Joanes | 669 | 1.3 | -0.1 | |
Majority | 8,727 | 17.2 | +3.2 | ||
Turnout | 50,967 | 80.1 | −1.6 | ||
Conservative hold | Swing | +1.6 | |||
Party | Candidate | Votes | % | ±% | |
---|---|---|---|---|---|
Conservative | Tony Speller | 31,811 | 50.1 | +13.5 | |
Liberal | Jeremy Thorpe | 23,338 | 36.7 | −11.4 | |
Labour | Antony John Saltern | 7,108 | 11.2 | −3.0 | |
Ecology | Tony Whittaker | 729 | 1.2 | New | |
National Front | John Morley Price | 237 | 0.4 | New | |
English National | Frank Hansford-Miller | 142 | 0.2 | −0.8 | |
Dog Lover's Party | Auberon Waugh | 79 | 0.1 | New | |
Wessex Regionalist | Henrietta Elizabeth Rous | 50 | 0.1 | New | |
Democratic Monarchist Public Safety White Resident | Bill Boaks | 20 | 0.0 | New | |
Majority | 8,473 | 13.4 | N/A | ||
Turnout | 63,514 | 81.71 | +7.13 | ||
Conservative gain from Liberal | Swing | +12.45 | |||
Party | Candidate | Votes | % | ±% | |
---|---|---|---|---|---|
Liberal | Jeremy Thorpe | 28,209 | 48.1 | −5.8 | |
Conservative | Tony Speller | 21,488 | 36.6 | +0.2 | |
Labour | Alexandra Jessie Golant | 8,536 | 14.2 | +4.5 | |
English National | Frank Hansford-Miller | 568 | 1.0 | New | |
Majority | 6,721 | 11.5 | −6.0 | ||
Turnout | 58,621 | 74.58 | −11.9 | ||
Liberal hold | Swing | −3.0 | |||
Party | Candidate | Votes | % | ±% | |
---|---|---|---|---|---|
Liberal | Jeremy Thorpe | 34,052 | 53.9 | +9.8 | |
Conservative | Timothy Carleton Keigwin | 22,980 | 36.4 | −5.8 | |
Labour | Terence Kendrick Marston | 6,140 | 9.7 | −2.6 | |
Majority | 11,072 | 17.5 | +16.6 | ||
Turnout | 63,172 | 86.49 | +1.6 | ||
Liberal hold | Swing | +7.8 | |||
Party | Candidate | Votes | % | ±% | |
---|---|---|---|---|---|
Liberal | Jeremy Thorpe | 18,893 | 44.1 | +0.5 | |
Conservative | Timothy Carleton Keigwin | 18,524 | 43.2 | +2.7 | |
Labour | Chris Mullin | 5,268 | 12.3 | −3.6 | |
Democratic Party | Barry Gray Morris | 175 | 0.4 | New | |
Majority | 369 | 0.9 | −2.2 | ||
Turnout | 42,860 | 84.9 | −0.4 | ||
Liberal hold | Swing | +1.1 | |||
Party | Candidate | Votes | % | ±% | |
---|---|---|---|---|---|
Liberal | Jeremy Thorpe | 16,797 | 43.6 | −7.1 | |
Conservative | Timothy Carleton Keigwin | 15,631 | 40.5 | +3.5 | |
Labour | James H. Rayner | 6,127 | 15.9 | +3.6 | |
Majority | 1,166 | 3.1 | −10.6 | ||
Turnout | 38,555 | 85.3 | +1.0 | ||
Liberal hold | Swing | +5.3 | |||
Party | Candidate | Votes | % | ±% | |
---|---|---|---|---|---|
Liberal | Jeremy Thorpe | 19,031 | 50.71 | +7.77 | |
Conservative | Basil Peto | 13,895 | 37.02 | -4.94 | |
Labour | Frank Paton | 4,603 | 12.27 | -2.83 | |
Majority | 5,136 | 13.69 | +12.71 | ||
Turnout | 37,529 | 84.32 | -0.46 | ||
Liberal hold | Swing | +6.35 | |||
Party | Candidate | Votes | % | ±% | |
---|---|---|---|---|---|
Liberal | Jeremy Thorpe | 15,831 | 42.94 | +10.49 | |
Conservative | James Lindsay | 15,469 | 41.96 | -5.17 | |
Labour | Geoffrey W. Pitt | 5,567 | 15.10 | -5.32 | |
Majority | 362 | 0.98 | N/A | ||
Turnout | 36,867 | 84.78 | +3.67 | ||
Liberal gain from Conservative | Swing | +7.88 | |||
Party | Candidate | Votes | % | ±% | |
---|---|---|---|---|---|
Conservative | James Lindsay | 16,784 | 47.13 | -5.18 | |
Liberal | Jeremy Thorpe | 11,558 | 32.45 | +13.04 | |
Labour | Harold Heslop | 7,272 | 20.42 | -7.65 | |
Majority | 5,226 | 14.68 | -9.56 | ||
Turnout | 35,614 | 81.11 | 00.00 | ||
Conservative hold | Swing | +9.11 | |||
Party | Candidate | Votes | % | ±% | |
---|---|---|---|---|---|
Conservative | Christopher Peto | 19,780 | 52.41 | +6.08 | |
Labour | William H. Wilkey | 10,632 | 28.17 | +4.93 | |
Liberal | G. Alexander Halse | 7,326 | 19.41 | -11.02 | |
Majority | 9,148 | 24.24 | +8.34 | ||
Turnout | 35,614 | 81.11 | -4.58 | ||
Conservative hold | Swing | +0.51 | |||
Party | Candidate | Votes | % | ±% | |
---|---|---|---|---|---|
Conservative | Christopher Peto | 17,724 | 46.33 | ||
Liberal | Guy Naylor | 11,640 | 30.43 | ||
Labour | W.A. Barker | 8,892 | 23.24 | ||
Majority | 6,084 | 15.90 | |||
Turnout | 38,256 | 85.69 | |||
Conservative win (new seat) |
Party | Candidate | Votes | % | ±% | |
---|---|---|---|---|---|
Conservative | John Moore-Stevens [31] | Unopposed | |||
Conservative hold | |||||
Party | Candidate | Votes | % | ±% | |
---|---|---|---|---|---|
Liberal | Thomas Dyke Acland | Unopposed | |||
Conservative | Stafford Northcote | Unopposed | |||
Registered electors | 9,496 | ||||
Liberal hold | |||||
Conservative hold | |||||
Party | Candidate | Votes | % | ±% | |
---|---|---|---|---|---|
Conservative | Stafford Northcote | Unopposed | |||
Conservative hold | |||||
Party | Candidate | Votes | % | ±% | |
---|---|---|---|---|---|
Liberal | Thomas Dyke Acland | Unopposed | |||
Conservative | Stafford Northcote | Unopposed | |||
Registered electors | 9,829 | ||||
Liberal hold | |||||
Conservative hold | |||||
Party | Candidate | Votes | % | ±% | |
---|---|---|---|---|---|
Conservative | Stafford Northcote | 3,967 | 34.8 | N/A | |
Liberal | Thomas Dyke Acland | 3,898 | 34.2 | N/A | |
Conservative | John Walrond | 3,520 | 30.9 | N/A | |
Turnout | 7,642 (est) | 82.5 (est) | N/A | ||
Registered electors | 9,260 | ||||
Majority | 69 | 0.6 | N/A | ||
Conservative hold | |||||
Majority | 378 | 3.3 | N/A | ||
Liberal hold | |||||
Party | Candidate | Votes | % | ±% | |
---|---|---|---|---|---|
Conservative | Stafford Northcote | Unopposed | |||
Conservative hold | |||||
Party | Candidate | Votes | % | ±% | |
---|---|---|---|---|---|
Conservative | Stafford Northcote | Unopposed | |||
Conservative hold | |||||
Party | Candidate | Votes | % | ±% | |
---|---|---|---|---|---|
Conservative | Stafford Northcote | Unopposed | |||
Conservative hold | |||||
Party | Candidate | Votes | % | ±% | |
---|---|---|---|---|---|
Liberal | Thomas Dyke Acland | Unopposed | |||
Conservative | Charles Trefusis | Unopposed | |||
Registered electors | 8,746 | ||||
Liberal hold | |||||
Conservative hold | |||||
Party | Candidate | Votes | % | ±% | |
---|---|---|---|---|---|
Liberal | Thomas Dyke Acland | Unopposed | |||
Liberal hold | |||||
Party | Candidate | Votes | % | ±% | |
---|---|---|---|---|---|
Liberal | James Wentworth Buller | Unopposed | |||
Conservative | Charles Trefusis | Unopposed | |||
Registered electors | 8,764 | ||||
Liberal hold | |||||
Conservative hold | |||||
Party | Candidate | Votes | % | ±% | |
---|---|---|---|---|---|
Whig | James Wentworth Buller | 3,652 | 45.2 | New | |
Conservative | Charles Trefusis | 2,322 | 28.7 | N/A | |
Conservative | Stafford Northcote | 2,105 | 26.1 | N/A | |
Majority | 1,547 | 19.1 | N/A | ||
Turnout | 5,866 (est) | 80.7 (est) | N/A | ||
Registered electors | 7,264 | ||||
Whig gain from Conservative | Swing | N/A | |||
Conservative hold | Swing | N/A | |||
Party | Candidate | Votes | % | ±% | |
---|---|---|---|---|---|
Conservative | Lewis William Buck | Unopposed | |||
Conservative | Thomas Dyke Acland | Unopposed | |||
Registered electors | 8,064 | ||||
Conservative hold | |||||
Party | Candidate | Votes | % | ±% | |
---|---|---|---|---|---|
Conservative | Lewis William Buck | Unopposed | |||
Conservative | Thomas Dyke Acland | Unopposed | |||
Registered electors | 8,597 | ||||
Conservative hold | |||||
Party | Candidate | Votes | % | ±% | |
---|---|---|---|---|---|
Conservative | Lewis William Buck | Unopposed | |||
Conservative | Thomas Dyke Acland | Unopposed | |||
Registered electors | 8,869 | ||||
Conservative hold | |||||
Conservative gain from Whig |
Party | Candidate | Votes | % | ||
---|---|---|---|---|---|
Conservative | Lewis William Buck | 3,720 | 53.4 | ||
Whig | James Wentworth Buller | 3,240 | 46.6 | ||
Majority | 480 | 6.8 | |||
Turnout | 6,960 | 88.4 | |||
Registered electors | 7,871 | ||||
Conservative gain from Whig |
Party | Candidate | Votes | % | ||
---|---|---|---|---|---|
Whig | Hugh Fortescue | Unopposed | |||
Conservative | Thomas Dyke Acland | Unopposed | |||
Registered electors | 7,757 | ||||
Whig hold | |||||
Conservative gain from Whig |
Party | Candidate | Votes | % | ||
---|---|---|---|---|---|
Whig | Hugh Fortescue | Unopposed | |||
Whig | Newton Fellowes | Unopposed | |||
Registered electors | 6,236 | ||||
Whig hold | |||||
Whig hold | |||||
Party | Candidate | Votes | % | ||
---|---|---|---|---|---|
Whig | Hugh Fortescue | Unopposed | |||
Whig | Newton Fellowes | Unopposed | |||
Registered electors | 5,368 | ||||
Whig win (new seat) | |||||
Whig win (new seat) |
Torridge and West Devon is a constituency represented in the House of Commons of the UK Parliament since 2005 by Geoffrey Cox, a Conservative.
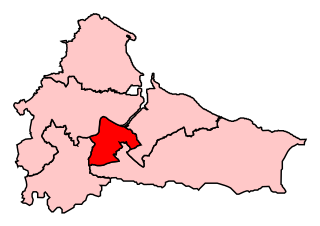
Wells is a constituency represented in the House of Commons of the UK Parliament since 2015 by James Heappey of the Conservative Party.
Totnes is a parliamentary constituency in Devon represented in the House of Commons of the UK Parliament since December 2019 by Anthony Mangnall, a Conservative. Mangnall defeated incumbent Sarah Wollaston who had originally been elected as a Conservative but defected to the Liberal Democrats earlier that year.
North Wiltshire is a constituency represented in the House of Commons of the UK Parliament since 1997 by James Gray, a Conservative. In the period 1832–1983, this was an alternative name for Chippenham or the Northern Division of Wiltshire and as Chippenham dates to the original countrywide Parliament, the Model Parliament, this period is covered in more detail in that article.
Middlesbrough was a parliamentary constituency in the United Kingdom, recreated in 1974, and represented since 2012 in the House of Commons of the UK Parliament. An earlier version of the seat existed between 1868 and 1918.
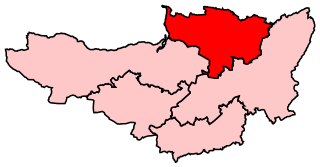
North Durham is a constituency represented in the House of Commons of the UK Parliament since 2001 by Kevan Jones of the Labour Party.
Berwick-upon-Tweed is a parliamentary constituency in Northumberland represented in the House of Commons of the UK Parliament since 2015 by Anne-Marie Trevelyan, a Conservative.
Leeds East is a constituency represented in the House of Commons of the UK Parliament since 2015 by Richard Burgon of the Labour Party.
Newark is a constituency in Nottinghamshire, England. It is currently represented by Robert Jenrick of the Conservative Party who won the seat in a by-election on 5 June 2014, following the resignation of Patrick Mercer in April 2014.
South Derbyshire is a constituency represented in the House of Commons of the UK Parliament since 2010 by Heather Wheeler, a Conservative.
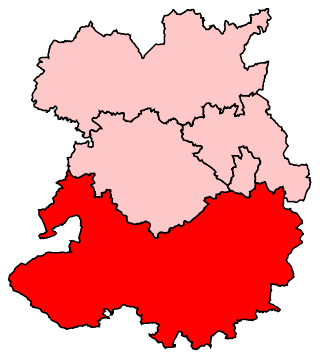
Ludlow was a constituency in Shropshire represented in the House of Commons of the UK Parliament.
North Shropshire is a constituency in the county of Shropshire, represented in the House of Commons of the UK Parliament by Helen Morgan of the Liberal Democrats after a by-election on 16 December 2021. The former MP, Owen Paterson of the Conservatives, resigned his seat on 5 November 2021 when faced with suspension from the Commons for a breach of advocacy rules and the consequent possibility of a recall petition. The seat had previously been a safe seat for the Conservatives.
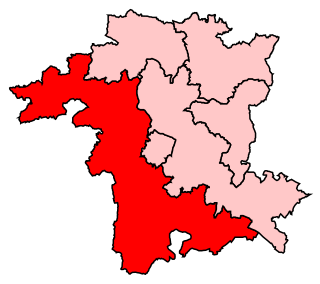
West Worcestershire is a constituency in Worcestershire represented in the House of Commons of the UK Parliament since 2010 by Harriett Baldwin, a Conservative. The constituency is considered a safe seat for the Conservatives, having been a marginal with the Liberal Democrats from 1997 to 2010. The constituency boundaries roughly correspond with the Malvern Hills District.
North Cornwall is a constituency represented in the House of Commons of the UK Parliament by Scott Mann, a Conservative since the 2015 general election. Like all British constituencies, the seat elects one Member of Parliament (MP) by the first past the post system of election at least every five years. The seat was created in 1918. Since 1950, the constituency has been held by MPs from either the Conservative Party or the Liberal Democrats.
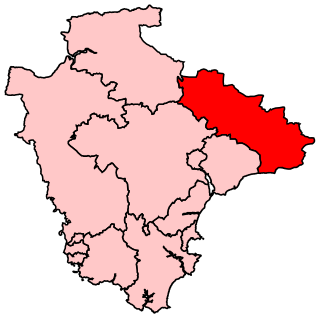
East Devon is a constituency represented in the House of Commons of the UK Parliament since 2019 by Simon Jupp of the Conservative Party.
Exeter is a constituency composed of the cathedral city and county town of Devon represented in the House of Commons of the UK Parliament. The constituency has had a history of representatives from 1900 of Conservative, Liberal Party, Independent and Labour representation.
Tiverton and Honiton is a constituency in Devon, England. The current MP is Richard Foord of the Liberal Democrats, elected at a by-election on 23 June 2022.
Cheltenham is a constituency in Gloucestershire represented in the House of Commons of the UK Parliament since 1832. As with all constituencies, it elects one Member of Parliament (MP) by the first past the post system of election at least every five years. Since 2015, its MP has been Alex Chalk, who was appointed Secretary of State for Justice in 2023.
Christchurch is a constituency in Dorset represented in the House of Commons of the UK Parliament since 1997 by Sir Christopher Chope of the Conservative Party.
Reigate is a constituency in Surrey represented in the House of Commons of the UK Parliament since 1997 by Crispin Blunt, originally of the Conservative Party, but as of October 2023, sitting as an Independent, after having the whip suspended.