North Dorset | |
---|---|
County constituency for the House of Commons | |
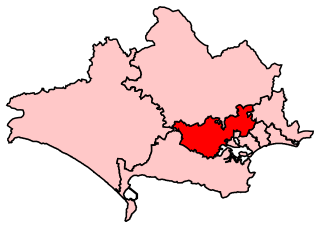
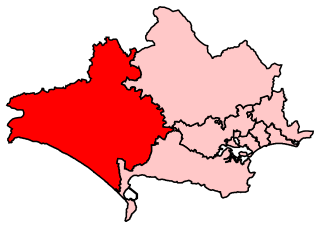
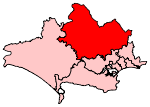
County | Dorset |
Electorate | 73,010 (December 2010) [1] |
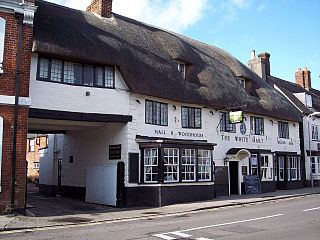
Major settlements | Blandford Forum, Gillingham, Shaftesbury, Sturminster Newton and Verwood |
Current constituency | |
Created | 1885 |
Member of Parliament | Simon Hoare (Conservative) |
Seats | One |
North Dorset is a constituency [n 1] represented in the House of Commons of the UK Parliament since 2015 by Simon Hoare, a Conservative. [n 2]
This seat was created by the Redistribution of Seats Act 1885, since which it has been won at elections by candidates from only two parties. For nineteen of the years between 1885 and 1950, North Dorset was represented by Liberals, and at all other times since 1885 it has been represented by Conservatives. It is historically one of Labour's weakest seats in the country - for example, it gave the party its lowest vote share out of all the seats it contested in 1950 and 1951.
The constituency covers North Dorset local government district and most (geographically) of East Dorset. It is largely rural, with a lower than average proportion of social housing and five small towns shown in the infobox. The largest town is Verwood, and the most central is the market town of Blandford Forum, north of the port of Poole.
1885–1918: The Borough of Shaftesbury, the Sessional Divisions of Blandford, Shaftesbury, and Sturminster, and part of the Sessional Division of Sherborne.
1918–1950: The Boroughs of Blandford Forum and Shaftesbury, the Urban District of Sherborne, the Rural Districts of Blandford, Shaftesbury, Sherborne, and Sturminster, and part of the Rural District of Wimborne and Cranborne.
1950–1974: The Boroughs of Blandford Forum and Shaftesbury, the Urban District of Wimborne Minster, and the Rural Districts of Blandford, Shaftesbury, Sturminster, and Wimborne and Cranborne.
1974–1983: As 1950 but with redrawn boundaries.
1983–1997: The District of North Dorset, the District of Wimborne wards of Colehill, Corfe Mullen Central, Corfe Mullen North, Corfe Mullen South, Crane, Holt, Sixpenny Handley, Sturminster Marshall, Vale of Allen, and Wimborne Minster, and the District of Purbeck wards of Lytchett Matravers and Lytchett Minster.
1997–2010: The District of North Dorset, and the District of East Dorset wards of Colehill, Crane, Holt, Longham, Sixpenny Handley, Stapehill, Sturminster Marshall, Vale of Allen, and Wimborne Minster.
2010–present: The District of North Dorset, and the District of East Dorset wards of Alderholt, Crane, Handley Vale, Holt, Stour, Three Cross and Potterne, Verwood Dewlands, Verwood Newtown, and Verwood Stephen's Castle.
Further to the 2023 Periodic Review of Westminster constituencies, enacted by the Parliamentary Constituencies Order 2023, from the 2024 United Kingdom general election, the constituency will be composed of the following (as they existed on 1 December 2020):
Minor changes following re-organisation of local authorities and wards in Dorset.
Party | Candidate | Votes | % | ±% | |
---|---|---|---|---|---|
Labour | James Coldwell [4] | ||||
Conservative | Simon Hoare [5] | ||||
Green | Ken Huggins [6] | ||||
Liberal Democrats | Gary Jackson [7] | ||||
Reform UK | Ash Leaning [8] | ||||
UKIP | Lester Taylor[ citation needed ] | ||||
Party | Candidate | Votes | % | ±% | |
---|---|---|---|---|---|
Conservative | Simon Hoare | 35,705 | 63.6 | -1.3 | |
Liberal Democrats | David Chadwick | 11,404 | 20.3 | +6.8 | |
Labour | Pat Osborne | 6,737 | 12.0 | -6.6 | |
Green | Ken Huggins | 2,261 | 4.0 | +1.1 | |
Majority | 24,301 | 43.3 | -3.0 | ||
Turnout | 56,107 | 73.9 | -0.1 | ||
Conservative hold | Swing | ||||
Party | Candidate | Votes | % | ±% | |
---|---|---|---|---|---|
Conservative | Simon Hoare | 36,169 | 64.9 | +8.3 | |
Labour | Pat Osborne | 10,392 | 18.6 | +9.6 | |
Liberal Democrats | Thomas Panton | 7,556 | 13.6 | +1.9 | |
Green | John Tutton | 1,607 | 2.9 | −2.8 | |
Majority | 25,777 | 46.3 | +6.8 | ||
Turnout | 55,724 | 74.0 | +2.4 | ||
Conservative hold | Swing | -0.7 | |||
Party | Candidate | Votes | % | ±% | |
---|---|---|---|---|---|
Conservative | Simon Hoare [12] | 30,227 | 56.6 | +5.5 | |
UKIP | Steve Unwin [13] | 9,109 | 17.1 | +11.9 | |
Liberal Democrats | Hugo Miéville [14] | 6,226 | 11.7 | -25.3 | |
Labour | Kim Fendley [15] | 4,785 | 9.0 | +3.6 | |
Green | Richard Barrington [16] | 3,038 | 5.7 | +4.7 | |
Majority | 21,118 | 39.5 | +25.4 | ||
Turnout | 53,385 | 71.6 | -1.9 | ||
Conservative hold | Swing | ||||
Party | Candidate | Votes | % | ±% | |
---|---|---|---|---|---|
Conservative | Robert Walter | 27,640 | 51.1 | +4.6 | |
Liberal Democrats | Emily Gasson | 20,015 | 37.0 | -0.9 | |
Labour | Mike Bunney | 2,910 | 5.4 | -4.2 | |
UKIP | Jeremy Nieboer | 2,812 | 5.2 | +1.3 | |
Green | Anna Hayball | 546 | 1.0 | -1.3 | |
Monster Raving Loony | Roger Monksummers | 218 | 0.4 | New | |
Majority | 7,625 | 14.1 | +9.9 | ||
Turnout | 54,141 | 73.5 | +4.2 | ||
Conservative hold | Swing | +2.8 | |||
Party | Candidate | Votes | % | ±% | |
---|---|---|---|---|---|
Conservative | Robert Walter | 23,714 | 44.9 | -1.8 | |
Liberal Democrats | Emily Gasson | 21,470 | 40.7 | +2.0 | |
Labour | John Yarwood | 4,596 | 8.7 | -2.5 | |
UKIP | Richard Hobbs | 1,918 | 3.6 | +1.5 | |
Green | Ralph Arliss | 1,117 | 2.1 | New | |
Majority | 2,244 | 4.2 | -3.8 | ||
Turnout | 52,815 | 71.1 | +4.8 | ||
Conservative hold | Swing | -1.9 | |||
Party | Candidate | Votes | % | ±% | |
---|---|---|---|---|---|
Conservative | Robert Walter | 22,314 | 46.7 | +2.4 | |
Liberal Democrats | Emily Gasson | 18,517 | 38.7 | -0.4 | |
Labour | Mark Wareham | 5,334 | 11.2 | +1.0 | |
UKIP | Peter Jenkins | 1,019 | 2.1 | +0.6 | |
Lower Excise Duty Party | Joseph Duthie | 391 | 0.8 | New | |
Independent | Cora Bone | 246 | 0.5 | New | |
Majority | 3,797 | 8.0 | +2.8 | ||
Turnout | 47,821 | 66.3 | -10.0 | ||
Conservative hold | Swing | +1.4 | |||
Party | Candidate | Votes | % | ±% | |
---|---|---|---|---|---|
Conservative | Robert Walter | 23,294 | 44.3 | -10.3 | |
Liberal Democrats | Paula Yates | 20,548 | 39.1 | +0.6 | |
Labour | John Fitzmaurice | 5,380 | 10.2 | +3.3 | |
Referendum | Margaret Evans | 2,564 | 4.9 | New | |
UKIP | David Wheeler | 801 | 1.5 | New | |
Majority | 2,746 | 5.2 | -10.9 | ||
Turnout | 52,587 | 76.3 | -5.5 | ||
Conservative hold | Swing | -5.5 | |||
Party | Candidate | Votes | % | ±% | |
---|---|---|---|---|---|
Conservative | Nicholas Baker | 34,234 | 54.6 | −2.5 | |
Liberal Democrats | LE Siegle | 24,154 | 38.5 | +2.2 | |
Labour | JF Fitzmaurice | 4,360 | 6.9 | +0.3 | |
Majority | 10,080 | 16.1 | −4.5 | ||
Turnout | 62,748 | 81.8 | +2.7 | ||
Conservative hold | Swing | −2.3 | |||
Party | Candidate | Votes | % | ±% | |
---|---|---|---|---|---|
Conservative | Nicholas Baker | 32,854 | 57.0 | -1.1 | |
Liberal | Geoffrey William Tapper | 20,947 | 36.4 | +0.3 | |
Labour | Joseph Hanley | 3,819 | 6.6 | +1.4 | |
Majority | 11,907 | 20.6 | -1.4 | ||
Turnout | 57,620 | 79.1 | +2.5 | ||
Conservative hold | Swing | -0.7 | |||
Party | Candidate | Votes | % | ±% | |
---|---|---|---|---|---|
Conservative | Nicholas Baker | 30,058 | 58.1 | -4.1 | |
Liberal | Geoffrey W Tapper | 18,678 | 36.1 | +10.1 | |
Labour | Jennifer Fox | 2,710 | 5.2 | -6.5 | |
Wessex Regionalist | David Fox | 294 | 0.6 | New | |
Majority | 11,380 | 22.0 | -14.2 | ||
Turnout | 51,740 | 76.6 | -3.1 | ||
Conservative hold | Swing | -7.1 | |||
Party | Candidate | Votes | % | ±% | |
---|---|---|---|---|---|
Conservative | Nicholas Baker | 40,046 | 62.2 | +11.0 | |
Liberal | G Court | 16,750 | 26.0 | -10.0 | |
Labour | MC Rowlands | 7,543 | 11.7 | -1.1 | |
Majority | 23,296 | 36.2 | +21.0 | ||
Turnout | 64,339 | 79.7 | +0.5 | ||
Conservative hold | Swing | ||||
Party | Candidate | Votes | % | ±% | |
---|---|---|---|---|---|
Conservative | David James | 28,891 | 51.2 | +0.4 | |
Liberal | Philip Watkins | 20,350 | 36.0 | -3.2 | |
Labour | TG Jones | 7,245 | 12.8 | +2.7 | |
Majority | 8,541 | 15.2 | +3.7 | ||
Turnout | 56,486 | 79.2 | -5.2 | ||
Conservative hold | Swing | ||||
Party | Candidate | Votes | % | ±% | |
---|---|---|---|---|---|
Conservative | David James | 30,288 | 50.7 | ||
Liberal | Philip Watkins | 23,405 | 39.2 | ||
Labour | TG Smith | 6,032 | 10.1 | ||
Majority | 6,883 | 11.5 | |||
Turnout | 59,725 | 84.4 | |||
Conservative hold | Swing | ||||
Party | Candidate | Votes | % | ±% | |
---|---|---|---|---|---|
Conservative | David James | 28,471 | 57.9 | +9.7 | |
Liberal | Philip Watkins | 12,095 | 24.6 | -10.6 | |
Labour | Haydn R White | 8,626 | 17.5 | +0.9 | |
Majority | 16,376 | 33.3 | +20.4 | ||
Turnout | 49,192 | 78.5 | -2.8 | ||
Conservative hold | Swing | ||||
Party | Candidate | Votes | % | ±% | |
---|---|---|---|---|---|
Conservative | Richard Glyn | 20,520 | 48.2 | -0.6 | |
Liberal | Richard Anthony Lamb | 15,005 | 35.2 | -0.9 | |
Labour | Jack R Rutland | 7,090 | 16.6 | +1.3 | |
Majority | 5,515 | 13.0 | +0.5 | ||
Turnout | 42,615 | 81.3 | -0.4 | ||
Conservative hold | Swing | ||||
Party | Candidate | Votes | % | ±% | |
---|---|---|---|---|---|
Conservative | Richard Glyn | 19,898 | 48.6 | -4.2 | |
Liberal | Richard Anthony Lamb | 14,768 | 36.1 | +5.9 | |
Labour | John F Armstrong | 6,253 | 15.3 | -1.7 | |
Majority | 5,130 | 12.5 | -10.0 | ||
Turnout | 40,919 | 81.7 | -0.3 | ||
Conservative hold | Swing | ||||
Party | Candidate | Votes | % | ±% | |
---|---|---|---|---|---|
Conservative | Richard Glyn | 20,255 | 52.8 | +0.7 | |
Liberal | John Emlyn-Jones | 11,604 | 30.2 | -2.2 | |
Labour | Herbert J Dutfield | 6,548 | 17.0 | +1.5 | |
Majority | 8,651 | 22.6 | +2.9 | ||
Turnout | 38,407 | 82.0 | -0.2 | ||
Conservative hold | Swing | ||||
Party | Candidate | Votes | % | ±% | |
---|---|---|---|---|---|
Conservative | Richard Glyn | 15,513 | 45.1 | -7.0 | |
Liberal | John Emlyn-Jones | 12,411 | 36.1 | +3.7 | |
Labour | Herbert J Dutfield | 6,278 | 18.3 | +2.8 | |
Independent | H C Wright | 170 | 0.5 | New | |
Majority | 3,102 | 9.0 | -10.7 | ||
Turnout | 34,372 | ||||
Conservative hold | Swing | -5.4 | |||
Party | Candidate | Votes | % | ±% | |
---|---|---|---|---|---|
Conservative | Robert Crouch | 18,906 | 52.1 | +5.1 | |
Liberal | Michael Portman | 11,747 | 32.4 | -12.6 | |
Labour | Herbert J Dutfield | 5,633 | 15.5 | +7.5 | |
Majority | 7,159 | 19.7 | +17.7 | ||
Turnout | 36,286 | 82.2 | -4.2 | ||
Conservative hold | Swing | ||||
Party | Candidate | Votes | % | ±% | |
---|---|---|---|---|---|
Conservative | Robert Crouch | 17,392 | 47.0 | +3.7 | |
Liberal | Frank Byers | 16,645 | 45.0 | +1.9 | |
Labour | J. R. Tudor Griffith | 2,946 | 8.0 | -5.6 | |
Majority | 747 | 2.0 | +1.8 | ||
Turnout | 36,983 | 86.4 | +1.4 | ||
Conservative hold | Swing | ||||
Party | Candidate | Votes | % | ±% | |
---|---|---|---|---|---|
Conservative | Robert Crouch | 15,324 | 43.3 | -3.0 | |
Liberal | Frank Byers | 15,227 | 43.1 | -10.6 | |
Labour | J. R. Tudor Griffith | 4,807 | 13.6 | New | |
Majority | 97 | 0.2 | N/A | ||
Turnout | 35,358 | 85.0 | +10.0 | ||
Conservative gain from Liberal | Swing | ||||
Party | Candidate | Votes | % | ±% | |
---|---|---|---|---|---|
Liberal | Frank Byers | 14,444 | 53.7 | +15.8 | |
Conservative | Richard Glyn | 12,479 | 46.3 | -3.8 | |
Majority | 1,965 | 7.40 | N/A | ||
Turnout | 26,923 | 75.04 | -4.9 | ||
Liberal gain from Conservative | Swing | ||||
General Election 1939–40
Another General Election was required to take place before the end of 1940. The political parties had been making preparations for an election to take place and by the Autumn of 1939, the following candidates had been selected;
Party | Candidate | Votes | % | ±% | |
---|---|---|---|---|---|
Conservative | Angus Hambro | 12,247 | 51.1 | +1.0 | |
Liberal | William Borthwick | 11,704 | 48.9 | +11.0 | |
Majority | 543 | 2.2 | -10.0 | ||
Turnout | 23,951 | 73.4 | -6.3 | ||
Conservative hold | Swing | -5.0 | |||
Party | Candidate | Votes | % | ±% | |
---|---|---|---|---|---|
Conservative | Cecil Hanbury | 13,055 | 50.1 | -9.1 | |
Liberal | William Borthwick | 9,871 | 37.9 | -2.9 | |
Independent Agriculturalist | George Pitt-Rivers | 1,771 | 6.8 | New | |
Labour | M M Whitehead | 1,360 | 5.2 | n/a | |
Majority | 3,184 | 12.2 | -6.2 | ||
Turnout | 26,057 | 79.7 | -2.4 | ||
Conservative hold | Swing | -3.1 | |||
Party | Candidate | Votes | % | ±% | |
---|---|---|---|---|---|
Conservative | Cecil Hanbury | 15,499 | 59.2 | +11.9 | |
Liberal | William Borthwick | 10,682 | 40.8 | -3.0 | |
Majority | 4,817 | 18.4 | +14.9 | ||
Turnout | 26,181 | 82.1 | +0.7 | ||
Conservative hold | Swing | +7.5 | |||
Party | Candidate | Votes | % | ±% | |
---|---|---|---|---|---|
Unionist | Cecil Hanbury | 12,203 | 47.3 | −6.0 | |
Liberal | William Borthwick | 11,281 | 43.8 | −2.9 | |
Labour | Colin Clark | 2,298 | 8.9 | New | |
Majority | 922 | 3.5 | −3.1 | ||
Turnout | 25,782 | 81.4 | −5.1 | ||
Registered electors | 31,684 | ||||
Unionist hold | Swing | −1.6 | |||
Party | Candidate | Votes | % | ±% | |
---|---|---|---|---|---|
Unionist | Cecil Hanbury | 11,819 | 53.3 | +5.1 | |
Liberal | John Emlyn-Jones | 10,341 | 46.7 | −5.1 | |
Majority | 1,478 | 6.6 | N/A | ||
Turnout | 22,160 | 86.5 | +2.2 | ||
Registered electors | 25,616 | ||||
Unionist gain from Liberal | Swing | +5.1 | |||
Party | Candidate | Votes | % | ±% | |
---|---|---|---|---|---|
Liberal | John Emlyn-Jones | 10,992 | 51.8 | −0.5 | |
Unionist | Cecil Hanbury | 10,211 | 48.2 | +0.5 | |
Majority | 781 | 3.6 | −1.0 | ||
Turnout | 21,203 | 84.3 | +0.1 | ||
Registered electors | 25,160 | ||||
Liberal hold | Swing | −0.5 | |||
Party | Candidate | Votes | % | ±% | |
---|---|---|---|---|---|
Liberal | John Emlyn-Jones | 10,805 | 52.3 | +3.0 | |
Unionist | Cecil Hanbury | 9,869 | 47.7 | −3.0 | |
Majority | 936 | 4.6 | N/A | ||
Turnout | 20,674 | 84.2 | +23.2 | ||
Registered electors | 24,539 | ||||
Liberal gain from Unionist | Swing | +3.0 | |||
Party | Candidate | Votes | % | ±% | |
---|---|---|---|---|---|
C | Unionist | Philip Colfox | 7,532 | 50.7 | +0.5 |
Liberal | John Emlyn-Jones | 7,320 | 49.3 | −0.5 | |
Majority | 212 | 1.4 | +1.0 | ||
Turnout | 14,852 | 61.0 | −29.6 | ||
Registered electors | 24,334 | ||||
Unionist hold | Swing | +0.5 | |||
Cindicates candidate endorsed by the coalition government. |
Party | Candidate | Votes | % | ±% | |
---|---|---|---|---|---|
Conservative | Randolf Baker | 3,919 | 50.2 | −0.7 | |
Liberal | Arthur Wills | 3,887 | 49.8 | +0.7 | |
Majority | 32 | 0.4 | −1.4 | ||
Turnout | 7,806 | 90.6 | −2.7 | ||
Registered electors | 8,616 | ||||
Conservative hold | Swing | −0.7 | |||
Party | Candidate | Votes | % | ±% | |
---|---|---|---|---|---|
Conservative | Randolf Baker | 4,093 | 50.9 | +5.1 | |
Liberal | Arthur Wills | 3,944 | 49.1 | -5.1 | |
Majority | 149 | 1.8 | N/A | ||
Turnout | 8,037 | 93.3 | +3.1 | ||
Registered electors | 8,616 | ||||
Conservative gain from Liberal | Swing | +5.1 | |||
Party | Candidate | Votes | % | ±% | |
---|---|---|---|---|---|
Liberal | Arthur Wills | 4,153 | 54.2 | +8.1 | |
Conservative | Randolf Baker | 3,508 | 45.8 | −8.1 | |
Majority | 645 | 8.4 | N/A | ||
Turnout | 7,661 | 90.2 | +7.6 | ||
Registered electors | 8,490 | ||||
Liberal gain from Conservative | Swing | +8.1 | |||
Party | Candidate | Votes | % | ±% | |
---|---|---|---|---|---|
Liberal | Arthur Wills | 4,239 | 56.0 | +9.9 | |
Conservative | Randolf Baker | 3,330 | 44.0 | -9.9 | |
Majority | 909 | 12.0 | N/A | ||
Turnout | 7,569 | 90.8 | +8.2 | ||
Registered electors | 8,338 | ||||
Liberal gain from Conservative | Swing | +9.9 | |||
Party | Candidate | Votes | % | ±% | |
---|---|---|---|---|---|
Conservative | John Kenelm Wingfield Digby | 3,705 | 53.9 | N/A | |
Liberal | George Hamilton-Gordon | 3,165 | 46.1 | New | |
Majority | 540 | 7.8 | N/A | ||
Turnout | 6,870 | 82.6 | N/A | ||
Registered electors | 8,318 | ||||
Conservative hold | Swing | N/A | |||
Party | Candidate | Votes | % | ±% | |
---|---|---|---|---|---|
Conservative | John Kenelm Wingfield Digby | Unopposed | |||
Conservative hold | |||||
Party | Candidate | Votes | % | ±% | |
---|---|---|---|---|---|
Conservative | John Kenelm Wingfield Digby | 3,981 | 53.5 | +5.2 | |
Liberal | Arthur Arnold | 3,456 | 46.5 | −5.2 | |
Majority | 525 | 7.0 | N/A | ||
Turnout | 7,437 | 85.3 | +4.3 | ||
Registered electors | 8,714 | ||||
Conservative gain from Liberal | Swing | +5.2 | |||
Party | Candidate | Votes | % | ±% | |
---|---|---|---|---|---|
Liberal | Edwin Berkeley Portman | 3,571 | 51.7 | −8.2 | |
Liberal Unionist | Evelyn Ashley [31] | 3,336 | 48.3 | +8.2 | |
Majority | 235 | 3.4 | −16.4 | ||
Turnout | 6,907 | 81.0 | −7.6 | ||
Registered electors | 8,522 | ||||
Liberal hold | Swing | −8.2 | |||
Party | Candidate | Votes | % | ±% | |
---|---|---|---|---|---|
Liberal | Edwin Berkeley Portman | 4,520 | 59.9 | ||
Conservative | Humphrey Sturt [32] | 3,031 | 40.1 | ||
Majority | 1,489 | 19.8 | |||
Turnout | 7,551 | 88.6 | |||
Registered electors | 8,522 | ||||
Liberal win (new seat) |
The Blackmore Vale is a vale, or wide valley, in north Dorset, and to a lesser extent south Somerset and southwest Wiltshire in southern England.
Sturminster Newton is a town and civil parish situated on the River Stour in the north of Dorset, England. The town is at the centre of the Blackmore Vale, a large dairy agriculture region around which the town's economy is built, and is known as 'the heart of the Blackmore vale'.
East Dorset was a local government district in Dorset, England. Its council met in Wimborne Minster between 2016 and 2019.
North Dorset was a local government district in Dorset, England, between 1974 and 2019. Its area was largely rural, but included the towns of Blandford Forum, Gillingham, Shaftesbury, Stalbridge and Sturminster Newton. Much of North Dorset was in the River Stour valley, known as the Blackmore Vale. The economy of North Dorset was largely based on dairy agriculture.
Reading West is a constituency represented in the House of Commons of the UK Parliament since 2010 by Alok Sharma, a Conservative.
South Dorset is a constituency represented in the House of Commons of the UK Parliament since 2010 by Richard Drax, a Conservative. The constituency was created as a consequence of the Redistribution of Seats Act 1885, although the area covered has changed since then.
Battersea is a constituency in the London Borough of Wandsworth. It has been represented since 2017 by Marsha de Cordova of the Labour Party.
Mid Dorset and North Poole is a constituency represented in the House of Commons of the UK Parliament since 2015 by Michael Tomlinson, a Conservative.
West Dorset is a constituency represented in the House of Commons of the UK Parliament since 2019 by Chris Loder, a Conservative.
Skipton and Ripon is a constituency in North Yorkshire represented in the House of Commons of the UK Parliament since 2010 by Julian Smith, a Conservative.
Witney is a county constituency in Oxfordshire represented in the House of Commons of the Parliament of the United Kingdom since 2016 by Robert Courts of the Conservative Party. It elects one Member of Parliament by the first-past-the-post system of election, and was created for the 1983 general election.
Christchurch is a constituency in Dorset represented in the House of Commons of the UK Parliament since 1997 by Sir Christopher Chope of the Conservative Party.
The Dorset Premier Football League is a football league based in Dorset, England, which sits at Step 7 of the National League System, or level 11 of the overall English football league system.
East Dorset is a former United Kingdom Parliamentary constituency. It was formally known as the Eastern Division of Dorset. It was a constituency of the House of Commons of the Parliament of the United Kingdom. It was represented by one Knight of the Shire.