| |||||||||||||||||||||||||
66 seats for election to Enfield London Borough Council 34 seats needed for a majority | |||||||||||||||||||||||||
---|---|---|---|---|---|---|---|---|---|---|---|---|---|---|---|---|---|---|---|---|---|---|---|---|---|
Registered | 199,069 [1] | ||||||||||||||||||||||||
Turnout | 95,490, 47.97% [1] | ||||||||||||||||||||||||
| |||||||||||||||||||||||||
|
The 1990 Enfield Council election took place on 3 May 1990 to elect members of Enfield London Borough Council in London, England. The whole council was up for election and the Conservative party stayed in overall con89trol of the council. [2]
This section is empty. You can help by adding to it. (March 2015) |
Party | Seats | Gains | Losses | Net gain/loss | Seats % | Votes % | Votes | +/− | |
---|---|---|---|---|---|---|---|---|---|
Conservative | 34 | 0 | 5 | 5 | 51.51 | 49.73 | 87,167 | ||
Labour | 32 | 5 | 0 | 5 | 48.49 | 41.44 | 72,632 | ||
Green | 0 | 0 | 0 | 0.0 | 5.75 | 10,077 | |||
Liberal Democrats | 0 | 0 | 0 | 0.0 | 2.81 | 4,931 | |||
Independent | 0 | 0 | 0 | 0.0 | 0.26 | 463 | |||
Total | 66 | 175,270 |
(*) - indicates an incumbent candidate
(†) - indicates an incumbant candidate standing in a different ward
Party | Candidate | Votes | % | |
---|---|---|---|---|
Labour | John A. Connew* | 1,343 | 55.11 | |
Labour | Grace A. Loake | 1,203 | ||
Conservative | Aneurin J.M. Preece | 890 | 37.49 | |
Conservative | Nigel C. Schofield* [n 1] | 841 | ||
Green | James P. Dillon | 171 | 7.40 | |
Registered electors | 5,182 | |||
Turnout | 2,469 | 47.65 | ||
Rejected ballots | 5 | 0.20 | ||
Labour hold | ||||
Labour gain from Conservative | ||||
Party | Candidate | Votes | % | |
---|---|---|---|---|
Labour | Allan W. Course* | 1,316 | 50.71 | |
Labour | Josepha G. Scotney* | 1,260 | ||
Conservative | Robert G. Hayward | 960 | 34.80 | |
Conservative | Ali Ahmet | 808 | ||
Green | Philip W. Chamberlain | 368 | 14.49 | |
Registered electors | 5,678 | |||
Turnout | 2,612 | 46.00 | ||
Rejected ballots | 9 | 0.34 | ||
Labour hold | ||||
Labour hold | ||||
Party | Candidate | Votes | % | |
---|---|---|---|---|
Labour | Jeffrey L. Rodin* | 1,323 | 50.25 | |
Labour | Achilleas Georgiou | 1,279 | ||
Conservative | Dogan Delman | 1,031 | 37.58 | |
Conservative | Geoffrey A. White | 915 | ||
Green | Trevor K. Halvorsen | 315 | 12.17 | |
Registered electors | 5,665 | |||
Turnout | 2,671 | 47.15 | ||
Rejected ballots | 4 | 0.15 | ||
Labour hold | ||||
Labour hold | ||||
Party | Candidate | Votes | % | |
---|---|---|---|---|
Conservative | Brian S. Tarrant* | 1,429 | 46.51 | |
Labour | Patrick M. Cunneen | 1,369 | 45.17 | |
Conservative | Brian J. Wallace | 1,289 | ||
Labour | Andrew Figiel | 1,271 | ||
Green | James F. Francey | 243 | 8.32 | |
Registered electors | 6,032 | |||
Turnout | 3,048 | 50.53 | ||
Rejected ballots | 3 | 0.10 | ||
Conservative hold | ||||
Labour gain from Conservative | ||||
Party | Candidate | Votes | % | |
---|---|---|---|---|
Conservative | Ian M. McCann* | 1,671 | 50.00 | |
Conservative | John M. Yates | 1,597 | ||
Labour | Sarah E. Doyle | 972 | 28.27 | |
Labour | Terence L. Smith | 875 | ||
Green | Sian Mills | 301 | 9.21 | |
Liberal Democrats | Angus M. Macleod | 282 | 8.23 | |
Liberal Democrats | Alfirda A. Lee | 255 | ||
Independent | Terrence McManus | 140 | 4.28 | |
Registered electors | 6,307 | |||
Turnout | 3,218 | 51.02 | ||
Rejected ballots | 1 | 0.03 | ||
Conservative hold | ||||
Party | Candidate | Votes | % | |
---|---|---|---|---|
Labour | Mark Fenton* | 1,385 | 63.35 | |
Labour | Alexander W. Mattingly* | 1,266 | ||
Conservative | Michael J. Harding | 549 | 25.18 | |
Conservative | Carol A. Crump | 505 | ||
Green | Stuart S. Penn | 240 | 11.47 | |
Registered electors | 5,606 | |||
Turnout | 2,193 | 39.12 | ||
Rejected ballots | 2 | 0.09 | ||
Labour hold | ||||
Labour hold | ||||
Party | Candidate | Votes | % | |
---|---|---|---|---|
Labour | Christopher J. Bond* | 1,627 | 47.67 | |
Labour | Patrick R. Horridge | 1,586 | ||
Conservative | Grace M. Ford* | 1,465 | 41.38 | |
Conservative | Paul A. Watts | 1,324 | ||
Green | Matthew P.J. Bright | 369 | 10.95 | |
Registered electors | 7,067 | |||
Turnout | 3,468 | 49.07 | ||
Rejected ballots | 6 | 0.17 | ||
Labour gain from Conservative | ||||
Labour hold | ||||
Party | Candidate | Votes | % | |
---|---|---|---|---|
Labour | Sheila M. Grayston* [n 2] | 1,379 | 54.37 | |
Labour | Michael Malina | 1,257 | ||
Conservative | Donald E. Scott | 886 | 36.02 | |
Conservative | Nicolas R. Parker | 859 | ||
Green | Donal J. Finn | 233 | 9.61 | |
Registered electors | 5,978 | |||
Turnout | 2,585 | 43.24 | ||
Rejected ballots | 3 | 0.12 | ||
Labour hold | ||||
Labour hold | ||||
Party | Candidate | Votes | % | |
---|---|---|---|---|
Conservative | Cecil A. Newell | 2,483 | 64.18 | |
Conservative | Ronald W. Sands | 2,462 | ||
Labour | Ronald Daultry | 621 | 14.01 | |
Labour | Walter J. Sheffield | 459 | ||
Liberal Democrats | Cyril G. Jones | 431 | 11.19 | |
Green | Annette C. Barber | 409 | 10.62 | |
Registered electors | 6,741 | |||
Turnout | 3,660 | 54.29 | ||
Rejected ballots | 2 | 0.05 | ||
Conservative hold | ||||
Party | Candidate | Votes | % | |
---|---|---|---|---|
Conservative | William Price* | 1,314 | 46.16 | |
Labour | David R.C. Beadle | 1,291 | 45.94 | |
Labour | Anne M. Thomas | 1,210 | ||
Conservative | David A. Sutton | 1,200 | ` | |
Green | Darryl Marks | 215 | 7.90 | |
Registered electors | 6,006 | |||
Turnout | 2,786 | 46.39 | ||
Rejected ballots | 3 | 0.11 | ||
Conservative hold | ||||
Labour hold | ||||
Party | Candidate | Votes | % | |
---|---|---|---|---|
Conservative | Anthony D. Wright | 1,535 | 53.48 | |
Conservative | Stephen M. Wortley* [n 3] | 1,445 | ||
Labour | Claire Davey | 590 | 20.28 | |
Labour | Philip Rowe | 539 | ||
Green | Christopher R.E. Spencer | 416 | 14.93 | |
Liberal Democrats | Margaret J. Steel | 324 | 11.31 | |
Liberal Democrats | Douglas B.L. Gifford | 305 | ||
Registered electors | 5,627 | |||
Turnout | 2,757 | 49.00 | ||
Rejected ballots | 3 | 0.11 | ||
Conservative hold | ||||
Party | Candidate | Votes | % | |
---|---|---|---|---|
Conservative | John P. Egan | 1,495 | 47.63 | |
Labour | Brian Barford | 1,229 | 41.38 | |
Conservative | Raj K. Rampal | 1,200 | ||
Labour | Barry Schwrtz | 1,112 | ||
Green | David T. Newport | 311 | 10.99 | |
Registered electors | 5,865 | |||
Turnout | 2,944 | 50.20 | ||
Rejected ballots | 5 | 0.17 | ||
Conservative hold | ||||
Labour gain from Conservative | ||||
Party | Candidate | Votes | % | |
---|---|---|---|---|
Labour | Geoffrey C.L. Southwell | 1,426 | 54.05 | |
Labour | Elizabeth J. Mason | 1,417 | ||
Conservative | David W. Dollemore | 974 | 36.22 | |
Conservative | Neil W. Hulka | 931 | ||
Green | Marghanita C.P.H. Hollands | 256 | 9.73 | |
Registered electors | 6,568 | |||
Turnout | 2,813 | 42.83 | ||
Rejected ballots | 5 | 0.18 | ||
Labour hold | ||||
Labour hold | ||||
Party | Candidate | Votes | % | |
---|---|---|---|---|
Labour | George A. Savva* | 1,513 | 50.51 | |
Labour | Elizabeth J. Mason | 1,465 | ||
Conservative | Georgiou Panayiota* [n 4] | 1,205 | 39.82 | |
Conservative | Celia A. Gooch | 1,142 | ||
Green | Avril W. Evans | 285 | 9.67 | |
Registered electors | 6,182 | |||
Turnout | 3,078 | 49.79 | ||
Rejected ballots | 4 | 0.13 | ||
Labour hold | ||||
Labour gain from Conservative | ||||
Party | Candidate | Votes | % | |
---|---|---|---|---|
Labour | Kathleen L. Prowse* | 1,573 | 55.98 | |
Labour | Rita A. Smythe† [n 5] | 1,458 | ||
Conservative | Mark L. Dingley | 960 | 32.64 | |
Conservative | Janice A. Gayler | 808 | ||
Green | Lynnette E. Reeve-Jones | 308 | 11.37 | |
Registered electors | 6,019 | |||
Turnout | 2,807 | 46.64 | ||
Rejected ballots | 4 | 0.14 | ||
Labour hold | ||||
Labour hold | ||||
Party | Candidate | Votes | % | |
---|---|---|---|---|
Labour | Brian G. Grayston* | 1,652 | 62.26 | |
Labour | Mustafa Ibrahim | 1,287 | ||
Conservative | Adrena Smith | 653 | 26.39 | |
Conservative | Mamas Georgiou | 593 | ||
Green | Norman C.B. Adams | 268 | 11.35 | |
Registered electors | 5,767 | |||
Turnout | 2,495 | 43.26 | ||
Rejected ballots | 1 | 0.04 | ||
Labour hold | ||||
Labour hold | ||||
Party | Candidate | Votes | % | |
---|---|---|---|---|
Conservative | Ian P.C. Black | 1,859 | 66.25 | |
Conservative | Victor G. James | 1,753 | ||
Labour | Stanley Carter | 662 | 21.46 | |
Labour | Richard F. Simmons | 508 | ||
Green | Susan F.S. Barnett | 335 | 12.29 | |
Registered electors | 5,353 | |||
Turnout | 2,765 | 51.65 | ||
Rejected ballots | 7 | 0.25 | ||
Conservative hold | ||||
Party | Candidate | Votes | % | |
---|---|---|---|---|
Conservative | David A. Conway* | 1,373 | 50.21 | |
Conservative | Patricia A. Dawson* | 1,255 | ||
Labour | Andrew N. Gilbert | 784 | 27.05 | |
Labour | Sukumar Mazumdar | 631 | ||
Green | Miriam F. Kennet | 310 | 11.85 | |
Liberal Democrats | Ian D. Swinton | 285 | 10.89 | |
Registered electors | 5,518 | |||
Turnout | 2,546 | 46.13 | ||
Rejected ballots | 4 | 0.16 | ||
Conservative hold | ||||
Party | Candidate | Votes | % | |
---|---|---|---|---|
Conservative | Clive C. Goldwater† [n 6] | 1,364 | 40.37 | |
Conservative | Ormand F.S. Lusk | 1,285 | ||
Labour | Christopher Cole | 1,090 | 32.15 | |
Labour | Paul G. Clark | 1,020 | ||
Green | Francis Sealey | 624 | 19.01 | |
Liberal Democrats | Michael C.F. Steel | 278 | 8.47 | |
Registered electors | 6,531 | |||
Turnout | 3,019 | 46.23 | ||
Rejected ballots | 1 | 0.03 | ||
Conservative hold | ||||
Party | Candidate | Votes | % | |
---|---|---|---|---|
Labour | Seton A.R.O. During | 1,208 | 53.13 | |
Labour | Mobin U. Ahmed | 1,166 | ||
Conservative | Philip J. Cox | 693 | 30.44 | |
Conservative | James B. Steven | 667 | ||
Green | John F. Linden | 367 | 16.43 | |
Registered electors | 5,806 | |||
Turnout | 2,353 | 40.53 | ||
Rejected ballots | 20 | 0.85 | ||
Labour hold | ||||
Labour hold | ||||
Party | Candidate | Votes | % | |
---|---|---|---|---|
Conservative | Harry W. Corpe* | 1,826 | 55.37 | |
Conservative | Doreen Mardon | 1,770 | ||
Labour | Terence M. O'Hehir | 1,003 | 30.49 | |
Labour | Kate Tordoff | 977 | ||
Green | Michael F. Bloom | 459 | 14.14 | |
Registered electors | 6,643 | |||
Turnout | 3,264 | 49.13 | ||
Rejected ballots | 6 | 0.18 | ||
Conservative hold | ||||
Party | Candidate | Votes | % | |
---|---|---|---|---|
Labour | Anthony Kinsler | 1,300 | 53.86 | |
Labour | Leonard V. Nicolls* | 1,228 | ||
Conservative | Kenneth J. Edwards | 911 | 36.55 | |
Conservative | Felicity A. Brown | 805 | ||
Green | James C. Fleming | 225 | 9.59 | |
Registered electors | 5,899 | |||
Turnout | 2,494 | 42.28 | ||
Rejected ballots | 1 | 0.04 | ||
Labour hold | ||||
Labour hold | ||||
Party | Candidate | Votes | % | |
---|---|---|---|---|
Conservative | Jacqueline G. Harding* | 1,396 | 44.93 | |
Labour | David J. Mason | 1,283 | 41.71 | |
Conservative | Henry J. Mardon* | 1,228 | ||
Labour | Zenon Antoniou | 1,153 | ||
Green | Denise R.A. Vallance | 390 | 13.36 | |
Registered electors | 5,263 | |||
Turnout | 2,949 | 56.03 | ||
Rejected ballots | 2 | 0.07 | ||
Conservative hold | ||||
Labour gain from Conservative | ||||
Party | Candidate | Votes | % | |
---|---|---|---|---|
Labour | Eric J.C. Smythe* | 1,414 | 58.93 | |
Labour | Michael Brett | 1,377 | ||
Conservative | Stephen J. Cooper | 756 | 30.35 | |
Conservative | Henry B. Carse | 681 | ||
Green | Anthea A. Tulloch | 254 | 10.72 | |
Registered electors | 6,256 | |||
Turnout | 2,512 | 40.15 | ||
Rejected ballots | 6 | 0.24 | ||
Labour hold | ||||
Labour hold | ||||
Party | Candidate | Votes | % | |
---|---|---|---|---|
Conservative | Frank Nellis* | 1,587 | 47.25 | |
Conservative | Richard C. Stacy* | 1,527 | ||
Labour | Katherine Alexander | 1,437 | 40.94 | |
Labour | Thomas G. Oswald | 1,261 | ||
Green | Ashley J.E. Blanks | 389 | 11.81 | |
Registered electors | 6,625 | |||
Turnout | 3,374 | 50.93 | ||
Rejected ballots | 7 | 0.21 | ||
Conservative hold | ||||
Party | Candidate | Votes | % | |
---|---|---|---|---|
Conservative | Pamela J. Adams | 1,459 | 53.01 | |
Conservative | Peter G. Elvidge* | 1,395 | ||
Labour | Yasemin Brett | 598 | 22.03 | |
Labour | Douglas A. Ewen | 588 | ||
Green | Peter N. Riddington | 376 | 13.97 | |
Liberal Democrats | John E. Hill | 296 | 10.99 | |
Registered electors | 5,812 | |||
Turnout | 2,480 | 42.67 | ||
Rejected ballots | 1 | 0.04 | ||
Conservative hold | ||||
Party | Candidate | Votes | % | |
---|---|---|---|---|
Conservative | Roger D. Brooke* | 1,733 | 54.90 | |
Conservative | John R. Boast* | 1,637 | ||
Labour | Douglas Taylor | 820 | 25.71 | |
Labour | Paul A. Renny | 758 | ||
Liberal Democrats | Sheila M. Macleod | 325 | 9.94 | |
Green | Anthony W. Thomas | 290 | 9.45 | |
Liberal Democrats | Sandra R. Mason | 284 | ||
Registered electors | 5,885 | |||
Turnout | 3,066 | 52.10 | ||
Rejected ballots | 5 | 0.16 | ||
Conservative hold | ||||
Party | Candidate | Votes | % | |
---|---|---|---|---|
Conservative | Nadezda Conway* | 2,192 | 71.39 | |
Conservative | Anne M.D. Pearce* | 2,180 | ||
Labour | Ian R. Davis | 461 | 13.91 | |
Labour | Marion Rodin | 391 | ||
Liberal Democrats | Catherine G. Edwards | 274 | 8.49 | |
Liberal Democrats | Susan W. Finlay | 246 | ||
Green | Marcia L. Riddington | 190 | 6.21 | |
Registered electors | 6,680 | |||
Turnout | 3,141 | 47.02 | ||
Rejected ballots | 4 | 0.13 | ||
Conservative hold | ||||
Party | Candidate | Votes | % | |
---|---|---|---|---|
Conservative | John W.E. Jackson* | 2,260 | 66.48 | |
Conservative | John A. Wyatt* | 2,051 | ||
Labour | Roger Buckley | 805 | 23.59 | |
Labour | William H. Glover | 724 | ||
Green | Frederick W. Clark | 322 | 9.93 | |
Registered electors | 6,441 | |||
Turnout | 3,318 | 51.51 | ||
Rejected ballots | 3 | 0.09 | ||
Conservative hold | ||||
Party | Candidate | Votes | % | |
---|---|---|---|---|
Labour | Sian M. Walker* | 1,395 | 54.51 | |
Labour | Andreas Constantinides* | 1,384 | ||
Conservative | Jean B. Creber | 1,001 | 36.98 | |
Conservative | Paul A. Miller | 884 | ||
Green | Eric M. Chantler | 217 | 8.51 | |
Registered electors | 5,635 | |||
Turnout | 2,715 | 48.18 | ||
Rejected ballots | 9 | 0.33 | ||
Labour hold | ||||
Labour hold | ||||
Party | Candidate | Votes | % | |
---|---|---|---|---|
Conservative | Graham G. Eustance* | 1,938 | 56.26 | |
Conservative | Phyllis Oborn | 1,784 | ||
Labour | Finola Byrne | 890 | 26.21 | |
Labour | Alan P. Swain | 844 | ||
Liberal Democrats | Anne Dorothy Viney | 320 | 9.34 | |
Liberal Democrats | Frank H.C. Stockwell | 298 | ||
Green | Helen Aresti | 271 | 8.19 | |
Registered electors | 6,256 | |||
Turnout | 3,389 | 54.17 | ||
Rejected ballots | 4 | 0.12 | ||
Conservative hold | ||||
Party | Candidate | Votes | % | |
---|---|---|---|---|
Conservative | Terence F. Neville* | 1,583 | 49.23 | |
Conservative | Peter Perryman* | 1,496 | ||
Labour | Zena Lebow | 752 | 20.14 | |
Labour Co-op | Gladys E.M. Stanbridge | 508 | ||
Green | Ashley P.J. Backhouse | 400 | 12.79 | |
Independent | Audrey E. Kirby | 323 | 10.33 | |
Liberal Democrats | David A. Osman | 235 | 7.51 | |
Registered electors | 5,970 | |||
Turnout | 2,883 | 48.29 | ||
Rejected ballots | 4 | 0.14 | ||
Conservative hold | ||||
Party | Candidate | Votes | % | |
---|---|---|---|---|
Conservative | Andrew C. Nicholas* | 1,713 | 47.97 | |
Conservative | James E. Porter* | 1,706 | ||
Labour | Elizabeth M. Costello | 1,325 | 37.03 | |
Labour | Philip W. Manning | 1,314 | ||
Green | Liana M.E. Blanks | 288 | 8.08 | |
Liberal Democrats | Fiona J. Macleod | 285 | ||
Liberal Democrats | Eileen E. Robeson | 208 | 6.93 | |
Registered electors | 6,206 | |||
Turnout | 3,618 | 58.30 | ||
Rejected ballots | 5 | 0.14 | ||
Conservative hold | ||||
Kingston upon Thames London Borough Council is elected every four years.
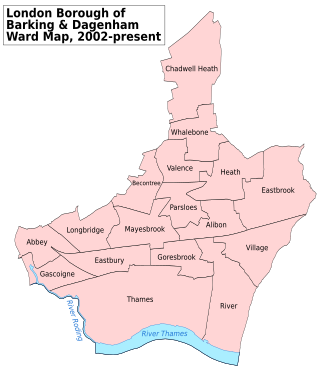
Barking and Dagenham London Borough Council in London, England is elected every four years. Since the last boundary changes in 2002, 51 councillors have been elected from 17 wards.
Bexley London Borough Council is the local authority for the London Borough of Bexley in London, England. The council is elected every four years.
Bromley London Borough Council is the local authority for the London Borough of Bromley. The council is elected every four years.
Ealing Council is the local authority for the London Borough of Ealing. It is elected every four years.
Enfield London Borough Council in London, England is elected every four years. Since the last boundary changes in 2022, 63 councillors have been elected from 25 wards.
Tower Hamlets London Borough Council, the local authority for the London Borough of Tower Hamlets, is elected every four years.
Elections for Hackney Council in London take place every four years.
Waltham Forest London Borough Council in London is elected every four years. Since the last boundary changes in 2002, 60 councillors have been elected from 20 wards, with 3 councillors per ward.
Haringey London Borough Council is the local authority for the London Borough of Haringey in London, England. The council is elected every four years.
Havering London Borough Council in London, England is elected every four years. Since the last boundary changes in 2022, 55 councillors have been elected from 20 wards.
Greenwich London Borough Council is the local authority for the Royal Borough of Greenwich in London, England. The council is elected every four years. Since the last boundary changes in 2022, 55 councillors have been elected from 23 wards.
Newham London Borough Council is elected every four years.
The 1990 Barnet Council election took place on 3 May 1990 to elect members of Barnet London Borough Council in London, England. The whole council was up for election and the Conservative party stayed in overall control of the council.
The 1990 Ealing Council election took place on 3 May 1990 to elect members of Ealing London Borough Council in London, England. The whole council was up for election and the Conservative party gained overall control of the council.
The 1990 Greenwich Council election took place on 3 May 1990 to elect members of Greenwich London Borough Council in London, England. The whole council was up for election and the Labour party stayed in overall control of the council.
The 1990 Hackney Council election took place on 3 May 1990 to elect members of Hackney London Borough Council in London, England. The whole council was up for election and the council remained controlled by Labour.
The 1990 Hammersmith and Fulham Council election took place on 3 May 1990 to elect members of Hammersmith and Fulham London Borough Council in London, England. The whole council was up for election and the Labour party stayed in overall control of the council.
The 1990 Havering Council election took place on 3 May 1990 to elect members of Havering London Borough Council in London, England. The whole council was up for election and the council stayed in no overall control.
The 1990 Hillingdon Council election tooklace on 3 May 1990 to elect members of Hillingdon London Borough Council in London, Englaland. The whole council was up for election and the Conservative Party gained overall control of the council.