2014 Barnet London Borough Council election

Last updated

2014 Barnet London Borough Council election
  2010 22 May 2014 2018  

All 63 seats to Barnet London Borough Council
32 seats needed for a majority
 First partySecond partyThird party
  No image wide.svg No image wide.svg No image wide.svg
Party Conservative Labour Liberal Democrats
Seats won32301
Seat changeDecrease2.svg7Increase2.svg9Decrease2.svg2
Popular vote38,28636,0768,037
Percentage38.6%36.4%8.1%
SwingDecrease2.svg2.2%Increase2.svg6.2%Decrease2.svg11.5%

Barnet UK local election 2014 map.svg
Map of the results of the 2014 Barnet council election. Conservatives in blue, Labour in red and Liberal Democrats in yellow.

Council control before election

Conservative Party (UK)

Council control after election

Conservative Party (UK)

The 2014 Barnet Borough Council election took place on 22 May 2014 to elect members of Barnet Council in England. [1] It took place on the same day as other local elections and it resulted in the Conservative Party holding on to overall control of the council.

Contents

Background

Before the election the Conservatives ran the council with 38 seats, compared to 22 for Labour and 3 for the Liberal Democrats. A total of 247 candidates stood in the election including a full slate of 63 each from the Conservative, Labour and Liberal Democrat parties. [2] The Green Party stood 43 candidates, while there were 9 candidates from UKIP, 5 Independents and 1 from Left Unity. Following the death of Green Party candidate Jessica Yorke, [3] the poll for Colindale ward was cancelled on 19 May and rescheduled to take place on 26 June. [4]

Election result

Barnet Local Election Result 2014 [5]
PartySeatsGainsLossesNet gain/lossSeats %Votes %Votes+/−
  Conservative 3207-753.338.638,286-2.2
  Labour 3090+945.036.436,076+6.2
  Green 00000.010.910,800+4.7
  Liberal Democrats 102-21.78.18,037-11.5
  UKIP 00000.04.84,780New
  Independent 00000.01.11,127+0.5
  Left Unity 00000.00.1107New

Results for Colindale included in table.

Ward results

Brunswick Park

Brunswick Park (3 seats) [6]
PartyCandidateVotes%±%
Labour Kathy Levine 1,951 40.9 +14.2
Labour Andreas Ioannidis* 1,944 40.7 +14.8
Conservative Lisa Rutter* 1,899 39.8 -5.1
Conservative Andreas Tambourides*1,87639.3-7.5
Labour James Rowe1,82038.1+14.6
Conservative Antonis Savvides1,74236.5-7.8
Green Howard Javes49910.4+4.9
Liberal Democrats Sandra Beeton2705.7-11.6
Liberal Democrats Jennifer Ritson2184.6-11.7
Liberal Democrats Sakura Otten1683.5-10.8
Total votes4,776
Labour gain from Conservative Swing
Labour hold Swing
Conservative hold Swing

Burnt Oak

Burnt Oak (3 seats) [6]
PartyCandidateVotes%±%
Labour Claire Farrier* 2,622 63.8 +4.8
Labour Charlie O’Macauley* 2,223 54.1 +0.3
Labour Ammar Naqvi 2,177 53.0 -5.6
Conservative Lachhya Gurung88921.6-0.3
Conservative John Connolly85420.8+0.1
Conservative Richa Karnani65115.8-3.8
Green Maggie Curati44710.9N/A
Independent Bidemi Alabi3288.0N/A
Liberal Democrats Michael Charles Roberts2867.0-6.0
Liberal Democrats Diana Iwi2425.9-8.9
Liberal Democrats Yahaya Kiyingi1523.7-9.0
Total votes4,110
Labour hold Swing
Labour hold Swing
Labour hold Swing

Childs Hill

Childs Hill (3 seats) [6]
PartyCandidateVotes%±%
Conservative Shimon Ryde 1,544 32.8 -0.9
Conservative Peter Zinkin 1,536 32.6 -0.7
Liberal Democrats Jack Cohen* 1,509 32.0 -6.2
Conservative Rohit Grover1,50031.8-0.3
Labour Andrew Smith1,46331.0+7.4
Labour Ade Ajakaiye1,40829.9+10.8
Labour Nila Patel1,38129.3+10.8
Liberal Democrats Charlotte Henry1,22225.9-11.2
Liberal Democrats Jonathan Davies1,19825.4-10.0
Green Francesco Marasco50110.6+3.9
Total votes4,712
Conservative gain from Liberal Democrats Swing
Liberal Democrats hold Swing

Colindale (delayed election)

Colindale (3 seats) [6]
PartyCandidateVotes%±%
Labour Nagus Narenthira 2,190 68.4 +10.7
Labour Gill Sargeant* 2,088 65.2 +15.0
Labour Zakia Zubairi* 2,015 62.9 +14.9
Conservative Nneka Akwaeze50115.6-5.2
Conservative John William Nicholson46614.5-6.3
Conservative Golnar Bokaei42013.1-4.9
UKIP John Jeffrey Baskin34710.8N/A
UKIP Barry Ryan3099.6N/A
UKIP Khalid Khan2688.4N/A
Liberal Democrats Daniel Estermann1334.2-15.2
Green Maggie Curati1304.1-1.9
Green Andrew John Newby1143.6-1.8
Green Francesco Marasco1083.4-1.5
Liberal Democrats Victor Peter Edward Corney902.8-13.1
Liberal Democrats Sabriye Halane Warsame872.7-10.8
Total votes3,203
Labour hold Swing
Labour hold Swing
Labour hold Swing

Coppetts

Coppetts (3 seats) [6]
PartyCandidateVotes%±%
Labour Barry Rawlings* 2,256 47.9 +10.6
Labour Pauline Coakley-Webb* 2,201 46.7 +10.9
Labour Reema Patel 2,179 46.2 +11.8
Conservative Kate Salinger*1,51732.2-3.9
Conservative Lorna Green1,35528.7-4.5
Conservative Andreas Nicolaides1,27727.1-4.0
Green Rebecca Bunting64013.6+7.1
Green Edward Bunting54411.5+1.6
Green Andrew Newby4699.9+4.4
Liberal Democrats David Bullen2184.6-14.5
Liberal Democrats Enrique Boo1974.2-12.6
Independent Mehdi Akhavan1633.5N/A
Liberal Democrats Melvyn Rees1533.2-11.5
Total votes4,714
Labour hold Swing
Labour hold Swing
Labour gain from Conservative Swing

East Barnet

East Barnet (3 seats) [6]
PartyCandidateVotes%±%
Labour Rebecca Challice 2,108 43.1 +21.2
Labour Laurie Williams 2,044 41.8 +21.4
Labour Philip Cohen 1,993 40.7 +20.5
Conservative Barry Evangeli*1,89438.7+1.8
Conservative Joanna Tambourides*1,87338.3+0.6
Conservative Robert Rams*1,82037.2+0.4
Green Roger Aitken63813.0+7.1
Green Pennie Varvarides57611.8+6.6
Green Kevin Pressland50510.3N/A
Liberal Democrats Deborah Roberts1944.0-13.6
Liberal Democrats Eileen Umbo1753.6-11.5
Liberal Democrats Joe Giltinane1733.5-11.0
Total votes4,892
Labour gain from Conservative Swing

East Finchley

East Finchley (3 seats) [6]
PartyCandidateVotes%±%
Labour Alison Moore* 2,711 57.5 +12.5
Labour Arjun Mittra* 2,565 54.4 +14.6
Labour Alon Or-Bach 2,201 46.7 +7.7
Conservative Stepan Stepanenko1,01321.5-5.6
Conservative Anshul Gupta98820.9-4.3
Conservative Alan Maund98820.9-2.5
Green Noel Lynch64013.6+4.7
Green Stephen Norman60612.8+4.8
Green David Mellows60212.8+6.3
Liberal Democrats Joyce Arram4108.7-14.9
Liberal Democrats Malcolm Davis3106.6-12.4
Liberal Democrats Millicent Watkins2485.3-11.5
Total votes4,717
Labour hold Swing
Labour hold Swing
Labour hold Swing

Edgware

Edgware (3 seats) [6]
PartyCandidateVotes%±%
Conservative Brian Gordon 2,732 61.0 +8.8
Conservative Helena Hart* 2,369 52.9 +2.5
Conservative Joan Scannell* 2,182 48.7 -0.2
Labour Julie Johnson1,18026.4-2.3
Labour Geoffrey Johnson1,15525.8+2.9
Labour Raymond Hale1,14025.5+3.0
Green Catherine Margolis47410.6+6.5
Liberal Democrats Aliza Abeles44610.0-3.2
Liberal Democrats Elias Abeles4109.2-4.7
Liberal Democrats Alexander Ollier1693.8-6.2
Total votes4,476
Conservative hold Swing

Finchley Church End

Finchley Church End (3 seats) [6]
PartyCandidateVotes%±%
Conservative Eva Greenspan* 2,571 56.4 +2.4
Conservative Graham Old* 2,284 50.1 +3.0
Conservative Daniel Thomas* 2,197 48.2 +0.2
Labour Janet Bagley1,25727.6+3.7
Labour Mike Walsh1,20126.4+5.0
Labour Mary McGuirk1,19226.2+2.9
Green Vedantha Kumar51211.2+5.0
UKIP Amir Latif3658.0N/A
Liberal Democrats Diana Darrer3056.7-6.7
Liberal Democrats Sarah Hoyle2675.9-8.8
Liberal Democrats Sheila Yarwood2224.9-6.0
Total votes4,556
Conservative hold Swing

Garden Suburb

Garden Suburb (3 seats) [6]
PartyCandidateVotes%±%
Conservative John Marshall* 2,689 59.1 +1.7
Conservative Gabriel Rozenberg 2,560 56.3 -0.6
Conservative Daniel Seal* 2,539 55.8 +2.0
Labour Nick Goldberg1,11024.4+6.3
Labour Ruth Brown1,10124.2+7.7
Labour Romin Sutherland94320.7+5.6
Green Romola De-Souza64514.2+3.9
Liberal Democrats Peter Lusher3828.4-8.6
Liberal Democrats Altan Akbiyik3587.9-12.7
Liberal Democrats Stephen Barber3477.6-7.3
Total votes4,550
Conservative hold Swing

Golders Green

Golders Green (3 seats) [6]
PartyCandidateVotes%±%
Conservative Dean Cohen* 2,423 61.4 +8.4
Conservative Melvin Cohen* 2,302 58.3 +8.7
Conservative Reuben Thompstone* 1,831 46.4 +5.5
Labour Charles Harvey1,02425.9+2.3
Labour Margot Robinson90022.8+0.8
Labour Sue O`Halloran88522.4-1.1
Green Charlene Concepcion3699.3+5.1
Green Adele Ward3308.4+4.5
Green Louisa Radice3148.0+4.2
Liberal Democrats Ruth Cohen2466.2-8.2
Liberal Democrats Honora Morrissey1564.0-7.4
Liberal Democrats Eddie Eatwell1263.2-10.7
Total votes3,948
Conservative hold Swing

Hale

Hale (3 seats) [6]
PartyCandidateVotes%±%
Conservative Tom Davey* 2,178 43.8 +0.4
Conservative Hugh Rayner* 2,155 43.4 +2.7
Labour Kitty Lyons 2,019 40.6 +5.9
Conservative Elliot Simberg2,01040.5-2.8
Labour Pierre Jeanmaire1,99440.1+10.9
Labour Roger Lyons1,87037.6+12.1
Green Nicolas Ceasar53610.8+6.5
Liberal Democrats Michael Goodman3356.7-9.2
Liberal Democrats James Creighton2976.0-10.4
Liberal Democrats Geoffrey Jacobs2434.9-8.0
Total votes4,968
Conservative hold Swing
Labour gain from Conservative Swing

Hendon

Hendon (3 seats) [6]
PartyCandidateVotes%±%
Conservative Anthony Finn* 2,128 51.0 -0.6
Conservative Mark Shooter* 2,087 50.1 -1.8
Conservative Maureen Braun* 2,015 48.3 +0.2
Labour David Beere1,19128.6+3.4
Labour Gerrard Roots1,16527.9+1.8
Labour Ruth Montague1,11326.7+1.8
UKIP Barry Ryan42010.1N/A
Green Andy Monaghan3909.4+4.5
Liberal Democrats Jason Moleman2806.7-5.7
Liberal Democrats Henryk Feszczur2435.8-7.7
Liberal Democrats Charles Wakefield1804.3-7.5
Total votes4,169
Conservative hold Swing

High Barnet

High Barnet (3 seats) [6]
PartyCandidateVotes%±%
Conservative Wendy Prentice* 2,171 41.3 -3.3
Conservative David Longstaff* 2,161 41.1 -0.8
Conservative Bridget Perry* 2,152 41.0 -3.2
Labour Phil Harding1,20923.0+7.3
Labour Marianne Haylett1,18822.6+6.8
Labour Paul Levine1,05220.0+5.5
Green Phil Fletcher97318.5+10.1
Green A. M. Poppy92217.5+10.1
Liberal Democrats Duncan MacDonald85916.3-15.6
Green Valerie Lawson82815.8+10.4
Liberal Democrats Sean Hooker70513.4-17.6
Liberal Democrats Jane Gibson63112.0-12.6
Total votes5,255
Conservative hold Swing

Mill Hill

Mill Hill (3 seats) [6]
PartyCandidateVotes%±%
Conservative John Hart* 2,058 41.9 -6.1
Conservative Val Duschinsky 1,936 39.4 -3.1
Conservative Sury Khatri* 1,864 38.0 -5.1
Labour Deborah Handley1,26425.8+8.1
Labour Sian John1,23125.1+8.1
Labour Colin Francome1,22925.0+10.2
UKIP George Jones73114.9N/A
Liberal Democrats Jeremy Davies72114.7-15.6
Liberal Democrats Alasdair Hill51210.4-17.9
Green Barbara Rustin49510.1+5.4
Liberal Democrats Michael Lees4709.6-17.7
Independent Rolf Clayton3717.6N/A
Green Luke Ilott2825.7+2.7
Green David Williams2284.6+0.9
Total votes4,908
Conservative hold Swing

Oakleigh

Oakleigh (3 seats) [6]
PartyCandidateVotes%±%
Conservative Brian Salinger* 1,935 41.6 -7.8
Conservative Sachin Rajput* 1,899 40.8 -6.0
Conservative Stephen Sowerby* 1,826 39.2 -7.3
Labour Pamela Bradbury1,11023.9+1.4
Labour Rachel Barker1,07523.1+1.1
Labour Parmodh Sharma93620.1-0.4
UKIP Victor Kaye49810.7N/A
Green Richard Cutting4369.4N/A
Green Daniel Newby3708.0N/A
Green Gideon Shapiro3176.8N/A
Liberal Democrats Jon Finlayson2395.1-17.1
Liberal Democrats Gerard Fitzgerald1884.0-16.0
Liberal Democrats Leonie Hodge1874.0-15.1
Left Unity Philip Clayton1072.3-4.8
Total votes4,654
Conservative hold Swing

Totteridge

Totteridge (3 seats) [6]
PartyCandidateVotes%±%
Conservative Alison Cornelius* 2,210 52.2 -1.3
Conservative Richard Cornelius* 2,147 50.7 -0.4
Conservative Caroline Stock 2,090 49.3 -3.7
Labour Deborah Heneghan1,04824.7+3.7
Labour Donald Lyven91221.5+2.4
Labour Robert Persad79818.8+0.1
UKIP Keith Fraser49411.7N/A
Green Ash Auld46411.0+3.6
Green Richard Parkinson3638.6+2.3
Liberal Democrats Janice Turner3207.6-11.3
Independent Brian Coleman*2656.3-46.7
Liberal Democrats Michael Cole2566.0-10.5
Liberal Democrats Sheila Gottsche2125.0-10.3
Independent George Linskey1373.2N/A
Total votes4,237
Conservative hold Swing

Underhill

Underhill (3 seats) [6]
PartyCandidateVotes%±%
Labour Paul Edwards 2,078 42.3 +4.3
Labour Amy Trevethan 1,950 39.7 +9.9
Labour Tim Roberts 1,889 38.4 +7.4
Conservative James Barton1,63733.3-2.9
Conservative Rowan Turner*1,42929.1-7.7
Conservative Michael Subramaniyam1,26425.7-10.2
UKIP John Baskin1,01620.7N/A
Green Dawn Laughton55011.2N/A
Green Gina Theodorou52510.7+1.5
Green Solomon Natelson3447.0+0.7
Liberal Democrats Alexander Gilbert2324.7-14.4
Liberal Democrats Maria Christine Manalo1703.5-15.2
Liberal Democrats Jonty Stern 1623.3-14.6
Total votes4,918
Labour hold Swing
Labour gain from Conservative Swing

West Finchley

West Finchley (3 seats) [6]
PartyCandidateVotes%±%
Labour Ross Houston* 2,214 50.0 +9.8
Labour Jim Tierney* 2,141 48.3 +8.3
Labour Kath McGuirk* 2,113 47.7 +8.8
Conservative Shaun Dias1,36730.9+0.9
Conservative Myles Longfield1,29229.2-2.8
Conservative Ajantha Tennakoon1,06724.1-5.4
Green Nina Owen55012.4+0.6
Green Tim Riley4409.9N/A
UKIP Ted Anderson4079.2N/A
Liberal Democrats Rita Landeryou2625.9-12.9
Liberal Democrats John Chalmers2385.4-10.9
Liberal Democrats Ronald Finlay2064.7-15.0
Total votes4,430
Labour hold Swing
Labour hold Swing
Labour hold Swing

West Hendon

West Hendon (3 seats) [6]
PartyCandidateVotes%±%
Labour Adam Langleben 1,794 42.3 -0.3
Labour Devra Kay 1,769 41.7 +4.3
Labour Agnes Slocombe* 1,747 41.2 -0.1
Conservative Saira Hettiarachchi1,48835.1-1.4
Conservative Brian Mann1,45934.4+0.5
Conservative Ansuya Sodha*1,35732.0-5.4
UKIP Adrian Murray-Leonard44510.5N/A
Green Ben Samuel3077.2+1.5
Green Sara Bunting3007.1+2.5
Green Miriam Green2926.9+1.8
Liberal Democrats Pearl Emery1724.1-6.8
Liberal Democrats James Emery1633.8-8.1
Liberal Democrats David Ive1633.8-5.7
Total votes4,244
Labour hold Swing
Labour hold Swing
Labour hold Swing

Woodhouse

Woodhouse (3 seats) [6]
PartyCandidateVotes%±%
Labour Anne Hutton* 2,348 47.4 +7.4
Labour Geof Cooke* 2,287 46.1 +6.8
Labour Alan Schneiderman* 2,067 41.7 +5.9
Conservative Mark Higgins1,44229.1-3.6
Conservative Mukesh Depala1,35027.2-4.2
Conservative Nurul Alam1,31826.6-1.9
Green Diane Burstein60412.2+8.0
UKIP Karl Khan55111.1N/A
Green David Burns54311.0+4.0
Green Gardi Vaswani4719.5+4.2
Liberal Democrats Ian Murphy2184.4-12.3
Liberal Democrats Pauline McKinnell2114.3-15.3
Liberal Democrats Lisa Smith1933.9-13.6
Total votes4,958
Labour hold Swing
Labour hold Swing
Labour hold Swing

By-elections between 2014 and 2018

Underhill

Underhill by-election, 5 May 2016
PartyCandidateVotes%±%
Labour Jess Brayne 2,314 41.4 +1.7
Conservative Lesley Evans1,97935.4+2.1
UKIP Barry Ryan4598.2-12.5
Liberal Democrats Duncan MacDonald4528.1+3.4
Green Phil Fletcher3876.9-4.3
Majority3356.0-0.4
Total votes5,591
Labour hold Swing

The by-election was called following the resignation of Cllr. Amy Trevethan.

Related Research Articles

<span class="mw-page-title-main">2006 Barnet London Borough Council election</span> 2006 local election in England, UK

The 2006 Barnet Borough Council election took place on 4 May 2006 to elect members of Barnet London Borough Council in London, England. The whole council was up for election and the Conservative Party stayed in overall control of the council.

<span class="mw-page-title-main">2006 Colchester Borough Council election</span>

The 2006 Colchester Borough Council election took place on 4 May 2006 to elect members of Colchester Borough Council in Essex, England. One third of the council was up for election and the council stayed under no overall control.

<span class="mw-page-title-main">2008 Solihull Metropolitan Borough Council election</span>

The 2008 Solihull Metropolitan Borough Council election took place on 1 May 2008 to elect members of Solihull Metropolitan Borough Council in the West Midlands, England. One third of the council was up for election and the Conservative Party gained overall control of the council from no overall control.

<span class="mw-page-title-main">2010 Barnet London Borough Council election</span> 2010 local election in England, UK

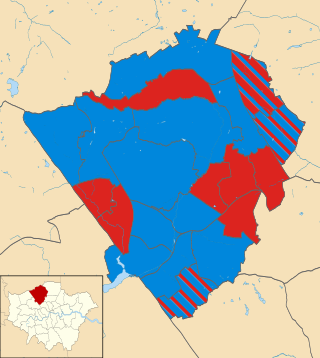
The 2010 Barnet Borough Council election took place on 6 May 2010 to elect members of Barnet London Borough Council in London, England. The whole council was up for election and the Conservative Party stayed in overall control of the council.

The 1999 Pendle Borough Council election took place on 6 May 1999 to elect members of Pendle Borough Council in Lancashire, England. One third of the council was up for election and the Liberal Democrats lost overall control of the council to no overall control.

The 1999 Sandwell Metropolitan Borough Council election took place on 6 May 1999 to elect members of Sandwell Metropolitan Borough Council in the West Midlands, England. One third of the council was up for election and the Labour Party stayed in overall control of the council.

<span class="mw-page-title-main">2007 Maidstone Borough Council election</span>

The 2007 Maidstone Borough Council election took place on 3 May 2007 to elect members of Maidstone Borough Council in Kent, England. One third of the council was up for election and the council stayed under no overall control.

<span class="mw-page-title-main">2006 Eastbourne Borough Council election</span>

The 2006 Eastbourne Council election took place on 4 May 2006 to elect members of Eastbourne Borough Council in East Sussex, England. One third of the council was up for election and the Conservative Party stayed in overall control of the council.

<span class="mw-page-title-main">2014 London local elections</span>

There were local government elections in London on Thursday 22 May 2014. All councillor seats on the 32 London borough councils were up for election. The electorates of Hackney, Lewisham, Newham and Tower Hamlets also elected their executive mayors, who operate in place of council leaders in those boroughs. Ward changes took place in Hackney, Kensington and Chelsea, and Tower Hamlets, which reduced the total number of councillors by 10 to 1,851. Both the mayoral and councillor elections are four-yearly.

<span class="mw-page-title-main">2008 Colchester Borough Council election</span>

The 2008 Colchester Borough Council election took place on 1 May 2008 to elect members of Colchester Borough Council in Essex, England. One third of the council was up for election and the Conservative party lost overall control of the council to no overall control.

The 2014 Colchester Borough Council election took place on 22 May 2014 to elect members of Colchester Borough Council in Essex, England. One third of the council was up for election and the council stayed under no overall control.

<span class="mw-page-title-main">2014 Brent London Borough Council election</span> 2014 local election in England, UK

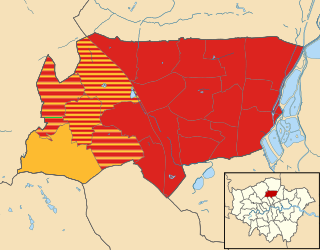
The 2014 Brent London Borough Council election took place on 22 May 2014 to elect members of Brent London Borough Council in London, England. The whole council was up for election and the Labour Party stayed in overall control of the council.

<span class="mw-page-title-main">2018 Lambeth London Borough Council election</span>

The 2018 Lambeth London Borough Council election took place on 3 May 2018 alongside other local elections in London, to elect members of Lambeth London Borough Council in England. The election saw Labour remain in control of Lambeth Council with a slightly reduced majority, winning over 90% of the seats. The Green Party achieved its best-ever result in the borough, winning five seats and becoming the official opposition and the largest Green group in London.

<span class="mw-page-title-main">2018 Barnet London Borough Council election</span> 2018 local election in England, UK

The 2018 Barnet Borough Council election took place on 3 May 2018 to elect members of Barnet Borough Council in England. It took place on the same day as other local elections in 2018. In the last election, the Conservatives won control of the council with 32 seats, compared to 30 for Labour and 1 for the Liberal Democrats. On 15 March 2018, following the resignation of a Conservative councillor, the council was in a state of no overall control. The election on 3 May 2018 saw the Conservatives take back overall control with a majority of 13.

<span class="mw-page-title-main">2018 Calderdale Metropolitan Borough Council election</span>

The 2018 Calderdale Metropolitan Borough Council election took place on 3 May 2018 to elect members of Calderdale Metropolitan Borough Council in England. This was on the same day as other local elections. One councillor was elected in each ward for a four-year term so the councillors elected in 2018 last stood for election in 2014. Each ward is represented by three councillors, the election of which is staggered, so only one third of the councillors were elected in this election. Before the election there was no overall control with a minority Labour administration. Following the election Labour, having gained one councillor, was still two councillors away from a majority so it remained no overall control.

<span class="mw-page-title-main">2022 London local elections</span>

The 2022 London local elections took place on 5 May 2022, as part of the 2022 United Kingdom local elections. All London borough councillor seats were up for election. Mayoral elections took place in Hackney, Lewisham, Newham and Tower Hamlets, with Croydon electing a mayor for the first time following a local referendum in October 2021.

<span class="mw-page-title-main">2021 Calderdale Metropolitan Borough Council election</span>

The 2021 Calderdale Metropolitan Borough Council election took place on 6 May 2021 to elect members of Calderdale Metropolitan Borough Council in England. This was on the same day as other local elections. One-third of the seats were up for election.

<span class="mw-page-title-main">2022 Barnet London Borough Council election</span> 2022 local election in Barnet

The 2022 Barnet London Borough Council election took place on 5 May 2022, alongside local elections in the other London boroughs and elections to local authorities across the United Kingdom. All 63 members of Barnet London Borough Council were elected. The Labour Party took overall control, winning 41 of the seats to the Conservative Party's 22. This was the first time Labour had won the council outright; previously, the Conservatives had always won the most seats, usually with an overall majority.

<span class="mw-page-title-main">2022 Haringey London Borough Council election</span> 2022 local election in Haringey

The 2022 Haringey London Borough Council election took place on 5 May 2022. All 57 members of Haringey London Borough Council were elected. The elections took place alongside local elections in the other London boroughs and elections to local authorities across the United Kingdom.

<span class="mw-page-title-main">2022 Calderdale Metropolitan Borough Council election</span> 2022 local election in Calderdale

The 2022 Calderdale Metropolitan Borough Council election took place on 5 May 2022 to elect members of Calderdale Metropolitan Borough Council in England. One third of councillors — 17 out of 51, plus one vacancy in Ovenden ward were up for election. The election took place alongside other local elections across the United Kingdom.

References

  1. "England council results". BBC News. Retrieved 23 May 2014.
  2. "Statement of persons nominated - local and European elections, May 2014". London Borough of Barnet. Archived from the original on 29 May 2014. Retrieved 28 May 2014.
  3. O’Brien, Daniel (20 May 2014). "Colindale poll cancelled after Green party candidate dies". Barnet and Whetstone Press. Retrieved 28 May 2014.
  4. O'Neill, Natalie (21 May 2014). "New date announced for Colindale ward election". Times Series. Retrieved 28 May 2014.
  5. "Local Elections Archive Project - 2014 - Barnet".
  6. 1 2 3 4 5 6 7 8 9 10 11 12 13 14 15 16 17 18 19 20 21 "Results". London Borough of Barnet. Archived from the original on 4 March 2016. Retrieved 27 May 2014.