2006 Merton London Borough Council election

Last updated

2006 Merton London Borough Council election
  2002 4 May 2006 2010  

All 60 council seats on Merton London Borough Council
Turnout42.9% (Increase2.svg8.6%)
 First partySecond partyThird party
 
Party Conservative Labour Merton Park Residents
Last election25 seats, 38.0%32 seats, 37.1%3 seats, 3.4%
Seats won30273
Seat changeIncrease2.svg5Decrease2.svg5Steady2.svg
Popular vote72,55956,6644,815
Percentage44.6%34.8%3.0% [1]
SwingIncrease2.svg6.6%Decrease2.svg2.3%Decrease2.svg0.4%

Merton London UK local election 2006 map.svg
Map of the results of the 2006 Merton council election. Conservatives in blue, Labour in red and Merton Park Ward Residents Association in white.

Council leader before election

Andrew Judge
Labour

Council leader after election

David Williams
Conservative

Elections for the London Borough of Merton were held on 4 May 2006. This was on the same day as other local elections in England. [2]

Contents

The Conservatives became the largest party in Merton, forming a minority administration. The incumbent Labour majority administration was defeated.

Results

The Conservatives gained five seats, becoming the largest party in Merton and defeating the incumbent majority Labour administration. However, the Conservatives fell one seat short of a majority, so they established a minority administration under no overall control.

The Merton Park Ward Residents' Association maintained its three councillors in Merton Park.

In terms of seat changes, the Conservatives gained three councillors from Labour in Abbey and one each from Labour in the wards of Dundonald and Trinity. [2]

Merton Local Election Result 2006 [3]
PartySeatsGainsLossesNet gain/lossSeats %Votes %Votes+/−
  Conservative 3050Increase2.svg550.0%44.6%72,559Increase2.svg6.6%
  Labour 2705Decrease2.svg545.0%34.8%56,664Decrease2.svg2.3%
  Merton Park Residents 30005.0%3.0%4,815Decrease2.svg0.4%
  Liberal Democrats 00000%12.0%19,493Increase2.svg0.9%
  Green 00000%3.8%6,226Decrease2.svg3.5%
  BNP 00000%0.7%1,092Increase2.svg0.5%
 Pensions Action Alliance00000%0.5%788n/a
  UKIP 00000%0.3%457Decrease2.svg0.4%
  Independent 00000%0.4%583n/a


Results by Ward

Abbey

Abbey
PartyCandidateVotes%±%
Conservative Diane Neil Mills 1,297 41.2 +8.7
Conservative Marc Hanson 1,282 40.7 +8.8
Conservative Henry Nelless 1,214 38.5 +10.5
Labour Susan Assinen*1,14736.4-3.5
Labour Michael Brunt1,08734.5-5.3
Labour Laxmi Attawar1,07434.1-2.9
Liberal Democrats Pauline Barry56618.0+1.4
Liberal Democrats John Houilihan47014.9-0.8
Green Benjamin Walsh44314.1+2.0
Liberal Democrats David Willis41213.1-0.4
Turnout 3,15044.1+16.7
Conservative gain from Labour Swing

Cannon Hill

Cannon Hill
PartyCandidateVotes%±%
Conservative William Brierly 1,778 54.6 +8.8
Conservative Deborah Shears* 1,748 53.7 +6.0
Conservative Brian Lewis-Lavender 1,681 51.7 +8.1
Labour Christopher Houghton81425.0-5.5
Labour Henry Macauley81225.0-2.4
Labour Motiur Rahman67820.8-6.0
Liberal Democrats Mary O'Herlihy Nixon45013.8+1.8
Liberal Democrats Nelson Menezes42313.0+1.6
Liberal Democrats Christopher Oxford41612.8+1.9
Pensioners Action AllianceMichael Fitzgerald38311.8N/A
Turnout 3,25447.1+4.2
Conservative hold Swing

Colliers Wood

Colliers Wood
PartyCandidateVotes%±%
Labour Nicholas Draper* 1,713 50.0 -1.6
Labour Sheila Knight* 1,625 47.5 -3.3
Labour George Reynolds* 1,577 46.1 -2.7
Green Thomas Walsh1,22235.7-0.8
Green Rebecca Shingleton1,15233.6+2.0
Green Richard Bence1,06831.2+2.0
Conservative Philip Beard39811.6+4.6
Conservative Olivia Cooper37410.9+4.8
Conservative Eugene Byrne35310.3+4.7
Liberal Democrats James McKenna2627.7N/A
Turnout 3,42449.0+11.2
Labour hold Swing
Labour hold Swing
Labour hold Swing

Cricket Green

Cricket Green
PartyCandidateVotes%±%
Labour Thomas Munn* 1,442 54.3 -0.8
Labour Russell Makin* 1,377 51.8 -1.4
Labour Judy Saunders* 1,361 51.2 +3.1
Conservative Frederick Day87532.9+6.4
Conservative Sarah McAlister76728.9+3.7
Conservative Liam Staff70926.7+3.8
Liberal Democrats Nicholas Pizey44816.9+1.6
Turnout 2,65637.4+7.1
Labour hold Swing
Labour hold Swing
Labour hold Swing

Dundonald

Dundonald
PartyCandidateVotes%±%
Conservative Corinna Edge* 1,328 42.7 +8.2
Conservative Denise March 1,295 41.7 +6.2
Conservative David Edge 1,272 40.9 +8.8
Liberal Democrats Kirsty Armstrong74023.8+3.4
Labour Elizabeth Daughters66421.4-12.5
Labour Stan Anderson66421.4-12.3
Liberal Democrats Anthony Fairclough64820.8+6.1
Labour Wayne Busbridge64020.6-12.1
Green David Bezkorowajny60119.3+4.5
Green Jennifer Young53617.2N/A
Liberal Democrats Andrew Falconer52516.9+2.5
Turnout 3,10945.5+11.9
Conservative hold Swing
Conservative gain from Labour Swing

Figge's Marsh

Figge's Marsh
PartyCandidateVotes%±%
Labour Andrew Judge* 1,549 57.3 +8.7
Labour Agatha Akyigyina 1,512 55.9 +4.8
Labour Geraldine Stanford* 1,437 53.2 -1.2
Conservative Gordon Southcott64223.8-1.2
Conservative John Telford63523.5+1.3
Conservative Jenny Thomas61522.8+0.8
Liberal Democrats Elaine Patton39514.6-2.2
UKIP Graham Mills2328.6N/A
Turnout 2,70338.3+9.7
Labour hold Swing
Labour hold Swing
Labour hold Swing

Graveney

Graveney
PartyCandidateVotes%±%
Labour Linda Kirby* 1,505 58.3 -0.6
Labour John Dehaney* 1,500 58.1 +4.6
Labour Gregory Udeh 1,233 47.8 -10.9
Conservative Jeffrey Gunn67526.2+4.7
Conservative June Hayles64625.0+4.2
Conservative Gary Pritchard59022.9+2.9
Liberal Democrats Benedict Fletcher53420.7+4.8
Turnout 2,58037.3+7.7
Labour hold Swing
Labour hold Swing
Labour hold Swing

Hillside

Hillside
PartyCandidateVotes%±%
Conservative Jeremy Bruce 1,400 58.9 +6.8
Conservative David Williams* 1,353 56.9 +4.9
Conservative David Simpson* 1,348 56.7 +7.2
Liberal Democrats Juliet Boyd43918.5±0.0
Liberal Democrats Joan Pyke-Lees40116.9-2.6
Labour Christine Bickerstaff39616.7-5.7
Liberal Democrats Simon Burall37515.8-2.5
Green Nicholas Robins35114.8+2.5
Labour Peter McGinity34614.6-6.6
Labour Farmida Bi 31413.2-6.7
UKIP James Stewart893.7N/A
Turnout 2,37636.2+6.0
Conservative hold Swing

Lavender Fields

Lavender Fields
PartyCandidateVotes%±%
Labour Mark Betteridge 1,142 54.9 -1.5
Labour Mark Allison* 1,131 54.3 -1.3
Labour Edith Macauley* 1,050 50.4 +2.0
Conservative Stewart MacDonald52025.0+0.9
Conservative Thomas Lazur44921.6-1.8
Conservative Christina MacPherson44721.5-1.3
Green Michael Dees43520.9+6.6
Liberal Democrats Jonathan Holloway37718.1+3.7
Turnout 2,08231.5+7.5
Labour hold Swing
Labour hold Swing
Labour hold Swing

Longthornton

Longthornton
PartyCandidateVotes%±%
Labour Stephen Austin* 1,687 53.5 +3.8
Labour David Chung* 1,651 52.4 +5.7
Labour Leighton Veale* 1,454 46.1 +5.5
Conservative Charles Jenkins1,17037.1-1.7
Conservative Sarah Newton 1,13636.0-1.8
Conservative Philip Lenon1,11335.3-2.1
Liberal Democrats Celia Lee38112.1+0.3
Pensions Action AllianceDavid Kay-Kreizman2196.9
Turnout 3,15347.5+11.7
Labour hold Swing
Labour hold Swing
Labour hold Swing

Lower Morden

Lower Morden
PartyCandidateVotes%±%
Conservative Maurice Groves* 1,809 63.0 +9.2
Conservative Barbara Mansfield 1,781 62.1 +15.9
Conservative Ronald Wilson* 1,664 58.0 +11.9
Labour Terence Daniels71124.8-1.8
Labour Mark Inger68223.8-0.5
Labour Michelle McNicol58720.5-0.5
Liberal Democrats Lina Akbar40214.0+0.5
Turnout 2,87043.3+3.9
Conservative hold Swing

Merton Park

Merton Park
PartyCandidateVotes%±%
Merton Park Residents Karin Forbes 1,626 48.9 -5.3
Merton Park Residents Peter Southgate* 1,619 48.7 -2.7
Merton Park Residents Krysia Wiliams 1,570 47.3 -3.9
Conservative Simon Hooberman1,15934.9+7.2
Conservative Simon Manara1,13934.3+7.9
Conservative John Richardson1,12233.8+7.9
Labour Richard Nichols37011.1-3.7
Labour Carl Linkson3189.6-3.9
Labour Christopher Ostrowski2999.0-3.8
Liberal Democrats Maximilian Camplin2788.4N/A
UKIP Andrew Mills1364.1-0.5
Turnout 3,32248.9+7.1
Merton Park Residents hold Swing

Pollards Hill

Pollards Hill
PartyCandidateVotes%±%
Labour Martin Whelton* 1,351 49.4 +2.4
Labour Zenia Squires-Jamison 1,321 48.3 -5.1
Labour Richard Williams 1,223 44.7 -8.1
Conservative Steven Abrahams1,09640.1+8.5
Conservative Richard Hilton96235.2+6.3
Conservative Raymond Tindle91533.5+5.9
Liberal Democrats Iain Dysart35112.8+1.0
Turnout 2,73538.2+6.5
Labour hold Swing
Labour hold Swing
Labour hold Swing

Ravensbury

Ravensbury
PartyCandidateVotes%±%
Labour Stephen Alambritis* 1,311 44.0 -3.1
Labour Philip Jones* 1,276 42.8 -7.0
Labour Peter McCabe* 1,204 40.4 -7.4
Conservative Thomas Cheetham1,10637.1+6.4
Conservative Margaret Groves1,01033.9+5.5
Conservative Adrian Roberts90530.4+2.7
BNP David Clarke49316.5N/A
Liberal Democrats Violet Jennings43614.6-3.5
Turnout 2,98044.3+15.3
Labour hold Swing
Labour hold Swing
Labour hold Swing

Raynes Park

Raynes Park
PartyCandidateVotes%±%
Conservative Margaret Brierly* 1,745 59.7 +10.3
Conservative Linda Scott 1,682 57.6 +12.4
Conservative Roderick Scott 1,640 56.1 +13.0
Liberal Democrats Julie Barnes57819.8-11.1
Labour Stephen Spence50117.2+1.1
Labour Brian Paul48916.7+0.7
Liberal Democrats Christopher Eglington46215.8-13.3
Liberal Democrats Nazir Malik43014.7-9.2
Labour Gladstone Dosunmu42014.4-0.7
Green Emma Wyatt-King41814.3+5.5
Turnout 2,92142.2+3.7
Conservative hold Swing

St Helier

St Helier
PartyCandidateVotes%±%
Labour Maxi Martin* 1,347 43.2 -1.0
Labour Dennis Pearce* 1,246 39.9 -4.8
Labour Patricia Lewis 1,196 38.3 -0.9
Conservative Christopher McLaughlin97431.2+6.4
Conservative David Shellhorn93129.8+5.6
Conservative Alexander van Ingen77824.9+1.1
BNP John Clarke59919.2+5.1
Independent Michael Spacey*58318.7-20.5
Liberal Democrats Alastair Irvine43013.8-1.3
Turnout 3,12146.7+14.2
Labour hold Swing
Labour hold Swing
Labour hold Swing

Trinity

Trinity
PartyCandidateVotes%±%
Conservative David Dean 1,454 51.7 +14.0
Conservative Krystal Miller 1,444 51.3 +13.9
Conservative Simon Withey 1,366 48.5 +12.0
Labour Andrew Coles*91432.5-4.0
Labour Christopher Magee79828.4-7.7
Labour Syed Rivzi75726.9-5.2
Liberal Democrats Sally Harlow49817.7+3.1
Liberal Democrats Simon Gilhooley49717.7+4.0
Liberal Democrats Richard Tibbetts44215.7+3.1
Turnout 2,81441.0+7.9
Conservative hold Swing
Conservative gain from Labour Swing

Village

Village
PartyCandidateVotes%±%
Conservative Samantha George* 2,426 80.4 +12.0
Conservative John Bowcott* 2,414 80.0 +10.2
Conservative Richard Chellew 2,358 78.2 +8.2
Liberal Democrats Anne Blanchard35711.8-0.4
Liberal Democrats Claire Glasgow2859.4-2.6
Labour William Bottriell2799.3-4.2
Liberal Democrats Andrew Harding2648.8-2.1
Labour Richard Taylor2167.2-5.5
Labour Anil Ohri2036.7+5.9
Turnout 3,01647.5+9.7
Conservative hold Swing

West Barnes

West Barnes
PartyCandidateVotes%±%
Conservative Gillian Lewis-Lavender* 1,578 45.9 +2.4
Conservative Angela Caldara* 1,517 44.2 +4.1
Conservative Jonathan Ward 1,453 42.3 -0.3
Liberal Democrats Mary-Jane Jeanes1,37340.0+1.8
Liberal Democrats Helen Herd1,31738.3+5.2
Liberal Democrats Peter Taylor1,22635.7+4.7
Labour Torbjorn Anderson45813.3-3.6
Labour Daniel Connellan44713.0-2.3
Labour Thomas Searle38611.2-1.9
Pensions Action AllianceGeoffrey Smith1865.4N/A
Turnout 3,43549.8+9.7
Conservative hold Swing

Wimbledon Park

Wimbledon Park
PartyCandidateVotes%±%
Conservative Oonagh Moulton* 1,683 57.5 +21.2
Conservative Stephen Kerin 1,682 57.4 +19.6
Conservative Tariq Ahmad* 1,650 56.4 +21.3
Labour Michael Goodman61821.1-5.4
Labour Tony Mendes60320.6-2.4
Liberal Democrats Helen Carter59720.4+11.3
Labour Masood Ahmed55118.8-2.5
Liberal Democrats Edward Furse51017.4+9.0
Liberal Democrats Richard Ladmore49817.0N/A
Turnout 2,92841.7+1.1
Conservative hold Swing

Related Research Articles

Wimbledon (UK Parliament constituency) Parliamentary constituency in the United Kingdom, 1885 onwards

Wimbledon is a constituency represented in the House of Commons of the UK Parliament. Since 2005, the seat has been represented by Stephen Hammond of the Conservatives.

Streatham (UK Parliament constituency) Parliamentary constituency in the United Kingdom, 1918 onwards

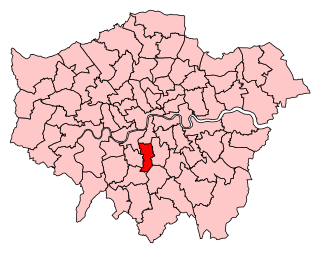
Streatham is a constituency represented in the House of Commons of the UK Parliament since 2019 by Bell Ribeiro-Addy of the Labour Party.

Croydon London Borough Council elections

Elections for the Council in the London Borough of Croydon are held every four years to elect 70 councillors. At the last elections, which were held in May 2018, 29 Conservative councillors and 41 Labour councillors were elected, providing a Labour majority of twelve seats.

Merton London Borough Council elections Political party in the United Kingdom

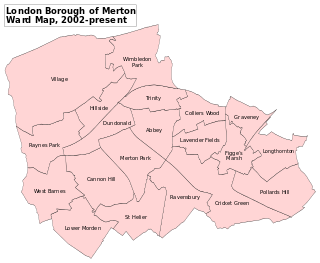
Merton London Borough Council in London, England is elected every four years; it has administrative control over the London Borough of Merton.

Elections for the London Borough of Merton were held on 7 May 1998 to elect members of Merton London Borough Council in London, England. This was on the same day as other local elections in England and a referendum on the Greater London Authority; in the latter, Merton voted in favour of creating the Greater London Authority by 72.2% on a 37.6% turnout.

2010 Merton London Borough Council election

Elections for the London Borough of Merton were held on 6 May 2010. This was on the same day as other local elections in England and a national general election.

Merton London Borough Council

Merton London Borough Council is the local authority for the London Borough of Merton in Greater London, England. It is one of the 32 councils that form Greater London.

2008 Leeds City Council election

The 2008 Leeds City Council election took place on Thursday 1 May 2008 to elect members of Leeds City Council in England.

2017 Scottish local elections

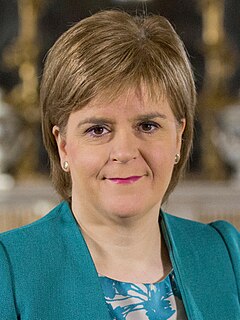
The 2017 Scottish local elections were held on Thursday 4 May, in all 32 local authorities. The SNP retained its position as the largest party in terms of votes and councillors, despite suffering minor losses. The Conservatives made gains and displaced Labour as the second largest party, while the Liberal Democrats suffered a net loss of councillors despite increasing their share of the vote. Minor parties and independents polled well; and independent councillors retained majority control over the three island councils. For the first time since the local government reforms in 1995, all mainland councils fell under no overall control.

2014 Merton London Borough Council election

Elections for the London Borough of Merton were held on 22 May 2014 to elect members of Merton London Borough Council in England. This was on the same day as other local elections in England and an election to the European Parliament.

2014 Calderdale Metropolitan Borough Council election

The 2014 Calderdale Metropolitan Borough Council election took place on 22 May 2014 to elect members of Calderdale Metropolitan Borough Council in England. This was on the same day as local elections across the United Kingdom and a European election. One councillor was elected in each of the 17 wards for a four-year term. There are three councillors representing each ward elected on a staggered basis so one third of the councillor seats were up for re-election. The seats had previously been contested in 2010 which was held in conjunction with a general election. The turnout was significantly lower in 2014 than in 2010 which is not unusual when comparing local elections that coincide with general elections to ones that do not. Prior to the election Labour was the largest party in the council with 21 out of 51 seats, 5 seats short of an overall majority. After the election there was no overall control of the council. Labour had 25 seats, only one short of a majority and so Labour continued to operate a minority administration.

Elections for the London Borough of Merton were held on 4 May 1978 to elect members of Merton London Borough Council in London, England. This was on the same day as other local elections in England and Scotland.

Elections for the London Borough of Merton were held on 6 May 1982 to elect members of Merton London Borough Council in London, England. This was on the same day as other local elections in England and Scotland.

Elections for the London Borough of Merton were held on 3 May 1990 to elect members of Merton London Borough Council in London, England. This was on the same day as other local elections in England and Scotland.

Elections for the London Borough of Merton were held on 5 May 1994 to elect members of Merton London Borough Council in London, England. This was on the same day as other local elections in England.

Leonie Cooper British Labour Co-op politician

Leonie Alison Cooper is a British Labour & Co-operative Party politician. Since May 2016 she has represented Merton and Wandsworth on the London Assembly. She has served as a Councillor on the Wandsworth London Borough Council since 2006, representing Latchmere 2006–10 and Furzedown ward from 2010 onwards.

2018 Lambeth London Borough Council election

The 2018 Lambeth London Borough Council election took place on 3 May 2018 alongside other local elections in London, to elect members of Lambeth London Borough Council in England. The election saw Labour remain in control of Lambeth Council with a slightly reduced majority, winning over 90% of the seats. The Green Party achieved its best-ever result in the borough, winning five seats and becoming the official opposition and the largest Green group in London.

2002 Merton London Borough Council election

Elections for the London Borough of Merton were held on 2 May 2002. This was on the same day as other local elections in England. These elections were held under new ward boundaries, which increased the number of councillors to sixty from fifty-seven. Labour remained in overall control of the council with a reduced majority.

2019 Brighton and Hove City Council election

Elections to Brighton and Hove City Council election took place on 2 May 2019, electing all 54 members of the council, alongside other local elections in England and Northern Ireland.

The 2022 Merton London Borough Council election is due to take place on 5 May 2022. All 57 members of Merton London Borough Council will be elected. The elections will take place alongside local elections in the other London boroughs and elections to local authorities across the United Kingdom.

References

  1. "London Datastore". data.london.gov.uk. Retrieved 24 May 2018.
  2. 1 2 "Merton Council Elections 2006" (PDF). Merton Electoral Services. 7 May 2010. Retrieved 8 June 2018.
  3. "Merton Council Elections 2006" (PDF). Merton Electoral Services. 7 May 2010. Retrieved 8 June 2018.