1994 Hillingdon London Borough Council election

Last updated
1994 Hillingdon London Borough Council election
Flag of Greater London.svg
  1990 5 May 1994 1998  

All 69 seats for Hillingdon London Borough Council
35 seats needed for a majority
Registered172,926
Turnout51.1%
 First partySecond partyThird party
 
Party Labour Conservative Independent Labour
Seats won43251
Seat changeIncrease2.svg8Decrease2.svg9Increase2.svg1

Council control before election


Conservative

Council control after election


Labour

The 1994 Hillingdon Council election took place on 5 May 1994 to elect members of Hillingdon London Borough Council in London, England. The whole council was up for election and the Labour Party gained overall control of the council. [1]

Contents

Background

Election result

Hillingdon London Borough Council elections [2] [3]
PartySeatsGainsLossesNet gain/lossSeats %Votes %Votes+/−
Total69

Ward results

(*) - Indicates an incumbent candidate

(†) - Indicates an incumbent candidate standing in a different ward

Barnhill

Barnhill (3) [2] [3]
PartyCandidateVotes%±%
Labour Edward A.J. Harris* 2,101 73.56 Increase2.svg 9.71
Labour Lindsay Bliss 2,082
Labour Gulab S. Sharma 1,852
Conservative Arthur J. Preston75726.44Decrease2.svg 9.71
Conservative Timothy R. Jones717
Conservative Cynthia I. Robertson695
Registered electors 6,632Decrease2.svg 572
Turnout 3,10846.86Decrease2.svg 1.25
Rejected ballots90.29Decrease2.svg 0.29
Labour hold
Labour hold
Labour hold

Botwell

Botwell (2) [2] [3]
PartyCandidateVotes%±%
Labour Linda J. Muller 1,556 72.29 Increase2.svg14.11
Labour Jon Davey 1,506
Conservative Kim M. Abbott59627.71Decrease2.svg 4.39
Conservative Elizabeth Bryant577
Registered electors 4,748Decrease2.svg 539
Turnout 2,28848.19Increase2.svg 1.70
Rejected ballots60.26Increase2.svg 0.02
Labour hold
Labour hold

Bourne

Bourne (2) [2] [3]
PartyCandidateVotes%±%
Labour John V. Morse 1,326 46.43 Increase2.svg 3.07
Labour Norman H. Nunn-Price 1,288
Conservative Shirley A. Harper1,16240.11Decrease2.svg 8.19
Conservative James J. O'Neil*1,095
Liberal Democrats Andrew W. Peach37913.46Increase2.svg 5.12
Registered electors 5,283Increase2.svg 114
Turnout 2,78552.72Decrease2.svg 4.10
Rejected ballots60.22Decrease2.svg 0.12
Labour gain from Conservative

Cavendish

Cavendish (2) [2] [3]
PartyCandidateVotes%±%
Conservative Jeremy A. Bishop 1,290 44.23 Decrease2.svg 2.90
Conservative Keith A. Morris 1,278
Liberal Democrats Richard A. Bonner1,04434.83Decrease2.svg 0.20
Liberal Democrats Harry Davies978
Labour Douglas Whitehead61020.94Increase2.svg 5.93
Labour Maureen Crimmins605
Registered electors 5,210Increase2.svg 179
Turnout 3,00957.75Decrease2.svg 6.11
Rejected ballots30.10Decrease2.svg 0.03
Conservative hold
Conservative hold

Charville

Charville (2) [2] [3]
PartyCandidateVotes%±%
Labour Michael C. Craxton* 2,107 53.65 Increase2.svg 4.76
Labour Philip S. Berry 2,074
Labour Terence J.J. Donlevy 2,019
Conservative Patrick A. Cooke*1,41134.23Decrease2.svg16.88
Conservative Mary A. O'Connor1,289
Conservative Matthew J. Fitzpatrick1,256
Liberal Democrats Peter J. Dollimore49112.12New
Liberal Democrats John H. Rout442
Registered electors 7,324Decrease2.svg 262
Turnout 3,88953.10Increase2.svg 0.96
Rejected ballots60.15Decrease2.svg 0.31
Labour hold
Labour gain from Conservative

Colham

Colham (2) [2] [3]
PartyCandidateVotes%±%
Labour Brian F. Hudson* 1,306 52.57 Increase2.svg 3.65
Labour Shirley M. Virando 1,124
Conservative Betty M. Buttrum74130.33Decrease2.svg10.15
Conservative Ian A. Prince660
Liberal Democrats John M. Price39517.09Decrease2.svg 6.49
Registered electors 4,792Decrease2.svg 116
Turnout 2,33748.77Decrease2.svg 2.82
Rejected ballots20.09Increase2.svg 0.01
Labour hold
Labour hold

Cowley

Cowley (3) [2] [3]
PartyCandidateVotes%±%
Labour Peter James* 1,692 48.88 Increase2.svg 9.08
Labour David Williams* 1,579
Labour Peter K. Osborne 1,571
Conservative Leonard D. Hyde1,18834.52Decrease2.svg 2.95
Conservative Anthony Boulden1,144
Conservative Paul Babbar1,087
Liberal Democrats Pauline F. Kent57816.60Increase2.svg 6.63
Liberal Democrats Andrew N. Sims558
Liberal Democrats Kevin J. Pickess508
Registered electors 6,956Increase2.svg 52
Turnout 3,46649.83Decrease2.svg 5.69
Rejected ballots00.00Decrease2.svg 0.21
Labour hold
Labour hold
Labour hold

Crane

Crane (2) [2] [3]
PartyCandidateVotes%±%
Labour Patrick R. Lyons* 1,582 72.57 Increase2.svg16.55
Labour Christopher J. Mullen 1,514
Conservative Derek D. Baxter62927.43Decrease2.svg 5.89
Conservative Teresa Tilbury541
Registered electors 4,794Decrease2.svg 216
Turnout 2,30047.98Decrease2.svg 2.49
Rejected ballots180.78Increase2.svg 0.65
Labour hold
Labour hold

Deansfield

Deansfield (2) [2] [3]
PartyCandidateVotes%±%
Labour Anne O'Shea 1,573 53.32 Increase2.svg25.68
Labour David J. Horne 1,513
Conservative Thomas M. Lackner [n 1] 1,36946.68Increase2.svg 4.89
Conservative Solveig Stone1,332
Registered electors 5,425Decrease2.svg 240
Turnout 3,06856.55Decrease2.svg 4.88
Rejected ballots180.59Increase2.svg 0.16
Labour gain from Conservative

Eastcote

Eastcote (3) [2] [3]
PartyCandidateVotes%±%
Conservative Catherine S. Dann [n 2] 2,257 58.69 Decrease2.svg13.55
Conservative David W. Payne* 2,216
Conservative Graham E.M. Horn* 2,213
Liberal Democrats Stephen J. Carey85921.14Increase2.svg10.02
Liberal Democrats David J. Marshall794
Labour Sarah P. Johnson79220.17Increase2.svg 3.53
Labour Michael J. Roberts770
Liberal Democrats Garth L. Underwood755
Labour Geraldine M. Stroud737
Registered electors 7,681Decrease2.svg 129
Turnout 3,93451.22Decrease2.svg 4.71
Rejected ballots60.15Increase2.svg 0.01
Conservative hold
Conservative hold
Conservative hold

Harefield

Harefield (2) [2] [3]
PartyCandidateVotes%±%
Labour Pauline D. Crawley* [n 3] 1,473 54.49 Increase2.svg18.76
Labour Anthony Burles 1,197
Conservative Donald H. Mitchell*92936.04Decrease2.svg 5.68
Conservative Patricia J. Spargo836
Liberal Democrats Elizabeth V Jeffs2469.47Increase2.svg 3.89
Liberal Democrats Timothy B. Jeffs218
Registered electors 4,875Decrease2.svg 226
Turnout 2,62553.85Decrease2.svg 5.73
Rejected ballots20.08Decrease2.svg 0.05
Labour gain from Conservative
Labour hold

Harlington

Harlington (3) [2] [3]
PartyCandidateVotes%±%
Labour Brian T. Neighbour* 1,816 51.16 Increase2.svg 9.41
Labour Graham R. Tomlin [n 4] 1,726
Labour Marion Way* 1,670
Liberal Democrats Anthony J. Little1,04026.16Increase2.svg 1.67
Liberal Democrats Carl J. Neilson826
Conservative Michael H. Berry80922.68Decrease2.svg 11.08
Liberal Democrats David J. Webb799
Conservative Marion Howell790
Conservative Michael P. O'Connor710
Registered electors 7,213Decrease2.svg 321
Turnout 3,63250.35Increase2.svg 0.18
Rejected ballots00.00Decrease2.svg 0.08
Labour hold
Labour hold
Labour hold

Heathrow

Heathrow (2) [2] [3]
PartyCandidateVotes%±%
Labour Philip E. Kordun [n 5] 1,587 61.23 Increase2.svg11.35
Labour Catherine Stocker 1,586
Conservative Daniel A. Banks83430.94Decrease2.svg 8.92
Conservative Jonathan R. Banks769
BNP Robert Church2037.83New
Registered electors 5,358Decrease2.svg 343
Turnout 2,65849.61Increase2.svg 1.97
Rejected ballots60.23Increase2.svg 0.01
Labour hold
Labour hold

Hillingdon East

Hillingdon East (2) [2] [3]
PartyCandidateVotes%±%
Labour Leonard E. Smith 1,338 26.69 Decrease2.svg23.19
Independent Labour Walter D. Kennedy* [n 6] 1,223 37.02 New
Conservative Peter W. Robins75022.70Decrease2.svg17.16
Conservative Philip W. Fisher749
Liberal Democrats Jill Rhodes46913.59Increase2.svg 3.33
Liberal Democrats Patrick F. Filgate428
Labour Herbert W.J. Binding425
Registered electors 5,174Decrease2.svg 527
Turnout 2,84154.91Increase2.svg 7.27
Rejected ballots30.11Decrease2.svg 0.11
Labour hold
Independent Labour gain from Labour

Hillingdon North

Hillingdon North (2) [2] [3]
PartyCandidateVotes%±%
Labour John Bebbington* 1,261 41.15 Increase2.svg 4.34
Labour John G. Lonsdale* 1,234
Liberal Democrats Brian Outhwaite1,08935.84Increase2.svg10.58
Liberal Democrats Ann-Marie Sharkey1,085
Conservative Ian C. Taylor70623.01Decrease2.svg10.06
Conservative Karyn T. Kenway690
Registered electors 5,075Decrease2.svg 285
Turnout 3,14762.01Decrease2.svg 0.62
Rejected ballots00.00Decrease2.svg 0.21
Labour hold
Labour hold

Hillingdon West

Hillingdon West (3) [2] [3]
PartyCandidateVotes%±%
Conservative Jane R. Crease 1,359 43.94 Decrease2.svg 6.80
Conservative Michael J. Gibson 1,301
Conservative Alfred G. Langley* 1,300
Labour John W. Aldred1,26939.08Increase2.svg 8.83
Labour Anna T. Lefort1,144
Labour Patricia A. Potter1,110
Liberal Democrats David G. Barker53716.98Increase2.svg 6.78
Liberal Democrats Eileen Holland511
Liberal Democrats Steven P. Fisher481
Registered electors 7,521Increase2.svg 140
Turnout 3,17042.15Decrease2.svg 2.65
Rejected ballots00.00Decrease2.svg 0.06
Conservative hold
Conservative hold
Conservative hold

Ickenham

Ickenham (3) [2] [3]
PartyCandidateVotes%±%
Conservative Richard M. Barnes* 2,767 59.38 Decrease2.svg 5.73
Conservative Mavis Knight* 2,753
Conservative Neil V.A. Sherry 2,677
Labour Linda A. Buckingham1,03121.76Increase2.svg 4.32
Labour John Buckingham996
Labour David V. Bell976
Liberal Democrats Mary Outhwaite90218.87Increase2.svg11.01
Liberal Democrats Bruce P. Routledge879
Liberal Democrats Alison M. Rudin824
Registered electors 8,672Decrease2.svg 228
Turnout 4,79455.28Decrease2.svg 3.64
Rejected ballots00.00Decrease2.svg 0.15
Conservative hold
Conservative hold
Conservative hold

Manor

Manor (2) [2] [3]
PartyCandidateVotes%±%
Conservative Edwin Hales* 1,306 46.38 Decrease2.svg 9.03
Conservative David A. Yarrow* 1,292
Labour Roy S. Murray83829.13Increase2.svg 6.95
Labour Robert P. Nunn793
Liberal Democrats Derek J. Honeygold70424.49Increase2.svg 2.08
Liberal Democrats Kim M. Mathen667
Registered electors 5,390Decrease2.svg 139
Turnout 2,89953.78Decrease2.svg 3.63
Rejected ballots120.41Increase2.svg 0.28
Conservative hold
Conservative hold

Northwood

Northwood (3) [2] [3]
PartyCandidateVotes%±%
Conservative Frank W. Taylor* 2,093 66.67 Decrease2.svg 3.40
Conservative Jonathan P.S. Bianco* 2,082
Conservative Albert Kanjee* 1,952
Liberal Democrats Jane F. Woodnutt59618.74Increase2.svg 8.99
Liberal Democrats Norma J. Dawlings587
Liberal Democrats Melanie M. Winterbotham539
Labour Gilbert Greenall45814.59Decrease2.svg 1.86
Labour Margaret M. Bartlett454
Labour Bernard S. Gauntlett430
Registered electors 7,186Decrease2.svg 75
Turnout 3,21544.74Decrease2.svg 4.91
Rejected ballots50.16Decrease2.svg 0.01
Conservative hold
Conservative hold
Conservative hold

Northwood Hills

Northwood Hills (3) [2] [3]
PartyCandidateVotes%±%
Conservative David A. Bishop* [n 7] 1,828 51.88 Decrease2.svg 6.91
Conservative Susan E. James 1,788
Conservative Andrew J. Retter* 1,763
Labour Ruth Allan1,06928.70Increase2.svg 0.04
Labour James B. McGurk954
Labour Barbara A. Evans952
Liberal Democrats Keith W. Baker70919.42Increase2.svg 6.87
Liberal Democrats Mary G. Butcher655
Liberal Democrats Leislie G. Butcher650
Registered electors 7,353Decrease2.svg 41
Turnout 3,61849.20Decrease2.svg 2.13
Rejected ballots50.14Decrease2.svg 0.04
Conservative hold
Conservative hold
Conservative hold

Ruislip

Ruislip (2) [2] [3]
PartyCandidateVotes%±%
Conservative Michael Kilbey* 1,558 53.35 Decrease2.svg16.93
Conservative Maurice Lancaster [n 8] 1,479
Liberal Democrats Michael F. Cox77926.10Increase2.svg14.74
Liberal Democrats Stuart T. Laycock706
Labour Clifford C. Barton59520.55Decrease2.svg 2.19
Labour David R. Herriott574
Registered electors 5,548Decrease2.svg 75
Turnout 2,94453.06Decrease2.svg 3.12
Rejected ballots40.14Increase2.svg 0.05
Conservative hold
Conservative hold

St Martins

St Martins (2) [2] [3]
PartyCandidateVotes%±%
Conservative Philip N. Corthorne* [n 9] 1,631 53.92 Decrease2.svg11.27
Conservative Douglas S. Mills* 1,573
Labour Alan H. Howard91729.72Increase2.svg 6.73
Labour Trevor A. Richards848
Liberal Democrats Hilary F. Leighter50616.36Increase2.svg 4.54
Liberal Democrats Neville G. Parsonage466
Registered electors 5,804Decrease2.svg 197
Turnout 3,05352.60Decrease2.svg 1.17
Rejected ballots50.16Increase2.svg 0.07
Conservative hold
Conservative hold

Townfield

Townfield (3) [2] [3]
PartyCandidateVotes%±%
Labour Chris Rogers 2,614 69.34 Increase2.svg 4.40
Labour Christine Saunders 2,547
Labour Dalip Chand 2,465
Conservative Kelly K. Armstrong1,217
Conservative Valerie Hannington1,089
Conservative Robert Taylor1,067
Registered electors 8,022
Turnout 4,04150.4
Rejected ballots200.5
Labour hold
Labour hold
Labour hold

Uxbridge North

Uxbridge North (2) [2] [3]
PartyCandidateVotes%±%
Conservative George E. Cooper 1,409 {{{change}}}
Conservative Michael J. Heywood 1,346 {{{change}}}
Labour Moira K. Spink694
Labour Sean L.W. McWhinnie689
Liberal Democrats Rosemary Gill608
Liberal Democrats James A. Sims497
Registered electors 4,887
Turnout 2,63553.9{{{change}}}
Rejected ballots80.3
Conservative hold
Conservative hold

Uxbridge South

Uxbridge South (2) [2] [3]
PartyCandidateVotes%±%
Labour Paul D. Baker 1,248 {{{change}}}
Labour Michael J. Nash 1,203 {{{change}}}
Conservative Eileen P. Barrett581
Conservative Nilesh Parekh444
Liberal Democrats Andrew Vernazza268
Registered electors 4,083
Turnout 2,06550.6{{{change}}}
Rejected ballots30.1
Labour hold
Labour hold

West Drayton

West Drayton (2) [2] [3]
PartyCandidateVotes%±%
Labour Dorothy J. Blundell 1,250 {{{change}}}
Labour Martin G. McGrath 1,189 {{{change}}}
Conservative Kevin Brookes1,008
Conservative Norman C. Hawkins990
Liberal Democrats Iain P. Campbell412
Liberal Democrats Kay Hooker388
Registered electors 5,191
Turnout 2,71352.3{{{change}}}
Rejected ballots50.2
Labour gain from Conservative

Wood End

Wood End (2) [2] [3]
PartyCandidateVotes%±%
Labour Janet E. Gardner 1,584 {{{change}}}
Labour Peter M. Ryerson 1,458 {{{change}}}
Conservative Albert J. Tyrrell688
Conservative Douglas Whitehead602
Liberal Democrats Beryl D. Bell320
Registered electors 4,901
Turnout 2,50451.1{{{change}}}
Rejected ballots60.2
Labour hold
Labour hold

Yeading

Yeading (3) [2] [3]
PartyCandidateVotes%±%
Labour Julia A. Leonard 1,912 {{{change}}}
Labour Anthony F. Way 1,802 {{{change}}}
Labour Steve Panayi 1,781 {{{change}}}
Conservative Raymond Green998
Conservative Paul Bavington990
Conservative Bruce Howell984
Registered electors 6,558
Turnout 3,10647.4{{{change}}}
Rejected ballots200.6
Labour hold
Labour hold
Labour hold

Yiewsley

Yiewsley (2) [2] [3]
PartyCandidateVotes%±%
Labour Paul K. Harmsworth 1,561 {{{change}}}
Labour Karen R. Livney 1,501 {{{change}}}
Conservative Ann F. Banks817
Conservative Michael J.D. Bull801
Registered electors 5,270
Turnout 2,50447.5{{{change}}}
Rejected ballots130.5
Labour hold
Labour hold

Notes

  1. Lackner was a sitting councillor representing the Bourne ward
  2. Dann was a sitting councillor representing the Cavendish ward
  3. Crawlley replaced Cllr. Kenneth R. Abel after his death in 1993 [4]
  4. Tomlin was a sitting councillor representing the Wood End ward
  5. Kordun was a sitting councillor representing the Colham ward
  6. Kennedy was originally nominated for Labour, but was suspended in Mar 1994 based on accusations he made donations to Militant Labour [5]
  7. Bishop replaced Cllr Graham E. Sewell after his resignation in 1990 [4]
  8. Lancaster was a sitting councillor representing the Deansfield ward
  9. Corthone replaced Cllr. Derek J. Tow after his death in 1993 [4]

Related Research Articles

Elections to Tower Hamlets London Borough Council were held on 5 May 1994. The whole council was up for election and the Labour party gained overall control of the council from the Liberal Democrats.

Elections to Southwark Council were held on 5 May 1994, on the same day as other local elections happening around the country. The whole council was up for election. Turnout was 37.53%.

Elections to Lambeth London Borough Council were held in May 1994. Turnout was 43.01%.

Elections to Lewisham London Borough Council were held in May 1994. The whole council was up for election.

Elections to Lewisham London Borough Council were held in May 1990. The whole council was up for election. Turnout was 39.6%.

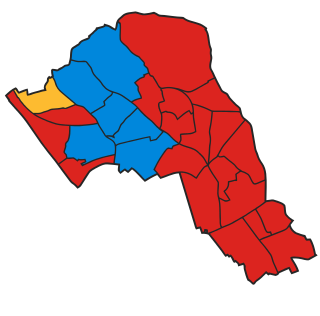
The 1994 Newham London Borough Council election to the Newham London Borough Council was held on 5 May 1994. The whole council was up for election. Turnout was 37.2%. Labour maintained its overwhelming majority.

<span class="mw-page-title-main">1990 Camden London Borough Council election</span> 1990 local election in England

The 1990 Camden Council election took place on 3 May 1990 to elect members of Camden London Borough Council in London, England. The whole council was up for election. Labour comfortably stayed in overall control of the council, despite the Conservatives gaining three seats at their expense in Swiss Cottage. The Green Party came third in vote share with 13% of the vote, but won no seats.

The 1990 Barking and Dagenham Borough Council election took place on 3 May 1990 to elect members of Barking and Dagenham London Borough Council in London, England. The whole council was up for election and the Labour Party stayed overwhelmingly in overall control of the council.

The 1990 Brent Council election took place on 3 May 1990 to elect members of Brent London Borough Council in London, England. The whole council was up for election and the council went in no overall control.

<span class="mw-page-title-main">1990 Croydon London Borough Council election</span> 1990 local election in England

The 1990 Croydon Council election took place on 3 May 1990 to elect members of Croydon London Borough Council in London, England. The whole council was up for election and the Conservative party stayed in overall control of the council.

The 1990 Ealing Council election took place on 3 May 1990 to elect members of Ealing London Borough Council in London, England. The whole council was up for election and the Conservative party gained overall control of the council.

The 1990 Hillingdon Council election tooklace on 3 May 1990 to elect members of Hillingdon London Borough Council in London, Englaland. The whole council was up for election and the Conservative Party gained overall control of the council.

The 1994 Hounslow Council election took place on 5 May 1994 to elect members of Hounslow London Borough Council in London, England. The whole council was up for election and the Labour party stayed in overall control of the council.

The 1994 Islington Council election took place on 5 May 1994 to elect members of Islington London Borough Council in London, England. The whole council was up for election and the Labour party stayed in overall control of the council.

The 1990 Kensington and Chelsea Council election took place on 3 May 1990 to elect members of Kensington and Chelsea London Borough Council in London, England. The whole council was up for election and the Conservative party stayed in overall control of the council.

The 1994 Kingston upon Thames Council election took place on 5 May 1994 to elect members of Kingston upon Thames London Borough Council in London, England. The whole council was up for election and the Liberal Democrats gained overall control of the council. Turnout for the election was 53.33%.

The 1994 Redbridge Council election took place on 5 May 1994 to elect members of Redbridge London Borough Council in London, England. The whole council was up for election and the council went into no overall control.

The 1994 Richmond upon Thames Council election took place on 5 May 1994 to elect members of Richmond upon Thames London Borough Council in London, England. The whole council was up for election and the Liberal Democrats stayed in overall control of the council.

The 1994 Sutton Council election took place on 5 May 1994 to elect members of Sutton London Borough Council in London, England. The whole council was up for election and the Liberal Democrats stayed in overall control of the council.

The 1994 Waltham Forest Council election took place on 5 May 1994 to elect members of Waltham Forest London Borough Council in London, England. The whole council was up for election and the council went into no overall control.

References

  1. "London Borough Council Elections 5 May 1994 including Results from the European Elections" (PDF). London Datastore. London Research Centre. Retrieved 29 March 2015.
  2. 1 2 3 4 5 6 7 8 9 10 11 12 13 14 15 16 17 18 19 20 21 22 23 24 25 26 27 28 29 30 Minors, Michael; Grenham, Dennis. "London Borough Council Elections - 5 May 1994" (PDF). London Datastore. London Research Centre. pp. 93–96, 206–207. Retrieved 11 June 2024.
  3. 1 2 3 4 5 6 7 8 9 10 11 12 13 14 15 16 17 18 19 20 21 22 23 24 25 26 27 28 29 30 Rallings, Colin; Thrasher, Michael. "London Borough of Hillingdon Election Results 1964-2010" (PDF). Elections Centre. Plymouth University. pp. 10–11. Retrieved 11 June 2024.
  4. 1 2 3 Minors, Michael; Grenham, Dennis; Vaid, Lovedeep. "London Borough Council By-elections - May 1990 to May 1994" (PDF). London Datastore. London Research Centre. pp. 42–43. Retrieved 11 June 2024.
  5. Main, Edward (2 March 1994). "Labour ban on Kennedy". Uxbridge & W. Drayton Gazette. p. 5 via British Newspaper Archive.