Agarose gel electrophoresis

Last updated
Digital image of 3 plasmid restriction digests run on a 1% w/v agarose gel, 3 volt/cm, stained with ethidium bromide. The DNA size marker is a commercial 1 kbp ladder. The position of the wells and direction of DNA migration is noted. DNAgel4wiki.png
Digital image of 3 plasmid restriction digests run on a 1% w/v agarose gel, 3 volt/cm, stained with ethidium bromide. The DNA size marker is a commercial 1 kbp ladder. The position of the wells and direction of DNA migration is noted.

Agarose gel electrophoresis is a method of gel electrophoresis used in biochemistry, molecular biology, genetics, and clinical chemistry to separate a mixed population of macromolecules such as DNA or proteins in a matrix of agarose, one of the two main components of agar. The proteins may be separated by charge and/or size (isoelectric focusing agarose electrophoresis is essentially size independent), and the DNA and RNA fragments by length. [1] Biomolecules are separated by applying an electric field to move the charged molecules through an agarose matrix, and the biomolecules are separated by size in the agarose gel matrix. [2]

Contents

Agarose gel is easy to cast, has relatively fewer charged groups, and is particularly suitable for separating DNA of size range most often encountered in laboratories, which accounts for the popularity of its use. The separated DNA may be viewed with stain, most commonly under UV light, and the DNA fragments can be extracted from the gel with relative ease. Most agarose gels used are between 0.7–2% dissolved in a suitable electrophoresis buffer.

Properties of agarose gel

An agarose gel cast in tray, to be used for gel electrophoresis Two percent Agarose Gel in Borate Buffer cast in a Gel Tray (Front, angled).jpg
An agarose gel cast in tray, to be used for gel electrophoresis

Agarose gel is a three-dimensional matrix formed of helical agarose molecules in supercoiled bundles that are aggregated into three-dimensional structures with channels and pores through which biomolecules can pass. [3] The 3-D structure is held together with hydrogen bonds and can therefore be disrupted by heating back to a liquid state. The melting temperature is different from the gelling temperature, depending on the sources, agarose gel has a gelling temperature of 35–42 °C and a melting temperature of 85–95 °C. Low-melting and low-gelling agaroses made through chemical modifications are also available.

Agarose gel has large pore size and good gel strength, making it suitable as an anticonvection medium for the electrophoresis of DNA and large protein molecules. The pore size of a 1% gel has been estimated from 100 nm to 200–500 nm, [4] [5] and its gel strength allows gels as dilute as 0.15% to form a slab for gel electrophoresis. [6] Low-concentration gels (0.1–0.2%) however are fragile and therefore hard to handle. Agarose gel has lower resolving power than polyacrylamide gel for DNA but has a greater range of separation, and is therefore used for DNA fragments of usually 50–20,000 bp in size. The limit of resolution for standard agarose gel electrophoresis is around 750 kb, but resolution of over 6 Mb is possible with pulsed field gel electrophoresis (PFGE). [7] It can also be used to separate large proteins, and it is the preferred matrix for the gel electrophoresis of particles with effective radii larger than 5–10 nm. A 0.9% agarose gel has pores large enough for the entry of bacteriophage T4. [6]

The agarose polymer contains charged groups, in particular pyruvate and sulphate. [8] These negatively charged groups create a flow of water in the opposite direction to the movement of DNA in a process called electroendosmosis (EEO), and can therefore retard the movement of DNA and cause blurring of bands. Higher concentration gels would have higher electroendosmotic flow. Low EEO agarose is therefore generally preferred for use in agarose gel electrophoresis of nucleic acids, but high EEO agarose may be used for other purposes. The lower sulphate content of low EEO agarose, particularly low-melting point (LMP) agarose, is also beneficial in cases where the DNA extracted from gel is to be used for further manipulation as the presence of contaminating sulphates may affect some subsequent procedures, such as ligation and PCR. Zero EEO agaroses however are undesirable for some applications as they may be made by adding positively charged groups and such groups can affect subsequent enzyme reactions. [9] Electroendosmosis is a reason agarose is used in preference to agar as the agaropectin component in agar contains a significant amount of negatively charged sulphate and carboxyl groups. The removal of agaropectin in agarose substantially reduces the EEO, as well as reducing the non-specific adsorption of biomolecules to the gel matrix. However, for some applications such as the electrophoresis of serum proteins, a high EEO may be desirable, and agaropectin may be added in the gel used. [10]

Migration of nucleic acids in agarose gel

Factors affecting migration of nucleic acid in gel

Gels of plasmid preparations usually show a major band of supercoiled DNA with other fainter bands in the same lane. Note that by convention DNA gel is displayed with smaller DNA fragments nearer to the bottom of the gel. This is because historically DNA gels were run vertically and the smaller DNA fragments move downwards faster. Plasmid miniprep.jpg
Gels of plasmid preparations usually show a major band of supercoiled DNA with other fainter bands in the same lane. Note that by convention DNA gel is displayed with smaller DNA fragments nearer to the bottom of the gel. This is because historically DNA gels were run vertically and the smaller DNA fragments move downwards faster.

A number of factors can affect the migration of nucleic acids: the dimension of the gel pores (gel concentration), size of DNA being electrophoresed, the voltage used, the ionic strength of the buffer, and the concentration of intercalating dye such as ethidium bromide if used during electrophoresis. [11]

Smaller molecules travel faster than larger molecules in gel, and double-stranded DNA moves at a rate that is inversely proportional to the logarithm of the number of base pairs. This relationship however breaks down with very large DNA fragments, and separation of very large DNA fragments requires the use of pulsed field gel electrophoresis (PFGE), which applies alternating current from different directions and the large DNA fragments are separated as they reorient themselves with the changing field. [12]

For standard agarose gel electrophoresis, larger molecules are resolved better using a low concentration gel while smaller molecules separate better at high concentration gel. Higher concentration gels, however, require longer run times (sometimes days).

The movement of the DNA may be affected by the conformation of the DNA molecule, for example, supercoiled DNA usually moves faster than relaxed DNA because it is tightly coiled and hence more compact. In a normal plasmid DNA preparation, multiple forms of DNA may be present. [13] Gel electrophoresis of the plasmids would normally show the negatively supercoiled form as the main band, while nicked DNA (open circular form) and the relaxed closed circular form appears as minor bands. The rate at which the various forms move however can change using different electrophoresis conditions, [14] and the mobility of larger circular DNA may be more strongly affected than linear DNA by the pore size of the gel. [15]

Ethidium bromide which intercalates into circular DNA can change the charge, length, as well as the superhelicity of the DNA molecule, therefore its presence in gel during electrophoresis can affect its movement. For example, the positive charge of ethidium bromide can reduce the DNA movement by 15%. [12] Agarose gel electrophoresis can be used to resolve circular DNA with different supercoiling topology. [16]

DNA damage due to increased cross-linking will also reduce electrophoretic DNA migration in a dose-dependent way. [17] [18]

The rate of migration of the DNA is proportional to the voltage applied, i.e. the higher the voltage, the faster the DNA moves. The resolution of large DNA fragments however is lower at high voltage. The mobility of DNA may also change in an unsteady field – in a field that is periodically reversed, the mobility of DNA of a particular size may drop significantly at a particular cycling frequency. [4] This phenomenon can result in band inversion in field inversion gel electrophoresis (FIGE), whereby larger DNA fragments move faster than smaller ones.

Migration anomalies

Mechanism of migration and separation

The negative charge of its phosphate backbone moves the DNA towards the positively charged anode during electrophoresis. However, the migration of DNA molecules in solution, in the absence of a gel matrix, is independent of molecular weight during electrophoresis. [4] [20] The gel matrix is therefore responsible for the separation of DNA by size during electrophoresis, and a number of models exist to explain the mechanism of separation of biomolecules in gel matrix. A widely accepted one is the Ogston model which treats the polymer matrix as a sieve. A globular protein or a random coil DNA moves through the interconnected pores, and the movement of larger molecules is more likely to be impeded and slowed down by collisions with the gel matrix, and the molecules of different sizes can therefore be separated in this sieving process. [4]

The Ogston model however breaks down for large molecules whereby the pores are significantly smaller than size of the molecule. For DNA molecules of size greater than 1 kb, a reptation model (or its variants) is most commonly used. This model assumes that the DNA can crawl in a "snake-like" fashion (hence "reptation") through the pores as an elongated molecule. A biased reptation model applies at higher electric field strength, whereby the leading end of the molecule become strongly biased in the forward direction and pulls the rest of the molecule along. [21] Real-time fluorescence microscopy of stained molecules, however, showed more subtle dynamics during electrophoresis, with the DNA showing considerable elasticity as it alternately stretching in the direction of the applied field and then contracting into a ball, or becoming hooked into a U-shape when it gets caught on the polymer fibres. [22] [23]

General procedure

The details of an agarose gel electrophoresis experiment may vary depending on methods, but most follow a general procedure.

Video showing assembly of the rig and loading/running of the gel.

Casting of gel

Loading DNA samples into the wells of an agarose gel using a multi-channel pipette. Loading DNA samples into an agarose gel for electrophoresis - CPHST - USDA photo.jpg
Loading DNA samples into the wells of an agarose gel using a multi-channel pipette.

The gel is prepared by dissolving the agarose powder in an appropriate buffer, such as TAE or TBE, to be used in electrophoresis. [12] The agarose is dispersed in the buffer before heating it to near-boiling point, but avoid boiling. The melted agarose is allowed to cool sufficiently before pouring the solution into a cast as the cast may warp or crack if the agarose solution is too hot. A comb is placed in the cast to create wells for loading sample, and the gel should be completely set before use.

The concentration of gel affects the resolution of DNA separation. The agarose gel is composed of microscopic pores through which the molecules travel, and there is an inverse relationship between the pore size of the agarose gel and the concentration pore size decreases as the density of agarose fibers increases. High gel concentration improves separation of smaller DNA molecules, while lowering gel concentration permits large DNA molecules to be separated. The process allows fragments ranging from 50 base pairs to several mega bases to be separated depending on the gel concentration used. [24] The concentration is measured in weight of agarose over volume of buffer used (g/ml). For a standard agarose gel electrophoresis, a 0.8% gel gives good separation or resolution of large 5–10kb DNA fragments, while 2% gel gives good resolution for small 0.2–1kb fragments. 1% gels is often used for a standard electrophoresis. [25] High percentage gels are often brittle and may not set evenly, while low percentage gels (0.1-0.2%) are fragile and not easy to handle. Low-melting-point (LMP) agarose gels are also more fragile than normal agarose gel. Low-melting point agarose may be used on its own or simultaneously with standard agarose for the separation and isolation of DNA. [26] PFGE and FIGE are often done with high percentage agarose gels.

Loading of samples

Once the gel has set, the comb is removed, leaving wells where DNA samples can be loaded. Loading buffer is mixed with the DNA sample before the mixture is loaded into the wells. The loading buffer contains a dense compound, which may be glycerol, sucrose, or Ficoll, that raises the density of the sample so that the DNA sample may sink to the bottom of the well. [12] If the DNA sample contains residual ethanol after its preparation, it may float out of the well. The loading buffer also includes colored dyes such as xylene cyanol and bromophenol blue used to monitor the progress of the electrophoresis. The DNA samples are loaded using a pipette.

Electrophoresis

Agarose gel slab in electrophoresis tank with bands of dyes indicating progress of the electrophoresis. The DNA moves towards anode. Electrophoresis - Moving along gel.jpg
Agarose gel slab in electrophoresis tank with bands of dyes indicating progress of the electrophoresis. The DNA moves towards anode.

Agarose gel electrophoresis is most commonly done horizontally in a subaquaeous mode whereby the slab gel is completely submerged in buffer during electrophoresis. It is also possible, but less common, to perform the electrophoresis vertically, as well as horizontally with the gel raised on agarose legs using an appropriate apparatus. [27] The buffer used in the gel is the same as the running buffer in the electrophoresis tank, which is why electrophoresis in the subaquaeous mode is possible with agarose gel.

For optimal resolution of DNA greater than 2 kb in size in standard gel electrophoresis, 5 to 8 V/cm is recommended (the distance in cm refers to the distance between electrodes, therefore this recommended voltage would be 5 to 8 multiplied by the distance between the electrodes in cm). [14] Voltage may also be limited by the fact that it heats the gel and may cause the gel to melt if it is run at high voltage for a prolonged period, especially if the gel used is LMP agarose gel. Too high a voltage may also reduce resolution, as well as causing band streaking for large DNA molecules. Too low a voltage may lead to broadening of band for small DNA fragments due to dispersion and diffusion. [28]

Since DNA is not visible in natural light, the progress of the electrophoresis is monitored using colored dyes. Xylene cyanol (light blue color) comigrates large DNA fragments, while Bromophenol blue (dark blue) comigrates with the smaller fragments. Less commonly used dyes include Cresol Red and Orange G which migrate ahead of bromophenol blue. A DNA marker is also run together for the estimation of the molecular weight of the DNA fragments. Note however that the size of a circular DNA like plasmids cannot be accurately gauged using standard markers unless it has been linearized by restriction digest, alternatively a supercoiled DNA marker may be used.

Staining and visualization

The gel with UV illumination: DNA stained with ethidium bromide appears as glowing orange bands. AgarosegelUV.jpg
The gel with UV illumination: DNA stained with ethidium bromide appears as glowing orange bands.

DNA as well as RNA are normally visualized by staining with ethidium bromide, which intercalates into the major grooves of the DNA and fluoresces under UV light. The intercalation depends on the concentration of DNA and thus, a band with high intensity will indicate a higher amount of DNA compared to a band of less intensity. [12] The ethidium bromide may be added to the agarose solution before it gels, or the DNA gel may be stained later after electrophoresis. Destaining of the gel is not necessary but may produce better images. Other methods of staining are available; examples are MIDORI Green, SYBR Green, GelRed, methylene blue, brilliant cresyl blue, Nile blue sulphate, and crystal violet. [29] SYBR Green, GelRed and other similar commercial products are sold as safer alternatives to ethidium bromide as it has been shown to be mutagenic in Ames test, although the carcinogenicity of ethidium bromide has not actually been established. SYBR Green requires the use of a blue-light transilluminator. DNA stained with crystal violet can be viewed under natural light without the use of a UV transilluminator which is an advantage, however it may not produce a strong band.

When stained with ethidium bromide, the gel is viewed with an ultraviolet (UV) transilluminator. The UV light excites the electrons within the aromatic ring of ethidium bromide, and once they return to the ground state, light is released, making the DNA and ethidium bromide complex fluoresce. [12] Standard transilluminators use wavelengths of 302/312-nm (UV-B), however exposure of DNA to UV radiation for as little as 45 seconds can produce damage to DNA and affect subsequent procedures, for example reducing the efficiency of transformation, in vitro transcription, and PCR. [30] Exposure of DNA to UV radiation therefore should be limited. Using a higher wavelength of 365 nm (UV-A range) causes less damage to the DNA but also produces much weaker fluorescence with ethidium bromide. Where multiple wavelengths can be selected in the transilluminator, shorter wavelength can be used to capture images, while longer wavelength should be used if it is necessary to work on the gel for any extended period of time.

The transilluminator apparatus may also contain image capture devices, such as a digital or polaroid camera, that allow an image of the gel to be taken or printed.

For gel electrophoresis of protein, the bands may be visualised with Coomassie or silver stains.

Cutting out agarose gel slices. Protective equipment must be worn when using UV transilluminator. Cutting of the agarose gel.jpg
Cutting out agarose gel slices. Protective equipment must be worn when using UV transilluminator.

Downstream procedures

The separated DNA bands are often used for further procedures, and a DNA band may be cut out of the gel as a slice, dissolved and purified. Contaminants however may affect some downstream procedures such as PCR, and low melting point agarose may be preferred in some cases as it contains fewer of the sulphates that can affect some enzymatic reactions. The gels may also be used for blotting techniques.

Buffers

In general, the ideal buffer should have good conductivity, produce less heat and have a long life. [31] There are a number of buffers used for agarose electrophoresis; common ones for nucleic acids include Tris/Acetate/EDTA (TAE) and Tris/Borate/EDTA (TBE). The buffers used contain EDTA to inactivate many nucleases which require divalent cation for their function. The borate in TBE buffer can be problematic as borate can polymerize, and/or interact with cis diols such as those found in RNA. TAE has the lowest buffering capacity, but it provides the best resolution for larger DNA. This means a lower voltage and more time, but a better product.

Many other buffers have been proposed, e.g. lithium borate (LB), iso electric histidine, pK matched goods buffers, etc.; in most cases the purported rationale is lower current (less heat) and or matched ion mobilities, which leads to longer buffer life. Tris-phosphate buffer has high buffering capacity but cannot be used if DNA extracted is to be used in phosphate sensitive reaction. LB is relatively new and is ineffective in resolving fragments larger than 5 kbp; However, with its low conductivity, a much higher voltage could be used (up to 35 V/cm), which means a shorter analysis time for routine electrophoresis. As low as one base pair size difference could be resolved in 3% agarose gel with an extremely low conductivity medium (1 mM lithium borate). [32]

Other buffering system may be used in specific applications, for example, barbituric acid-sodium barbiturate or Tris-barbiturate buffers may be used for in agarose gel electrophoresis of proteins, for example in the detection of abnormal distribution of proteins. [33]

Applications

Agarose gels are easily cast and handled compared to other matrices and nucleic acids are not chemically altered during electrophoresis. Samples are also easily recovered. After the experiment is finished, the resulting gel can be stored in a plastic bag in a refrigerator.

Electrophoresis is performed in buffer solutions to reduce pH changes due to the electric field, which is important because the charge of DNA and RNA depends on pH, but running for too long can exhaust the buffering capacity of the solution. Further, different preparations of genetic material may not migrate consistently with each other, for morphological or other reasons.

See also

Related Research Articles

<span class="mw-page-title-main">Agarose</span> Heteropolysaccharide found in red algae

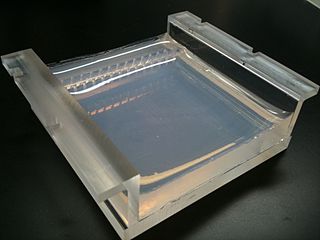
Agarose is a heteropolysaccharide, generally extracted from certain red seaweed. It is a linear polymer made up of the repeating unit of agarobiose, which is a disaccharide made up of D-galactose and 3,6-anhydro-L-galactopyranose. Agarose is one of the two principal components of agar, and is purified from agar by removing agar's other component, agaropectin.

<span class="mw-page-title-main">Gel electrophoresis</span> Method for separation and analysis of biomolecules

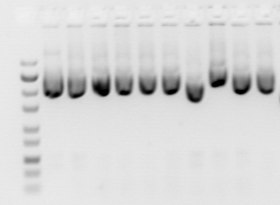
Gel electrophoresis is a method for separation and analysis of biomacromolecules and their fragments, based on their size and charge. It is used in clinical chemistry to separate proteins by charge or size and in biochemistry and molecular biology to separate a mixed population of DNA and RNA fragments by length, to estimate the size of DNA and RNA fragments or to separate proteins by charge.

<span class="mw-page-title-main">Southern blot</span> DNA analysis technique

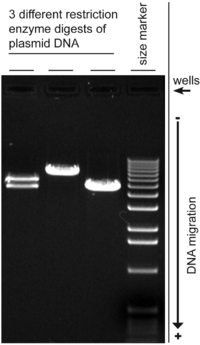
Southern blot is a method used for detection and quantification of a specific DNA sequence in DNA samples. This method is used in molecular biology. Briefly, purified DNA from a biological sample is digested with restriction enzymes, and the resulting DNA fragments are separated by using an electric current to move them through a sieve-like gel or matrix, which allows smaller fragments to move faster than larger fragments. The DNA fragments are transferred out of the gel or matrix onto a solid membrane, which is then exposed to a DNA probe labeled with a radioactive, fluorescent, or chemical tag. The tag allows any DNA fragments containing complementary sequences with the DNA probe sequence to be visualized within the Southern blot.

<span class="mw-page-title-main">Size-exclusion chromatography</span> Chromatographic method in which dissolved molecules are separated by their size & molecular weight

Size-exclusion chromatography (SEC), also known as molecular sieve chromatography, is a chromatographic method in which molecules in solution are separated by their size, and in some cases molecular weight. It is usually applied to large molecules or macromolecular complexes such as proteins and industrial polymers. Typically, when an aqueous solution is used to transport the sample through the column, the technique is known as gel-filtration chromatography, versus the name gel permeation chromatography, which is used when an organic solvent is used as a mobile phase. The chromatography column is packed with fine, porous beads which are commonly composed of dextran, agarose, or polyacrylamide polymers. The pore sizes of these beads are used to estimate the dimensions of macromolecules. SEC is a widely used polymer characterization method because of its ability to provide good molar mass distribution (Mw) results for polymers.

<span class="mw-page-title-main">Polyacrylamide gel electrophoresis</span> Analytical technique

Polyacrylamide gel electrophoresis (PAGE) is a technique widely used in biochemistry, forensic chemistry, genetics, molecular biology and biotechnology to separate biological macromolecules, usually proteins or nucleic acids, according to their electrophoretic mobility. Electrophoretic mobility is a function of the length, conformation, and charge of the molecule. Polyacrylamide gel electrophoresis is a powerful tool used to analyze RNA samples. When polyacrylamide gel is denatured after electrophoresis, it provides information on the sample composition of the RNA species.

<span class="mw-page-title-main">Gel electrophoresis of nucleic acids</span>

Nucleic acid electrophoresis is an analytical technique used to separate DNA or RNA fragments by size and reactivity. Nucleic acid molecules which are to be analyzed are set upon a viscous medium, the gel, where an electric field induces the nucleic acids to migrate toward the anode. The separation of these fragments is accomplished by exploiting the mobilities with which different sized molecules are able to pass through the gel. Longer molecules migrate more slowly because they experience more resistance within the gel. Because the size of the molecule affects its mobility, smaller fragments end up nearer to the anode than longer ones in a given period. After some time, the voltage is removed and the fragmentation gradient is analyzed. For larger separations between similar sized fragments, either the voltage or run time can be increased. Extended runs across a low voltage gel yield the most accurate resolution. Voltage is, however, not the sole factor in determining electrophoresis of nucleic acids.

<span class="mw-page-title-main">Ethidium bromide</span> DNA gel stain and veterinary drug

Ethidium bromide is an intercalating agent commonly used as a fluorescent tag in molecular biology laboratories for techniques such as agarose gel electrophoresis. It is commonly abbreviated as EtBr, which is also an abbreviation for bromoethane. To avoid confusion, some laboratories have used the abbreviation EthBr for this salt. When exposed to ultraviolet light, it will fluoresce with an orange colour, intensifying almost 20-fold after binding to DNA. Under the name homidium, it has been commonly used since the 1950s in veterinary medicine to treat trypanosomiasis in cattle. The high incidence of antimicrobial resistance makes this treatment impractical in some areas, where the related isometamidium chloride is used instead. Despite its reputation as a mutagen, tests have shown it to have low mutagenicity without metabolic activation.

<span class="mw-page-title-main">Gel electrophoresis of proteins</span>

Protein electrophoresis is a method for analysing the proteins in a fluid or an extract. The electrophoresis may be performed with a small volume of sample in a number of alternative ways with or without a supporting medium, namely agarose or polyacrylamide. Variants of gel electrophoresis include SDS-PAGE, free-flow electrophoresis, electrofocusing, isotachophoresis, affinity electrophoresis, immunoelectrophoresis, counterelectrophoresis, and capillary electrophoresis. Each variant has many subtypes with individual advantages and limitations. Gel electrophoresis is often performed in combination with electroblotting or immunoblotting to give additional information about a specific protein.

<span class="mw-page-title-main">Temperature gradient gel electrophoresis</span>

Temperature gradient gel electrophoresis (TGGE) and denaturing gradient gel electrophoresis (DGGE) are forms of electrophoresis which use either a temperature or chemical gradient to denature the sample as it moves across an acrylamide gel. TGGE and DGGE can be applied to nucleic acids such as DNA and RNA, and proteins. TGGE relies on temperature dependent changes in structure to separate nucleic acids. DGGE separates genes of the same size based on their different denaturing ability which is determined by their base pair sequence. DGGE was the original technique, and TGGE a refinement of it.

In molecular biology, gel extraction or gel isolation is a technique used to isolate a desired fragment of intact DNA from an agarose gel following agarose gel electrophoresis. After extraction, fragments of interest can be mixed, precipitated, and enzymatically ligated together in several simple steps. This process, usually performed on plasmids, is the basis for rudimentary genetic engineering.

<span class="mw-page-title-main">Pulsed-field gel electrophoresis</span> Lab technique for separation of DNA

Pulsed field gel electrophoresis is a technique used for the separation of large DNA molecules by applying to a gel matrix an electric field that periodically changes direction. Pulsed-field gel electrophoresis (PFGE) is a method used to separate large segments of DNA using an alternating and cross field. In a uniform magnetic field, components larger than 50kb move through the gel in a zigzag pattern, allowing for more effective separation of DNA molecules. This method is commonly used in microbiology for typing bacteria and is a valuable tool for epidemiological studies and gene mapping in microbes and mammalian cells. It also played a role in the development of large-insert cloning systems such as bacterial and yeast artificial chromosomes.

<span class="mw-page-title-main">Electrophoretic mobility shift assay</span>

An electrophoretic mobility shift assay (EMSA) or mobility shift electrophoresis, also referred as a gel shift assay, gel mobility shift assay, band shift assay, or gel retardation assay, is a common affinity electrophoresis technique used to study protein–DNA or protein–RNA interactions. This procedure can determine if a protein or mixture of proteins is capable of binding to a given DNA or RNA sequence, and can sometimes indicate if more than one protein molecule is involved in the binding complex. Gel shift assays are often performed in vitro concurrently with DNase footprinting, primer extension, and promoter-probe experiments when studying transcription initiation, DNA gang replication, DNA repair or RNA processing and maturation, as well as pre-mRNA splicing. Although precursors can be found in earlier literature, most current assays are based on methods described by Garner and Revzin and Fried and Crothers.

A restriction map is a map of known restriction sites within a sequence of DNA. Restriction mapping requires the use of restriction enzymes. In molecular biology, restriction maps are used as a reference to engineer plasmids or other relatively short pieces of DNA, and sometimes for longer genomic DNA. There are other ways of mapping features on DNA for longer length DNA molecules, such as mapping by transduction.

<span class="mw-page-title-main">Molecular-weight size marker</span> Set of standards

A molecular-weight size marker, also referred to as a protein ladder, DNA ladder, or RNA ladder, is a set of standards that are used to identify the approximate size of a molecule run on a gel during electrophoresis, using the principle that molecular weight is inversely proportional to migration rate through a gel matrix. Therefore, when used in gel electrophoresis, markers effectively provide a logarithmic scale by which to estimate the size of the other fragments.

<span class="mw-page-title-main">SYBR Green I</span> Dye used for molecular genetics

SYBR Green I (SG) is an asymmetrical cyanine dye used as a nucleic acid stain in molecular biology. The SYBR family of dyes is produced by Molecular Probes Inc., now owned by Thermo Fisher Scientific. SYBR Green I binds to DNA. The resulting DNA-dye-complex best absorbs 497 nanometer blue light and emits green light. The stain preferentially binds to double-stranded DNA, but will stain single-stranded (ss) DNA with lower performance. SYBR Green can also stain RNA with a lower performance than ssDNA.

<span class="mw-page-title-main">Electrophoretic color marker</span>

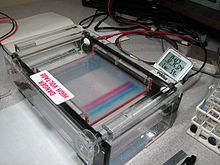
An electrophoretic color marker is a chemical used to monitor the progress of agarose gel electrophoresis and polyacrylamide gel electrophoresis (PAGE) since DNA, RNA, and most proteins are colourless. The color markers are made up of a mixture of dyes that migrate through the gel matrix alongside the sample of interest. They are typically designed to have different mobilities from the sample components and to generate colored bands that can be used to assess the migration and separation of sample components.

<span class="mw-page-title-main">Affinity electrophoresis</span>

Affinity electrophoresis is a general name for many analytical methods used in biochemistry and biotechnology. Both qualitative and quantitative information may be obtained through affinity electrophoresis. Cross electrophoresis, the first affinity electrophoresis method, was created by Nakamura et al. Enzyme-substrate complexes have been detected using cross electrophoresis. The methods include the so-called electrophoretic mobility shift assay, charge shift electrophoresis and affinity capillary electrophoresis. The methods are based on changes in the electrophoretic pattern of molecules through biospecific interaction or complex formation. The interaction or binding of a molecule, charged or uncharged, will normally change the electrophoretic properties of a molecule. Membrane proteins may be identified by a shift in mobility induced by a charged detergent. Nucleic acids or nucleic acid fragments may be characterized by their affinity to other molecules. The methods have been used for estimation of binding constants, as for instance in lectin affinity electrophoresis or characterization of molecules with specific features like glycan content or ligand binding. For enzymes and other ligand-binding proteins, one-dimensional electrophoresis similar to counter electrophoresis or to "rocket immunoelectrophoresis", affinity electrophoresis may be used as an alternative quantification of the protein. Some of the methods are similar to affinity chromatography by use of immobilized ligands.

<span class="mw-page-title-main">Gel doc</span>

A gel doc, also known as a gel documentation system, gel image system or gel imager, refers to equipment widely used in molecular biology laboratories for the imaging and documentation of nucleic acid and protein suspended within polyacrylamide or agarose gels. Genetic information is stored in DNA. Polyacrylamide or agarose gel electrophoresis procedures are carried out to examine nucleic acids or proteins in order to analyze the genetic data. For protein analysis, two-dimensional gel electrophoresis is employed (2-DGE) which is one of the methods most frequently used in comparative proteomic investigations that can distinguish thousands of proteins in a single run. Proteins are separated using 2-DGE first, based on their isoelectric points (pIs) in one dimension and then based on their molecular mass in the other. After that, a thorough qualitative and quantitative analysis of the proteomes is performed using gel documentation with software image assessment methods on the 2-DGE gels stained for protein visibility. Gels are typically stained with Ethidium bromide or other nucleic acid stains such as GelGreen.

<span class="mw-page-title-main">SDS-PAGE</span> Biochemical technique

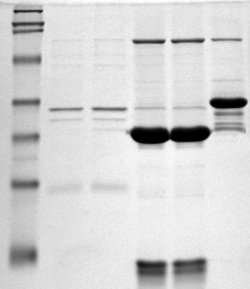
SDS-PAGE is a discontinuous electrophoretic system developed by Ulrich K. Laemmli which is commonly used as a method to separate proteins with molecular masses between 5 and 250 kDa. The combined use of sodium dodecyl sulfate and polyacrylamide gel eliminates the influence of structure and charge, and proteins are separated by differences in their size. At least up to 2012, the publication describing it was the most frequently cited paper by a single author, and the second most cited overall.

<span class="mw-page-title-main">SYBR Gold</span> Chemical compound

SYBR Gold is an asymmetrical cyanine dye. It can be used as a stain for double-stranded DNA, single-stranded DNA, and RNA. SYBR Gold is the most sensitive fluorescent stain of the SYBR family of dyes for the detection of nucleic acids. The SYBR family of dyes is produced by Molecular Probes Inc., now owned by Thermo Fisher Scientific

References

  1. Kryndushkin DS, Alexandrov IM, Ter-Avanesyan MD, Kushnirov VV (December 2003). "Yeast [PSI+] prion aggregates are formed by small Sup35 polymers fragmented by Hsp104". The Journal of Biological Chemistry. 278 (49): 49636–43. doi: 10.1074/jbc.M307996200 . PMID   14507919.
  2. Sambrook J, Russel DW (2001). Molecular Cloning: A Laboratory Manual 3rd Ed. Cold Spring Harbor Laboratory Press. Cold Spring Harbor, NY.
  3. Joseph Sambrook; David Russell. "Chapter 5, protocol 1". Molecular Cloning - A Laboratory Manual. Vol. 1 (3rd ed.). p. 5.4. ISBN   978-0-87969-577-4.
  4. 1 2 3 4 Zimm BH, Levene SD (May 1992). "Problems and prospects in the theory of gel electrophoresis of DNA" (PDF). Quarterly Reviews of Biophysics. 25 (2): 171–204. doi:10.1017/s0033583500004662. PMID   1518924. S2CID   27976751.
  5. Jean-Louis Viovy (2000). "Electrophoresis of DNA and other polyelectrolytes: Physical mechanisms". Reviews of Modern Physics. 72 (3): 813–872. Bibcode:2000RvMP...72..813V. doi:10.1103/RevModPhys.72.813.
  6. 1 2 Philip Serwer (1983). "Agarose gels: Properties and use for electrophoresis". Electrophoresis. 4 (6): 375–382. doi:10.1002/elps.1150040602. S2CID   97819634.
  7. Joseph Sambrook; David Russell. "Chapter 5, protocol 1". Molecular Cloning - A Laboratory Manual. Vol. 1 (3rd ed.). p. 5.2–5.3. ISBN   978-0-87969-577-4.
  8. "Appendix B: Agarose Physical Chemistry" (PDF). Lonza Group. Archived (PDF) from the original on 2022-10-09.
  9. Joseph Sambrook; David Russell. "Chapter 5, protocol 1". Molecular Cloning - A Laboratory Manual. Vol. 1 (3rd ed.). p. 5.7. ISBN   978-0-87969-577-4.
  10. Keren, David (26 September 2003). Protein Electrophoresis in Clinical Diagnosis. CRC Press. pp. 7–8. ISBN   978-0340812136.
  11. G. Lucotte; F. Baneyx (1993). Introduction to Molecular Cloning Techniques. Wiley-Blackwell. p. 32. ISBN   978-0471188490.
  12. 1 2 3 4 5 6 Lee PY, Costumbrado J, Hsu CY, Kim YH (April 2012). "Agarose gel electrophoresis for the separation of DNA fragments". Journal of Visualized Experiments (62). doi:10.3791/3923. PMC   4846332 . PMID   22546956.
  13. Richard R. Sinden (1994-11-24). DNA Structure and Function. Academic Press Inc. p. 97. ISBN   978-0126457506.
  14. 1 2 Joseph Sambrook; David Russell. "Chapter 5, protocol 1". Molecular Cloning - A Laboratory Manual. Vol. 1 (3rd ed.). p. 5.5–5.6. ISBN   978-0-87969-577-4.
  15. Aaij C, Borst P (May 1972). "The gel electrophoresis of DNA". Biochimica et Biophysica Acta (BBA) - Nucleic Acids and Protein Synthesis. 269 (2): 192–200. doi:10.1016/0005-2787(72)90426-1. PMID   5063906.
  16. Donald Voet; Judith G. Voet (1995). Biochemistry (2nd ed.). John Wiley & Sons. pp.  877–878. ISBN   978-0471586517.
  17. Blasiak J, Trzeciak A, Malecka-Panas E, Drzewoski J, Wojewódzka M (August 2000). "In vitro genotoxicity of ethanol and acetaldehyde in human lymphocytes and the gastrointestinal tract mucosa cells". Toxicology in Vitro. 14 (4): 287–95. doi:10.1016/S0887-2333(00)00022-9. PMID   10906435.
  18. Lu Y, Morimoto K (July 2009). "Is habitual alcohol drinking associated with reduced electrophoretic DNA migration in peripheral blood leukocytes from ALDH2-deficient male Japanese?". Mutagenesis. 24 (4): 303–8. doi: 10.1093/mutage/gep008 . PMID   19286920.
  19. G. Lucotte; F. Baneyx (1993). Introduction to Molecular Cloning Techniques. Wiley-Blackwell. p. 41. ISBN   978-0471188490.
  20. Robert W. Old; Sandy B. Primrose (1994-09-27). Principle of Gene Manipulation - An Introduction to Genetic Engineering (5th ed.). Blackwell Scientific. p.  9. ISBN   9780632037124.
  21. Li Zhu; Hong Wang (2009-03-02). "Chapter 4 - Genetic Analysis in Miniaturized Electrophoresis Systems". In Tian, Wei-Cheng; Finehout, Erin (eds.). Microfluidics for Biological Applications. Springer. p. 125. ISBN   978-0-387-09480-9.
  22. Smith SB, Aldridge PK, Callis JB (January 1989). "Observation of individual DNA molecules undergoing gel electrophoresis". Science. 243 (4888): 203–6. Bibcode:1989Sci...243..203S. doi:10.1126/science.2911733. PMID   2911733.
  23. Schwartz DC, Koval M (April 1989). "Conformational dynamics of individual DNA molecules during gel electrophoresis". Nature. 338 (6215): 520–2. Bibcode:1989Natur.338..520S. doi:10.1038/338520a0. PMID   2927511. S2CID   4249063.
  24. Magdeldin, Sameh (2012). Gel Electrophoresis. InTech. pp. 35–40.
  25. "Agarose gel electrophoresis (basic method)". Biological Protocols. Retrieved 23 August 2011.
  26. Fotadar U, Shapiro LE, Surks MI (February 1991). "Simultaneous use of standard and low-melting agarose for the separation and isolation of DNA by electrophoresis". BioTechniques. 10 (2): 171–2. PMID   2059440.
  27. David Freifelder (1982). Physical Biochemistry: Applications to Biochemistry and Molecular Biology (2nd ed.). WH Freeman. pp. 292–293. ISBN   978-0716714446.
  28. "Section III: Loading and Running DNA in Agarose Gels" (PDF). Lonza Group. Archived (PDF) from the original on 2022-10-09.
  29. "DNA revealed" (PDF). National Centre for Biotechnology education. University of Reading. Archived from the original (PDF) on 2012-03-04.
  30. Gründemann D, Schömig E (November 1996). "Protection of DNA during preparative agarose gel electrophoresis against damage induced by ultraviolet light". BioTechniques. 21 (5): 898–903. doi: 10.2144/96215rr02 . PMID   8922632.
  31. Sameh Magdeldin, ed. (2012). Gel electrophoresis – Principles and Basics. InTech. ISBN   978-953-51-0458-2.
  32. Brody JR, Kern SE (October 2004). "History and principles of conductive media for standard DNA electrophoresis" (PDF). Analytical Biochemistry. 333 (1): 1–13. doi:10.1016/j.ab.2004.05.054. PMID   15351274. Archived from the original (PDF) on 24 December 2012.
  33. Jeppsson JO, Laurell CB, Franzén B (April 1979). "Agarose gel electrophoresis". Clinical Chemistry. 25 (4): 629–38. doi: 10.1093/clinchem/25.4.629 . PMID   313856.
  34. Mészáros, Éva (2021). "Determine the concentration and purity of nucleic acids". INTEGRA Biosciences.
  35. Giot, Jean-Francois (2010). "Agarose gel electrophoresis: Application in Clinical Chemistry" (PDF). Journal of Medical Biochemistry. 29: 9–14. doi: 10.2478/v10011-009-0033-8 . S2CID   94646249. Archived (PDF) from the original on 2022-10-09.