Brain morphometry

Last updated

Brain morphometry is a subfield of both morphometry and the brain sciences, concerned with the measurement of brain structures and changes thereof during development, aging, learning, disease and evolution. Since autopsy-like dissection is generally impossible on living brains, brain morphometry starts with noninvasive neuroimaging data, typically obtained from magnetic resonance imaging (MRI). These data are born digital, which allows researchers to analyze the brain images further by using advanced mathematical and statistical methods such as shape quantification or multivariate analysis. This allows researchers to quantify anatomical features of the brain in terms of shape, mass, volume (e.g. of the hippocampus, or of the primary versus secondary visual cortex), and to derive more specific information, such as the encephalization quotient, grey matter density and white matter connectivity, gyrification, cortical thickness, or the amount of cerebrospinal fluid. These variables can then be mapped within the brain volume or on the brain surface, providing a convenient way to assess their pattern and extent over time, across individuals or even between different biological species. The field is rapidly evolving along with neuroimaging techniqueswhich deliver the underlying databut also develops in part independently from them, as part of the emerging field of neuroinformatics, which is concerned with developing and adapting algorithms to analyze those data.

Contents

Background

Terminology

The term brain mapping is often used interchangeably with brain morphometry, although mapping in the narrower sense of projecting properties of the brain onto a template brain is, strictly speaking, only a subfield of brain morphometry. On the other hand, though much more rarely, neuromorphometry is also sometimes used as a synonym for brain morphometry (particularly in the earlier literature, e.g. Haug 1986), though technically is only one of its subfields.

Biology

The morphology and function of a complex organ like the brain are the result of numerous biochemical and biophysical processes interacting in a highly complex manner across multiple scales in space and time (Vallender et al., 2008). Most of the genes known to control these processes during brain development, maturation and aging are highly conserved (Holland, 2003), though some show polymorphisms (cf. Meda et al., 2008), and pronounced differences at the cognitive level abound even amongst closely related species, or between individuals within a species (Roth and Dicke, 2005).

In contrast, variations in macroscopic brain anatomy (i.e., at a level of detail still discernible by the naked human eye) are sufficiently conserved to allow for comparative analyses, yet diverse enough to reflect variations within and between individuals and species: As morphological analyses that compare brains at different onto-genetic or pathogenic stages can reveal important information about the progression of normal or abnormal development within a given species, cross-species comparative studies have a similar potential to reveal evolutionary trends and phylogenetic relationships.

Given that the imaging modalities commonly employed for brain morphometric investigations are essentially of a molecular or even sub-atomic nature, a number of factors may interfere with derived quantification of brain structures. These include all of the parameters mentioned in "Applications" but also the state of hydration, hormonal status, medication and substance abuse.

Technical requirements

There are two major prerequisites for brain morphometry: First, the brain features of interest must be measurable, and second, statistical methods have to be in place to compare the measurements quantitatively. Shape feature comparisons form the basis of Linnaean taxonomy, and even in cases of convergent evolution or brain disorders, they still provide a wealth of information about the nature of the processes involved. Shape comparisons have long been constrained to simple and mainly volume- or slice-based measures but profited enormously from the digital revolution, as now all sorts of shapes in any number of dimensions can be handled numerically.

In addition, though the extraction of morphometric parameters like brain mass or liquor volume may be relatively straightforward in post mortem samples, most studies in living subjects will by necessity have to use an indirect approach: A spatial representation of the brain or its components is obtained by some appropriate neuroimaging technique, and the parameters of interest can then be analyzed on that basis. Such a structural representation of the brain is also a prerequisite for the interpretation of functional neuroimaging.

The design of a brain morphometric study depends on multiple factors that can be roughly categorized as follows: First, depending on whether ontogenetic, pathological or phylogenetic issues are targeted, the study can be designed as longitudinal (within the same brain, measured at different times), or cross-sectional (across brains). Second, brain image data can be acquired using different neuroimaging modalities. Third, brain properties can be analyzed at different scales (e.g. in the whole brain, regions of interest, cortical or subcortical structures). Fourth, the data can be subjected to different kinds of processing and analysis steps. Brain morphometry as a discipline is mainly concerned with the development of tools addressing this fourth point and integration with the previous ones.

Methodologies

With the exception of the usually slice-based histology of the brain, neuroimaging data are generally stored as matrices of voxels. The most popular morphometric method, thus, is known as Voxel-based morphometry (VBM; cf. Wright et al., 1995; Ashburner and Friston, 2000; Good et al., 2001). Yet as an imaging voxel is not a biologically meaningful unit, other approaches have been developed that potentially bear a closer correspondence to biological structures: Deformation-based morphometry (DBM), surface-based morphometry (SBM) and fiber tracking based on diffusion-weighted imaging (DTI or DSI). All four are usually performed based on Magnetic Resonance (MR) imaging data, with the former three commonly using T1-weighted (e.g. Magnetization Prepared Rapid Gradient Echo, MP-RAGE) and sometimes T2-weighted pulse sequences, while DTI/DSI use diffusion-weighted ones. However, recent evaluation of morphometry algorithms/software demonstrates inconsistency among several of them. [1] This renders a need for systematic and quantitative validation and evaluation of the field.

T1-weighted MR-based brain morphometry

Preprocessing

MR images are generated by a complex interaction between static and dynamic electromagnetic fields and the tissue of interest, namely the brain that is encapsulated in the head of the subject. Hence, the raw images contain noise from various sources—namely head movements (a scan suitable for morphometry typically takes on the order of 10 min) that can hardly be corrected or modeled, and bias fields (neither of the electromagnetic fields involved is homogeneous across the whole head nor brain) which can be modeled.

In the following, the image is segmented into non-brain and brain tissue, with the latter usually being sub-segmented into at least gray matter (GM), white matter (WM) and cerebrospinal fluid (CSF). Since image voxels near the class boundaries do not generally contain just one kind of tissue, partial volume effects ensue that can be corrected for.

For comparisons across different scans (within or across subjects), differences in brain size and shape are eliminated by spatially normalizing (i.e. registering) the individual images to the stereotactic space of a template brain. Registration can be performed using low-resolution (i.e. rigid-body or affine transformations) or high-resolution (i.e. highly non-linear) methods, and templates can be generated from the study's pool of brains, from a brain atlas or a derived template generator.

Both the registered images and the deformation fields generated upon registration can be used for morphometric analyses, thereby providing the basis for Voxel-Based Morphometry (VBM) and Deformation-Based Morphometry (DBM). Images segmented into tissue classes can also be used to convert segmentation boundaries into parametric surfaces, the analysis of which is the focus of Surface-Based Morphometry (SBM).

Voxel-based morphometry

After the individual images are segmented, they are registered to the template. Each voxel then contains a measure of the probability, according to which it belongs to a specific segmentation class. For gray matter, this quantity is usually referred to as gray matter density (GMD) or gray matter concentration (GMC), or gray matter probability (GMP).

In order to correct for the volume changes due to the registration, the gray matter volume (GMV) in the original brain can be calculated by multiplying the GMD with the Jacobian determinants of the deformations used to register the brain to the template. Class-specific volumes for WM and CSF are defined analogously.

The local differences in the density or volume of the different segmentation classes can then be statistically analyzed across scans and interpreted in anatomical terms (e.g. as gray matter atrophy). Since VBM is available for many of the major neuroimaging software packages (e.g. FSL and SPM), it provides an efficient tool to test or generate specific hypotheses about brain changes over time. It is noteworthy, that unlike DBM, considerable criticism and words of caution regarding the correct interpretation of VBM results has been leveled by the medical image computing community [2] [3]

Deformation-based morphometry

In DBM, highly non-linear registration algorithms are used, and the statistical analyses are not performed on the registered voxels but on the deformation fields used to register them (which requires multivariate approaches) or derived scalar properties thereof, which allows for univariate approaches. One common variant—sometimes referred to as Tensor-based morphometry (TBM)is based on the Jacobian determinant of the deformation matrix.

Of course, multiple solutions exist for such non-linear warping procedures, and to balance appropriately between the potentially opposing requirements for global and local shape fit, ever more sophisticated registration algorithms are being developed. Most of these, however, are computationally expensive if applied with a high-resolution grid. The biggest advantage of DBM with respect to VBM is its ability to detect subtle changes in longitudinal studies. However, due to the vast variety of registration algorithms, no widely accepted standard for DBM exists, which also prevented its incorporation into major neuroimaging software packages.

Pattern based morphometry

Pattern based morphometry (PBM) is a method of brain morphometry first put forth in PBM. [4] It builds upon DBM and VBM. PBM is based on the application of sparse dictionary learning to morphometry. As opposed to typical voxel based approaches which depend on univariate statistical tests at specific voxel locations, PBM extracts multivariate patterns directly from the entire image. The advantage of this is that the inferences are not made locally as in VBM or DBM but globally. This allows the method to detect if combinations of voxels are better suited to separate the groups being studied rather than single voxels. Also the method is more robust to variations in the underlying registration algorithms as compared to typical DBM analysis

Surface-based morphometry

Once the brain is segmented, the boundary between different classes of tissue can be reconstructed as a surface on which morphometric analysis can proceed (e.g. towards gyrification), or onto which results of such analyses can be projected.

Diffusion-weighted MR-based brain morphometry

Fiber-tracking techniques

Nerve fiber-tracking techniques are the latest offspring of this suite of MR-based morphological approaches. They determine the tract of nerve fibers within the brain by means of diffusion tensor imaging or diffusion-spectrum imaging (e.g. Douaud et al., 2007 and O'Donnell et al., 2009).

Diffeomorphometry

Diffeomorphometry [5] is the focus on comparison of shapes and forms with a metric structure based on diffeomorphisms, and is central to the field of computational anatomy. [6] Diffeomorphic registration, [7] introduced in the 90's, is now an important player that uses computational procedures for constructing correspondences between coordinate systems based on sparse features and dense images, such as ANTS, [8] DARTEL, [9] DEMONS, [10] LDDMM, [11] or StationaryLDDMM. [12] Voxel-based morphometry (VBM) is an important method built on many of these principles. Methods based on diffeomorphic flows are used in For example, deformations could be diffeomorphisms of the ambient space, resulting in the LDDMM (Large Deformation Diffeomorphic Metric Mapping) framework for shape comparison. [13] One such deformation is the right invariant metric of computational anatomy which generalizes the metric of non-compressible Eulerian flows to include the Sobolev norm, ensuring smoothness of the flows. [14] Metrics have also been defined that are associated to Hamiltonian controls of diffeomorphic flows. [15]

Applications

The qualitatively largest changes within an individual generally occur during early development and more subtle ones during aging and learning, while pathological changes can vary highly in their extent and interindividual differences increase both during and across lifetimes. The above-described morphometric methods provide the means to analyze such changes quantitatively, and MR imaging has been applied to ever more brain populations relevant to these time scales, both within humans and across species. Currently, however, most applications of MR-based brain morphometry have a clinical focus, i.e. they help to diagnose and monitor neuropsychiatric disorders, in particular neurodegenerative diseases (like Alzheimer) or psychotic disorders (like schizophrenia).

Brain development

MR imaging is rarely performed during pregnancy and the neonatal period, in order to avoid stress for mother and child. In the cases of birth complications and other clinical events, however, such data are being acquired. For instance, Dubois et al., 2008 analyzed gyrification in premature newborns at birth and found it to be predictive of a functional score at term-equivalent age, and Serag et al. [16] built a 4D atlas of the developing neonatal brain which has led to the construction of brain growth curves from 28–44 weeks’ postmenstrual age. Beyond preterms, there have been a number of large-scale longitudinal MR-morphometric studies (often combined with cross-sectional approaches and other neuroimaging modalities) of normal brain development in humans. [17] Using voxel-based and a number of complementary approaches, these studies revealed (or non-invasively confirmed, from the perspective of previous histological studies which cannot be longitudinal) that brain maturation involves differential growth of gray and white matter, that the time course of the maturation is not linear and that it differs markedly across brain regions. [18] In order to interpret these findings, cellular processes have to be taken into consideration, especially those governing the pruning of axons, dendrites and synapses until an adult pattern of whole-brain connectivity is achieved (which can best be monitored using diffusion-weighted techniques).

Aging

While white matter increases throughout early development and adolescence, and gray matter decreases in that period generally do not involve neuronal cell bodies, the situation is different beyond the age of about 50 years when atrophy affects gray and possibly also white matter. The most convincing explanation for this is that individual neurons die, leading to the loss of both their cell bodies (i.e. gray matter) and their myelinated axons (i.e. white matter). The gray matter changes can be observed via both gray matter density and gyrification. That the white matter loss is not nearly as clear as that for gray matter indicates that changes also occur in non-neural tissue, e.g. the vasculature or microglia.

Learning and plasticity

Perhaps the most profound impact to date of brain morphometry on our understanding of the relationships between brain structure and function has been provided by a series of VBM studies targeted at proficiency in various performances: Licensed taxicab drivers in London were found to exhibit bilaterally increased gray matter volume in the posterior part of the hippocampus, both relative to controls from the general population [19] and to London bus drivers matched for driving experience and stress levels. Similarly, gray matter changes were also found to correlate with professional experience in musicians, mathematicians and meditators, and with second language proficiency.

What is more, bilateral gray matter changes in the posterior and lateral parietal cortex of medical students memorizing for an intermediate exam could be detected over a period of just three months.

These studies of professional training inspired questions about the limits of MR-based morphometry in terms of time periods over which structural brain changes can be detected. Important determinants of these limits are the speed and spatial extent of the changes themselves. Of course, some events like accidents, a stroke, a tumor metastasis or a surgical intervention can profoundly change brain structure during very short periods, and these changes can be visualized with MR and other neuroimaging techniques. Given the time constraints under such conditions, brain morphometry is rarely involved in diagnostics but rather used for progress monitoring over periods of weeks and months and longer.

One study found that juggling novices showed a bilateral gray matter expansion in the medial temporal visual area (also known as V5) over a three-month period during which they had learned to sustain a three-ball cascade for at least a minute. No changes were observed in a control group that did not engage in juggling. The extent of these changes in the jugglers reduced during a subsequent three-month period in which they did not practice juggling. To further resolve the time course of these changes, the experiment was repeated with another young cohort scanned in shorter intervals, and the by then typical changes in V5 could already be found after just seven days of juggling practice. The observed changes were larger in the initial learning phase than during continued training.

Whereas the former two studies involved students in their early twenties, the experiments were recently repeated with an elderly cohort, revealing the same kind of structural changes, although attenuated by lower juggling performance of this group. [20]

Using a completely different kind of intervention—application of Transcranial Magnetic Stimulation in daily sessions over five days—changes were observed in and near the TMS target areas as well as in the basal ganglia of volunteers in their mid-twenties, compared to a control group that had received placebo. It is possible, though, that these changes simply reflect vascularization effects.

Taken together, these morphometric studies strongly support the notion that brain plasticity—changes of brain structure—remains possible throughout life and may well be an adaptation to changes in brain function which has also been shown to change with experience. The title of this section was meant to emphasize this, namely that plasticity and learning provide two perspectives—functional and structural—at the same phenomenon, a brain that changes over time.

Brain disease

Brain diseases are the field to which brain morphometry is most often applied, and the volume of the literature on this is vast.

Brain evolution

Brain changes also accumulate over periods longer than an individual life but even though twin studies have established that human brain structure is highly heritable, brain morphometric studies with such a broadened scope are rare. However, in the context of disorders with a known or suspected hereditary component, a number of studies have compared the brain morphometry of patients with both that of non-affected controls and that of subjects at high risk for developing the disorder. The latter group usually includes family members.

Even larger time gaps can be bridged by comparing human populations with a sufficiently long history of genetic separation, such as Central Europeans and Japanese. One surface-based study compared the brain shape between these two groups and found a difference in their gender-dependent brain asymmetries. Neuroimaging studies of this kind, combined with functional ones and behavioural data, provide promising and so far largely unexplored avenues to understand similarities and differences between different groups of people.

Like morphological analyses that compare brains at different ontogenetic or pathogenetic stages can reveal important information about normal or abnormal development within a given species, cross-species comparative studies have a similar potential to reveal evolutionary trends and phylogenetic relationships. Indeed, shape comparisons (though historically with an emphasis on qualitative criteria) formed the basis of biological taxonomy before the era of genetics. Three principal sources exist for comparative evolutionary investigations: Fossils, fresh-preserved post-mortem or in vivo studies.

The fossil record is dominated by structures that were already biomineralized during the lifetime of the respective organism (in the case of vertebrates, mainly teeth and bones). Brains, like other soft tissues, rarely fossilize, but occasionally they do. The probably oldest vertebrate brain known today belonged to a ratfish that lived around 300 million years ago (Pradel et al., 2009). While the technique most widely used to image fossils is computed tomography (CT), this particular specimen was imaged by synchrotron tomography, and recent MR imaging studies with fossils suggest that the method may be used to image at least a subset of fossilized brains.

MR images have also been obtained from the brain of a 3200-year-old Egyptian mummy. The perspectives are slim, however, that any three-dimensional imaging dataset of a fossil, semi-fossil or mummified brain will ever be of much use to morphometric analyses of the kind described here, since the processes of mummification and fossilization heavily alter the structure of soft tissues in a way specific to the individual specimen and subregions therein.

Postmortem samples of living or recently extinct species, on the other hand, generally allow to obtain MR image qualities sufficient for morphometric analyses, though preservation artifacts would have to be taken into account. Previous MR imaging studies include specimens preserved in formalin, [21] by freezing, [22] or in alcohol. [23]

The third line of comparative evidence would be cross-species in vivo MR imaging studies like the one by Rilling & Insel (1998), who investigated brains from eleven primate species by VBM in order to shed new light on primate brain evolution. Other studies have combined morphometric with behavioural measures, and brain evolution does not only concern primates: Gyrification occurs across mammalian brains if they reach a size of several centimeterswith cetaceans dominating the upper end of the spectrumand generally increases slowly with overall brain size, following a power law.

Related Research Articles

<span class="mw-page-title-main">Grey matter</span> Areas of neuronal cell bodies in the brain

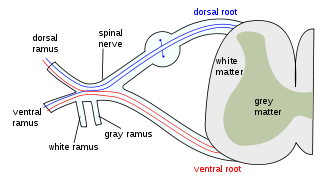
Grey matter, or gray matter in American English, is a major component of the central nervous system, consisting of neuronal cell bodies, neuropil, glial cells, synapses, and capillaries. Grey matter is distinguished from white matter in that it contains numerous cell bodies and relatively few myelinated axons, while white matter contains relatively few cell bodies and is composed chiefly of long-range myelinated axons. The colour difference arises mainly from the whiteness of myelin. In living tissue, grey matter actually has a very light grey colour with yellowish or pinkish hues, which come from capillary blood vessels and neuronal cell bodies.

<span class="mw-page-title-main">Image registration</span> Mapping of data into a single system

Image registration is the process of transforming different sets of data into one coordinate system. Data may be multiple photographs, data from different sensors, times, depths, or viewpoints. It is used in computer vision, medical imaging, military automatic target recognition, and compiling and analyzing images and data from satellites. Registration is necessary in order to be able to compare or integrate the data obtained from these different measurements.

<span class="mw-page-title-main">Functional magnetic resonance imaging</span> MRI procedure that measures brain activity by detecting associated changes in blood flow

Functional magnetic resonance imaging or functional MRI (fMRI) measures brain activity by detecting changes associated with blood flow. This technique relies on the fact that cerebral blood flow and neuronal activation are coupled. When an area of the brain is in use, blood flow to that region also increases.

Neuroscience and intelligence refers to the various neurological factors that are partly responsible for the variation of intelligence within species or between different species. A large amount of research in this area has been focused on the neural basis of human intelligence. Historic approaches to studying the neuroscience of intelligence consisted of correlating external head parameters, for example head circumference, to intelligence. Post-mortem measures of brain weight and brain volume have also been used. More recent methodologies focus on examining correlates of intelligence within the living brain using techniques such as magnetic resonance imaging (MRI), functional MRI (fMRI), electroencephalography (EEG), positron emission tomography and other non-invasive measures of brain structure and activity.

<span class="mw-page-title-main">Morphometrics</span> Quantitative study of size and shape

Morphometrics or morphometry refers to the quantitative analysis of form, a concept that encompasses size and shape. Morphometric analyses are commonly performed on organisms, and are useful in analyzing their fossil record, the impact of mutations on shape, developmental changes in form, covariances between ecological factors and shape, as well for estimating quantitative-genetic parameters of shape. Morphometrics can be used to quantify a trait of evolutionary significance, and by detecting changes in the shape, deduce something of their ontogeny, function or evolutionary relationships. A major objective of morphometrics is to statistically test hypotheses about the factors that affect shape.

Functional integration is the study of how brain regions work together to process information and effect responses. Though functional integration frequently relies on anatomic knowledge of the connections between brain areas, the emphasis is on how large clusters of neurons – numbering in the thousands or millions – fire together under various stimuli. The large datasets required for such a whole-scale picture of brain function have motivated the development of several novel and general methods for the statistical analysis of interdependence, such as dynamic causal modelling and statistical linear parametric mapping. These datasets are typically gathered in human subjects by non-invasive methods such as EEG/MEG, fMRI, or PET. The results can be of clinical value by helping to identify the regions responsible for psychiatric disorders, as well as to assess how different activities or lifestyles affect the functioning of the brain.

<span class="mw-page-title-main">Analysis of Functional NeuroImages</span>

Analysis of Functional NeuroImages (AFNI) is an open-source environment for processing and displaying functional MRI data—a technique for mapping human brain activity.

In neuroimaging, spatial normalization is an image processing step, more specifically an image registration method. Human brains differ in size and shape, and one goal of spatial normalization is to deform human brain scans so one location in one subject's brain scan corresponds to the same location in another subject's brain scan.

<span class="mw-page-title-main">Talairach coordinates</span>

Talairach coordinates, also known as Talairach space, is a 3-dimensional coordinate system of the human brain, which is used to map the location of brain structures independent from individual differences in the size and overall shape of the brain. It is still common to use Talairach coordinates in functional brain imaging studies and to target transcranial stimulation of brain regions. However, alternative methods such as the MNI Coordinate System have largely replaced Talairach for stereotaxy and other procedures.

<span class="mw-page-title-main">Voxel-based morphometry</span> Computational neuroanatomy method

Voxel-based morphometry is a computational approach to neuroanatomy that measures differences in local concentrations of brain tissue, through a voxel-wise comparison of multiple brain images.

Statistical shape analysis is an analysis of the geometrical properties of some given set of shapes by statistical methods. For instance, it could be used to quantify differences between male and female gorilla skull shapes, normal and pathological bone shapes, leaf outlines with and without herbivory by insects, etc. Important aspects of shape analysis are to obtain a measure of distance between shapes, to estimate mean shapes from samples, to estimate shape variability within samples, to perform clustering and to test for differences between shapes. One of the main methods used is principal component analysis (PCA). Statistical shape analysis has applications in various fields, including medical imaging, computer vision, computational anatomy, sensor measurement, and geographical profiling.

Gyrification is the process of forming the characteristic folds of the cerebral cortex.

Seed-based d mapping or SDM is a statistical technique created by Joaquim Radua for meta-analyzing studies on differences in brain activity or structure which used neuroimaging techniques such as fMRI, VBM, DTI or PET. It may also refer to a specific piece of software created by the SDM Project to carry out such meta-analyses.

Karl John Friston FRS FMedSci FRSB is a British neuroscientist and theoretician at University College London. He is an authority on brain imaging and theoretical neuroscience, especially the use of physics-inspired statistical methods to model neuroimaging data and other random dynamical systems. Friston is a key architect of the free energy principle and active inference. In imaging neuroscience he is best known for statistical parametric mapping and dynamic causal modelling. In October 2022, he joined VERSES Inc, a California-based cognitive computing company focusing on artificial intelligence designed using the principles of active inference, as Chief Scientist.

Medical image computing (MIC) is an interdisciplinary field at the intersection of computer science, information engineering, electrical engineering, physics, mathematics and medicine. This field develops computational and mathematical methods for solving problems pertaining to medical images and their use for biomedical research and clinical care.

The parieto-frontal integration theory (P-FIT) considers intelligence to relate to how well different brain regions integrate to form intelligent behaviors. The theory proposes that large scale brain networks connect brain regions, including regions within frontal, parietal, temporal, and cingulate cortices, underlie the biological basis of human intelligence. These regions, which overlap significantly with the task-positive network, allow the brain to communicate and exchange information efficiently with one another. Support for this theory is primarily based on neuroimaging evidence, with support from lesion studies. The P-FIT is influential in that it explains the majority of current neuroimaging findings, as well as increasing empirical support for cognition being the result of large-scale brain networks, rather than numerous domain-specific processes or modules. A 2010 review of the neuroscience of intelligence described P-FIT as "the best available answer to the question of where in the brain intelligence resides".

Computational anatomy is an interdisciplinary field of biology focused on quantitative investigation and modelling of anatomical shapes variability. It involves the development and application of mathematical, statistical and data-analytical methods for modelling and simulation of biological structures.

Large deformation diffeomorphic metric mapping (LDDMM) is a specific suite of algorithms used for diffeomorphic mapping and manipulating dense imagery based on diffeomorphic metric mapping within the academic discipline of computational anatomy, to be distinguished from its precursor based on diffeomorphic mapping. The distinction between the two is that diffeomorphic metric maps satisfy the property that the length associated to their flow away from the identity induces a metric on the group of diffeomorphisms, which in turn induces a metric on the orbit of shapes and forms within the field of Computational Anatomy. The study of shapes and forms with the metric of diffeomorphic metric mapping is called diffeomorphometry.

Joaquim Radua is a Spanish psychiatrist and developer of methods for meta-analysis of neuroimaging studies. He has been named as one of the most cited researchers in Psychiatry / Psychology.

Arterial spin labeling (ASL), also known as arterial spin tagging, is a magnetic resonance imaging technique used to quantify cerebral blood perfusion by labelling blood water as it flows throughout the brain. ASL specifically refers to magnetic labeling of arterial blood below or in the imaging slab, without the need of gadolinium contrast. A number of ASL schemes are possible, the simplest being flow alternating inversion recovery (FAIR) which requires two acquisitions of identical parameters with the exception of the out-of-slice saturation; the difference in the two images is theoretically only from inflowing spins, and may be considered a 'perfusion map'. The ASL technique was developed by Alan P. Koretsky, Donald S. Williams, John A. Detre and John S. Leigh Jr in 1992.

References

  1. Gao, Yi; Riklin-Raviv, Tammy; Bouix, Sylvain (2014). "Shape analysis, a field in need of careful validation". Human Brain Mapping. 35 (10): 4965–4978. doi:10.1002/hbm.22525. PMC   6869375 . PMID   24753006. S2CID   16053716.
  2. Davatzikos, C. (2004). "Why voxel-based morphometric analysis should be used with great caution when characterizing group differences". NeuroImage. 23 (1): 17–20. doi:10.1016/j.neuroimage.2004.05.010. PMID   15325347. S2CID   7452089.
  3. Bookstein, F. L. (2001). ""Voxel-Based Morphometry" Should Not Be Used with Imperfectly Registered Images". NeuroImage. 14 (6): 1454–1462. doi:10.1006/nimg.2001.0770. PMID   11707101. S2CID   32486095.
  4. Gaonkar, B.; Pohl, K.; Davatzikos, C. (2011). "Pattern based morphometry". Medical Image Computing and Computer-Assisted Intervention. 14 (Pt 2): 459–466. doi:10.1007/978-3-642-23629-7_56. PMC   4373081 . PMID   21995061.
  5. Miller, Michael I.; Younes, Laurent; Trouvé, Alain (2013-11-18). "Diffeomorphometry and geodesic positioning systems for human anatomy". Technology. 2 (1): 36–43. doi:10.1142/S2339547814500010. ISSN   2339-5478. PMC   4041578 . PMID   24904924.
  6. Grenander, Ulf; Miller, Michael I. (1998-12-01). "Computational Anatomy: An Emerging Discipline". Q. Appl. Math. LVI (4): 617–694. doi: 10.1090/qam/1668732 . ISSN   0033-569X.
  7. Christensen, G. E.; Rabbitt, R. D.; Miller, M. I. (1996-01-01). "Deformable templates using large deformation kinematics". IEEE Transactions on Image Processing. 5 (10): 1435–1447. Bibcode:1996ITIP....5.1435C. doi:10.1109/83.536892. ISSN   1057-7149. PMID   18290061.
  8. "stnava/ANTs". GitHub. Retrieved 2015-12-11.
  9. Ashburner, John (2007-10-15). "A fast diffeomorphic image registration algorithm". NeuroImage. 38 (1): 95–113. doi:10.1016/j.neuroimage.2007.07.007. ISSN   1053-8119. PMID   17761438. S2CID   545830.
  10. "Software - Tom Vercauteren". sites.google.com. Retrieved 2015-12-11.
  11. "NITRC: LDDMM: Tool/Resource Info". www.nitrc.org. Retrieved 2015-12-11.
  12. "Publication:Comparing algorithms for diffeomorphic registration: Stationary LDDMM and Diffeomorphic Demons". www.openaire.eu. Archived from the original on 2016-02-16. Retrieved 2015-12-11.
  13. F. Beg; M. Miller; A. Trouvé; L. Younes (February 2005). "Computing Large Deformation Metric Mappings via Geodesic Flows of Diffeomorphisms". International Journal of Computer Vision. 61 (2): 139–157. doi:10.1023/b:visi.0000043755.93987.aa. S2CID   17772076.
  14. Miller, M. I.; Younes, L. (2001-01-01). "Group Actions, Homeomorphisms, And Matching: A General Framework". International Journal of Computer Vision. 41: 61–84. CiteSeerX   10.1.1.37.4816 . doi:10.1023/A:1011161132514. S2CID   15423783.
  15. Miller, Michael I.; Trouvé, Alain; Younes, Laurent (2015-01-01). "Hamiltonian Systems and Optimal Control in Computational Anatomy: 100 Years Since D'Arcy Thompson". Annual Review of Biomedical Engineering. 17: 447–509. doi:10.1146/annurev-bioeng-071114-040601. ISSN   1545-4274. PMID   26643025.
  16. Serag, A.; Aljabar, P.; Ball, G.; Counsell, S.J.; Boardman, J.P.; Rutherford, M.A.; Edwards, A.D.; Hajnal, J.V.; Rueckert, D. (2012). "Construction of a consistent high-definition spatio-temporal atlas of the developing brain using adaptive kernel regression". NeuroImage. 59 (3): 2255–2265. doi:10.1016/j.neuroimage.2011.09.062. PMID   21985910. S2CID   9747334.
  17. most notably by \citet{Giedd:1999p24137} and \citet{Thompson:2000p55997} and, more recently, by \citet{Evans:2006p33597} and \citet{Almli:2007p24135}
  18. For reviews of MR morphometric studies of brain maturation, see \citet[][focused on adolescence]{Paus:2005p1501} and \citet[][from early development onto adolescence]{Toga:2006p816,Lenroot:2006p56183
  19. \citep{Maguire:2000p10353}
  20. \citep{Boyke:2008p2916}
  21. \citep[][human and elephant brains]{Pfefferbaum:2004p4074,Hakeem:2005p39953}
  22. \citep[][kiwi brains]{Corfield:2008p45053}
  23. \citep[][carps]{Chanet:2009p51744}.