This article needs to be updated.(February 2021) |
This article needs to be updated.(February 2021) |
The map data is from year 2013, where data is available, from the World Bank. [1] Numbers are in percentage.
The table uses an interval of years from the World Bank. [2] Numbers are in percentage.
| Country | 2010 | 2011 | 2012 | 2013 | 2014 | 2015 | 2016 | 2017 | 2018 | 2019 | 2020 | |
|---|---|---|---|---|---|---|---|---|---|---|---|---|
| | 63.239 | 61.503 | 57.754 | 56.395 | 61.422 | |||||||
| | 70.267 | 69.154 | 67.303 | 66.254 | 64.813 | 65.662 | 66.86 | 66.19 | 67.26 | 67.21 | 66.22 | 63.61 |
| | 91.996 | 91.392 | 91.047 | 90.672 | 92.440 | 99.68 | 99.61 | 99.29 | 99.41 | 99.27 | 99.20 | |
| | 72.794 | 70.254 | 71.116 | 70.820 | 72.653 | 75.871 | 84.09 | 78.98 | 79.19 | 83.43 | 78.20 | 75.33 |
| | 91.653 | 93.997 | 91.948 | 92.504 | 77.522 | |||||||
| | 73.165 | 75.044 | 72.187 | 70.208 | 71.046 | 71.69 | 71.72 | 73.90 | 69.55 | 70.17 | 67.52 | |
| | 74.295 | 74.637 | 72.238 | 71.303 | 70.704 | 78.50 | 77.41 | 80.94 | 74.41 | 77.24 | 75.99 | |
| | 95.391 | 94.894 | 94.166 | 92.991 | 92.906 | 96.14 | 96.30 | 96.34 | 96.12 | 95.68 | 93.48 | |
| | 80.560 | 79.287 | 77.201 | 77.182 | 75.279 | 77.735 | 80.89 | 79.42 | 78.78 | 78.03 | 75.76 | |
| | 78.274 | 74.822 | 70.862 | 70.259 | 67.705 | 64.927 | ||||||
| | 20.575 | 18.878 | 19.560 | 17.199 | 14.490 | 13.056 | ||||||
| | 48.800 | 46.989 | 43.033 | 42.627 | 42.183 | 40.208 | ||||||
| | 49.836 | 48.677 | 49.012 | 48.544 | 46.226 | 46.488 | ||||||
| | 79.560 | 80.370 | 80.625 | 81.088 | 79.711 | 78.863 | ||||||
| | 90.386 | 90.853 | 90.148 | 88.001 | 86.049 | 82.575 | ||||||
| | 74.272 | 73.294 | 71.786 | 69.550 | 68.192 | 69.550 | ||||||
| | 11.520 | 10.255 | 10.331 | 10.404 | 10.928 | 11.289 | ||||||
| | 90.003 | 88.322 | 86.856 | 86.278 | 84.438 | 85.343 | ||||||
| | 84.629 | 84.465 | 82.201 | 79.964 | 78.586 | 79.948 | ||||||
| | 65.850 | 62.894 | 58.042 | 58.924 | 56.717 | |||||||
| | 74.298 | 73.876 | 72.893 | 70.022 | 67.994 | |||||||
| | 87.957 | 87.009 | 87.216 | 84.506 | 83.332 | 80.562 | ||||||
| | 81.119 | 82.109 | 82.131 | 81.143 | 79.426 | |||||||
| | 99.672 | 99.238 | 99.038 | 98.758 | 97.788 | |||||||
| | 62.083 | 63.246 | 61.200 | 63.869 | 64.665 | |||||||
| | 93.675 | 92.186 | 91.234 | 91.554 | 90.922 | 93.461 | ||||||
| | 63.043 | 57.322 | 57.807 | 61.840 | 57.978 | 56.952 | ||||||
| | 92.451 | 92.115 | 90.979 | 91.146 | 90.088 | 90.291 | ||||||
| | 75.126 | 75.657 | 75.812 | 73.350 | 72.813 | 77.024 | ||||||
| | 75.071 | 77.652 | 76.427 | 73.494 | 72.524 | |||||||
| | 90.530 | 90.908 | 90.866 | 89.512 | 92.143 | |||||||
| | 86.942 | 89.074 | 87.089 | 88.486 | 83.871 | |||||||
| | 66.679 | 64.935 | 65.082 | 63.749 | 59.663 | 61.114 | ||||||
| | 76.001 | 76.500 | 75.008 | 72.551 | 71.531 | 72.956 | ||||||
| | 34.423 | 34.214 | 30.999 | 30.016 | 29.775 | 25.117 | ||||||
| | 51.554 | 50.389 | 50.917 | 52.106 | 48.742 | 50.168 | ||||||
| | 89.124 | 89.969 | 89.411 | 88.157 | 89.544 | 86.843 | ||||||
| | 80.454 | 79.554 | 79.258 | 78.232 | 75.350 | |||||||
| | 88.168 | 85.563 | 85.140 | 83.560 | 82.717 | 80.352 | ||||||

The economy of Kyrgyzstan is heavily dependent on the agricultural sector. Cotton, tobacco, wool, and meat are the main agricultural products, although only tobacco and cotton are exported in any quantity. According to Healy Consultants, Kyrgyzstan's economy relies heavily on the strength of industrial exports, with plentiful reserves of gold, mercury and uranium. The economy also relies heavily on remittances from foreign workers. Following independence, Kyrgyzstan was progressive in carrying out market reforms, such as an improved regulatory system and land reform. In 1998, Kyrgyzstan was the first Commonwealth of Independent States (CIS) country to be accepted into the World Trade Organization. Much of the government's stock in enterprises has been sold. Kyrgyzstan's economic performance has been hindered by widespread corruption, low foreign investment and general regional instability. Despite those issues, Kyrgyzstan is ranked 70th on the ease of doing business index.
This is a list of lists of countries and territories by various criteria. A country or territory is a geographical area, either in the sense of nation or state.
Electric energy consumption is the form of energy consumption that uses electrical energy. Electric energy consumption is the actual energy demand made on existing electricity supply for transportation, residential, industrial, commercial, and other miscellaneous purposes.
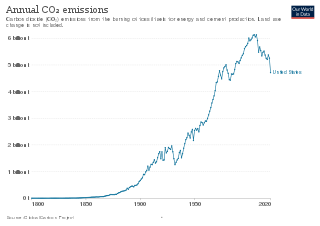
Energy in the United States comes mostly from fossil fuels: in 2020, data showed that 35% of the nation's energy originates from petroleum, 10% from coal, and 34% from natural gas. Nuclear power supplied 9% and renewable energy supplied 12%, mainly from hydroelectric dams and biomass; however, this also includes other renewable sources like wind, geothermal, and solar.
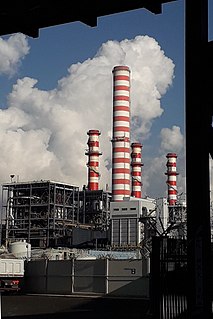
Energy in Italy come mostly from fossil fuels. Among the most used resources are petroleum, natural gas, coal and renewables. Italy has few energy resources, and most of supplies are imported.
Italy's total electricity consumption was 302.75 terawatt-hour (TWh) in 2020, of which 270.55 TWh (89.3%) was produced domestically and the remaining 10.7% was imported.
The map data is for year 2014 from the World Bank. Numbers are in percentage.
The map data is for year 2012 from the World Bank. Numbers are in kWh per year.
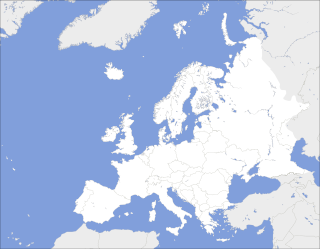
This is a list of total public and private health expenditure for European countries, divided by the population of the country to give expenditure per capita. It includes health services, family planning, nutrition activities, and emergency health aid.

World energy supply and consumption is global production and preparation of fuel, generation of electricity, energy transport and energy consumption. It is a basic part of economic activity. It includes heat, but not energy from food. Many countries publish statistics on the energy supply and consumption of either their own country, of other countries of interest, or of all countries combined in one chart. One of the largest organizations in this field, the International Energy Agency (IEA), publishes yearly comprehensive energy data. This collection of energy balances is very large. This article provides a brief description of energy supply and consumption, using statistics summarized in tables, of the countries and regions that produce and consume most.
