Hexham | |
---|---|
County constituency for the House of Commons | |
County | Northumberland |
Electorate | 60,499 (December 2010) [1] |
Major settlements | Hexham, Corbridge, Stocksfield, Ponteland, Prudhoe, Wylam, Haydon Bridge, Haltwhistle |
Current constituency | |
Created | 1885 |
Member of Parliament | Guy Opperman (Conservative) |
Seats | One |
Created from | North Northumberland and South Northumberland |
Hexham is a constituency [n 1] in Northumberland represented in the House of Commons of the UK Parliament since 2010 by Guy Opperman, a Conservative. As with all constituencies, the constituency elects one Member of Parliament (MP) by the first past the post system of election at least every five years.
The seat was created as one of four single member divisions of the county of Northumberland under the Redistribution of Seats Act 1885. [2]
The second-largest constituency by land area in England (covering 250,992 hectares), [3] Hexham reaches to the Pennines and is traversed by Hadrian's Wall, which runs almost due east–west through England. It includes substantial agricultural holdings, forestry, wood processing, food, minerals, and manufactured hardware industries. In the midst of the northwest of the constituency is Kielder Water; running between this area and the middle of the seat is the southern portion of Kielder Forest, and in the west, the attractions of the precipitous Haltwhistle Burn, Viaduct and Castle. SSE of Hexham is the Derwent Reservoir. [4] As well as those rural areas, the constituency also includes part of Newcastle's middle-class suburbs.
Hexham has been held by the Conservative Party, and generally with safe majorities, since 1924. It was the only Conservative seat in the North East between the New Labour years in government from 1997-2010, and the only one in Northumberland from 1973 until the Conservatives gained Berwick-upon-Tweed from the Liberal Democrats in 2015. It was also the northernmost seat won by the Conservatives in 1997, in what would be their worst landslide defeat at any general election of the twentieth century; with all Conservative MPs in Scotland and Wales unseated that year. [5] Despite this middle-class segment of the population, there are also some more working-class areas: Prudhoe frequently elects Labour councillors and has demographics similar to neighbouring parts of Blaydon, a safe Labour seat. There is also some deprivation in rural areas, particularly around Haltwhistle.
Based on the latest published old age dependency ratios, a slightly larger than average level of the population is retired. [6] In 1997, the Labour Party was very close to winning the seat, but the Conservatives retained it with a significantly reduced narrow majority of 222 votes. Hexham is considered a safe seat for the Conservative Party, having been under their control for almost a century. [7]
An estimate by the House of Commons Library puts the Leave vote by the constituency in the 2016 referendum at 45%. [8]
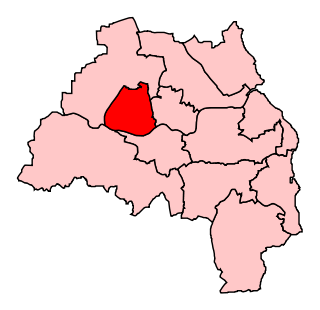
1885–1918: The Sessional Divisions of Bellingham, Coquetdale West, Haltwhistle, and Tynedale. [2]
The contents of the county division were defined by the Redistribution of Seats Act 1885.
1918–1950: The Rural Districts of Bellingham, Haltwhistle, Hexham, and the part of the Rural District of Castle Ward which consists of the civil parishes of Bitchfield, Black Heddon, Capheaton, Cheeseburn Grange, East Matfen, Fenwick, Harlow Hill, Hawkwell, Heugh, Ingoe, Kearsley, Kirkheaton, Nesbitt, Ouston, Ryal, Wallridge and West Matfen, and the Urban Districts of Hexham and Prudhoe. [9] [10]
Rothbury was transferred to Berwick-upon-Tweed.
1950–1974: The Urban Districts of Hexham and Prudhoe, and the Rural Districts of Bellingham, Castle Ward, Haltwhistle, Hexham. [11] [12]
The remainder of Castle Ward was transferred from the abolished constituency of Wansbeck.
1974–1983: The urban districts of Hexham and Prudhoe, and the rural districts of Bellingham, Castle Ward, Haltwhistle, and Hexham. [13]
The boundary with Blyth was slightly amended to take account of changes to local government boundaries.
1983–2010: The District of Tynedale, and the following wards of the Borough of Castle Morpeth: Heddon-on-the-Wall, Ponteland East, Ponteland North, Ponteland South, Ponteland West, Stamfordham, Stannington, and Whalton. [14] [15]
Contents changed following reorganisation of local authorities in 1974. The area of the former rural district of Castle Ward which was now part of the City of Newcastle upon Tyne in Tyne and Wear was now included in Newcastle upon Tyne North.
2010–present: The District of Tynedale, and the following wards of the Borough of Castle Morpeth: Heddon-on-the-Wall, Ponteland East, Ponteland North, Ponteland South, Ponteland West, Stamfordham, and Stannington. [16]
In the fifth periodic boundary review of parliamentary representation in Northumberland, which came into effect for the 2010 general election, the contents of the existing Hexham constituency were unchanged except for losing the southern part of the Hartburn ward to Berwick-upon-Tweed, and the Boundary Commission for England made only minor changes in Northumberland to take account of ward boundary changes.
In 2009, a further government reorganisation resulted in the abolition of all local government boroughs and districts in Northumberland and the establishment of the county as a unitary authority. [17] However, this has not affected the current constituency boundaries.
Further to the 2023 Periodic Review of Westminster constituencies, enacted by the Parliamentary Constituencies Order 2023, from the next general election, due by January 2025, the constituency will be composed of the following (as they existed on 1 December 2020):
The constituency will be expanded to bring the electorate within the permitted range, by adding the Newcastle ward of Callerton & Throckley. The boundaries within Northumberland will be adjusted slightly to take account of the reorganisation of local authority electoral divisions.
Colonel Douglas Clifton Brown, who was Speaker of the House of Commons during the latter years of the World War II, represented the seat for two separate tenures (from 1918-23, and again from 1924-51).
Party | Candidate | Votes | % | ±% | |
---|---|---|---|---|---|
SDP | William Clouston [20] | ||||
Liberal Democrats | Nick Cott [21] | ||||
Labour | Joe Morris [22] | ||||
Conservative | Guy Opperman [23] | ||||
Party | Candidate | Votes | % | ±% | |
---|---|---|---|---|---|
Conservative | Guy Opperman | 25,152 | 54.5 | 0.4 | |
Labour | Penny Grennan | 14,603 | 31.6 | 2.5 | |
Liberal Democrats | Stephen Howse | 4,672 | 10.1 | 3.0 | |
Green | Nick Morphet | 1,723 | 3.7 | 1.0 | |
Majority | 10,549 | 22.9 | 2.9 | ||
Turnout | 46,150 | 75.3 | 0.2 | ||
Conservative hold | Swing | 1.5 | |||
Party | Candidate | Votes | % | ±% | |
---|---|---|---|---|---|
Conservative | Guy Opperman | 24,996 | 54.1 | 1.4 | |
Labour Co-op | Stephen Powers | 15,760 | 34.1 | 9.2 | |
Liberal Democrats | Fiona Hall | 3,285 | 7.1 | 0.3 | |
Green | Wesley Foot | 1,253 | 2.7 | 2.9 | |
UKIP | Francis Miles | 930 | 2.0 | 7.9 | |
Majority | 9,236 | 20.0 | 7.8 | ||
Turnout | 46,224 | 75.1 | 3.6 | ||
Conservative hold | Swing | 3.9 | |||
Party | Candidate | Votes | % | ±% | |
---|---|---|---|---|---|
Conservative | Guy Opperman | 22,834 | 52.7 | 9.5 | |
Labour | Liam Carr | 10,803 | 24.9 | 5.9 | |
UKIP | David Nicholson | 4,302 | 9.9 | New | |
Liberal Democrats | Jeff Reid [26] | 2,961 | 6.8 | 23.1 | |
Green | Lee Williscroft-Ferris | 2,445 | 5.6 | New | |
Majority | 12,031 | 27.8 | 9.5 | ||
Turnout | 43,345 | 71.5 | 0.7 | ||
Conservative hold | Swing | 1.8 | |||
Party | Candidate | Votes | % | ±% | |
---|---|---|---|---|---|
Conservative | Guy Opperman | 18,795 | 43.2 | 0.8 | |
Liberal Democrats | Andrew Duffield | 13,007 | 29.9 | 4.2 | |
Labour | Antoine Tinnion | 8,253 | 19.0 | 11.4 | |
Independent | Steven Ford | 1,974 | 4.5 | New | |
BNP | Quentin Hawkins | 1,205 | 2.8 | New | |
Independent | Colin Moss | 249 | 0.6 | New | |
Majority | 5,788 | 13.3 | 1.2 | ||
Turnout | 43,483 | 70.8 | 2.2 | ||
Conservative hold | Swing | 1.7 | |||
Party | Candidate | Votes | % | ±% | |
---|---|---|---|---|---|
Conservative | Peter Atkinson | 17,605 | 42.4 | −2.2 | |
Labour | Kevin Graham | 12,585 | 30.3 | −8.3 | |
Liberal Democrats | Andrew Duffield | 10,673 | 25.7 | +10.7 | |
English Democrat | Ian Riddell | 521 | 1.3 | New | |
Imperial | Thomas Davison | 129 | 0.3 | New | |
Majority | 5,020 | 12.1 | +6.1 | ||
Turnout | 41,513 | 68.8 | −2.1 | ||
Conservative hold | Swing | +3.0 | |||
Party | Candidate | Votes | % | ±% | |
---|---|---|---|---|---|
Conservative | Peter Atkinson | 18,917 | 44.6 | +5.8 | |
Labour | Paul Brannen | 16,388 | 38.6 | +0.4 | |
Liberal Democrats | Philip Latham | 6,380 | 15.0 | −2.4 | |
UKIP | Alan Patterson | 728 | 1.7 | −0.9 | |
Majority | 2,529 | 6.0 | +5.4 | ||
Turnout | 42,413 | 70.9 | −6.6 | ||
Conservative hold | Swing | ||||
Party | Candidate | Votes | % | ±% | |
---|---|---|---|---|---|
Conservative | Peter Atkinson | 17,701 | 38.8 | -13.6 | |
Labour | Ian McMinn | 17,479 | 38.2 | +14.0 | |
Liberal Democrats | Philip Carr | 7,959 | 17.4 | -4.3 | |
Referendum | Robert Waddell | 1,362 | 3.0 | New | |
UKIP | David Lott | 1,170 | 2.6 | New | |
Majority | 222 | 0.6 | -27.6 | ||
Turnout | 45,671 | 77.5 | -4.9 | ||
Conservative hold | Swing | +13.8 | |||
Party | Candidate | Votes | % | ±% | |
---|---|---|---|---|---|
Conservative | Peter Atkinson | 24,967 | 52.4 | +2.8 | |
Labour | Ian Swithenbank | 11,529 | 24.2 | +6.2 | |
Liberal Democrats | Jonathan Wallace | 10,344 | 21.7 | −10.0 | |
Green | John Hartshorne | 781 | 1.6 | +0.9 | |
Majority | 13,438 | 28.2 | +10.3 | ||
Turnout | 47,621 | 82.4 | +2.4 | ||
Conservative hold | Swing | −1.7 | |||
Party | Candidate | Votes | % | ±% | |
---|---|---|---|---|---|
Conservative | Alan Amos | 22,370 | 49.6 | -1.9 | |
Liberal | Euan Robson | 14,304 | 31.7 | +0.2 | |
Labour | Mike Wood | 8,103 | 18.0 | +1.0 | |
Green | Sheila Wood | 336 | 0.7 | New | |
Majority | 8,066 | 17.9 | -2.1 | ||
Turnout | 45,113 | 80.0 | +6.6 | ||
Conservative hold | Swing | ||||
Party | Candidate | Votes | % | ±% | |
---|---|---|---|---|---|
Conservative | Geoffrey Rippon | 21,374 | 51.5 | +3.5 | |
Liberal | Euan Robson | 13,066 | 31.5 | +11.4 | |
Labour | Stephen Byers | 7,056 | 17.0 | -14.9 | |
Majority | 8,308 | 20.0 | +3.9 | ||
Turnout | 41,496 | 73.4 | -6.1 | ||
Conservative hold | Swing | ||||
Party | Candidate | Votes | % | ±% | |
---|---|---|---|---|---|
Conservative | Geoffrey Rippon | 25,483 | 47.98 | ||
Labour | Stuart Bell | 16,935 | 31.88 | ||
Liberal | John Shipley | 10,697 | 20.14 | ||
Majority | 8,548 | 16.10 | |||
Turnout | 53,115 | 79.50 | |||
Conservative hold | Swing | ||||
Party | Candidate | Votes | % | ±% | |
---|---|---|---|---|---|
Conservative | Geoffrey Rippon | 21,352 | 43.53 | ||
Labour | Eric Wade | 16,711 | 34.07 | ||
Liberal | Roy Cairncross | 10,991 | 22.41 | ||
Majority | 4,641 | 9.46 | |||
Turnout | 49,054 | 75.37 | |||
Conservative hold | Swing | ||||
Party | Candidate | Votes | % | ±% | |
---|---|---|---|---|---|
Conservative | Geoffrey Rippon | 24,059 | 45.46 | ||
Labour | Eric Wade | 16,129 | 30.48 | ||
Liberal | Roy Cairncross | 12,730 | 24.06 | ||
Majority | 7,930 | 14.98 | |||
Turnout | 52,918 | 82.62 | |||
Conservative hold | Swing | ||||
Party | Candidate | Votes | % | ±% | |
---|---|---|---|---|---|
Conservative | Geoffrey Rippon | 24,516 | 51.96 | ||
Labour | John E Miller | 16,645 | 35.28 | ||
Liberal | David Cogan | 6,021 | 12.76 | ||
Majority | 7,871 | 16.68 | |||
Turnout | 47,182 | 75.31 | |||
Conservative hold | Swing | ||||
Party | Candidate | Votes | % | ±% | |
---|---|---|---|---|---|
Conservative | Geoffrey Rippon | 20,889 | 48.10 | ||
Labour Co-op | James B. Lamb | 16,105 | 37.08 | ||
Liberal | Douglas A. Robson | 6,434 | 14.82 | ||
Majority | 4,784 | 11.02 | |||
Turnout | 43,428 | 78.05 | |||
Conservative hold | Swing | ||||
Party | Candidate | Votes | % | ±% | |
---|---|---|---|---|---|
Conservative | Rupert Speir | 22,468 | 50.70 | ||
Labour | John Alderson | 14,127 | 31.88 | ||
Liberal | Douglas A. Robson | 7,722 | 17.42 | New | |
Majority | 8,341 | 18.82 | |||
Turnout | 44,317 | 81.88 | |||
Conservative hold | Swing | ||||
Party | Candidate | Votes | % | ±% | |
---|---|---|---|---|---|
Conservative | Rupert Speir | 25,500 | 62.99 | ||
Labour | Wilfrid Roberts | 14,980 | 37.01 | ||
Majority | 10,520 | 25.98 | |||
Turnout | 40,480 | 81.11 | |||
Conservative hold | Swing | ||||
Party | Candidate | Votes | % | ±% | |
---|---|---|---|---|---|
Conservative | Rupert Speir | 23,462 | 64.00 | ||
Labour | Edward Garrett | 13,198 | 36.00 | ||
Majority | 10,264 | 28.00 | |||
Turnout | 36,660 | 77.28 | |||
Conservative hold | Swing | ||||
Party | Candidate | Votes | % | ±% | |
---|---|---|---|---|---|
Conservative | Rupert Speir | 23,267 | 59.61 | New | |
Labour Co-op | Thomas L. MacDonald | 15,768 | 40.39 | ||
Majority | 7,499 | 19.22 | N/A | ||
Turnout | 39,035 | 82.42 | |||
Conservative gain from Speaker | Swing | ||||
Party | Candidate | Votes | % | ±% | |
---|---|---|---|---|---|
Speaker | Douglas Clifton Brown | 24,703 | 85.06 | ||
Independent Liberal | Alexander Hancock | 4,154 | 14.40 | New | |
Majority | 20,549 | 71.66 | |||
Turnout | 28,857 | 61.88 | |||
Speaker hold | Swing | ||||
Party | Candidate | Votes | % | ±% | |
---|---|---|---|---|---|
Speaker | Douglas Clifton Brown | 16,431 | 58.23 | ||
Labour | Ernest Kavanagh | 11,786 | 41.77 | ||
Majority | 4,645 | 16.46 | |||
Turnout | 28,217 | 73.80 | |||
Speaker hold | Swing | ||||
Party | Candidate | Votes | % | ±% | |
---|---|---|---|---|---|
Conservative | Douglas Clifton Brown | 17,241 | 62.55 | ||
Labour | Ernest Kinghorn | 10,324 | 37.45 | ||
Majority | 6,917 | 25.10 | |||
Turnout | 27,565 | 75.92 | |||
Conservative hold | Swing | ||||
Party | Candidate | Votes | % | ±% | |
---|---|---|---|---|---|
Conservative | Douglas Clifton Brown | 20,578 | 73.14 | ||
Labour | E. O. Dunnico | 7,557 | 26.86 | ||
Majority | 13,021 | 46.28 | |||
Turnout | 28,135 | 79.21 | |||
Conservative hold | Swing | ||||
Party | Candidate | Votes | % | ±% | |
---|---|---|---|---|---|
Unionist | Douglas Clifton Brown | 11,069 | 39.1 | −8.9 | |
Liberal | Francis Acland | 9,103 | 32.2 | +2.9 | |
Labour | Ernest Owen Dunnico | 8,135 | 28.7 | +6.0 | |
Majority | 1,966 | 6.9 | −11.8 | ||
Turnout | 28,307 | 80.2 | −2.0 | ||
Registered electors | 35,304 | ||||
Unionist hold | Swing | −5.9 | |||
Party | Candidate | Votes | % | ±% | |
---|---|---|---|---|---|
Unionist | Douglas Clifton Brown | 10,741 | 48.0 | +4.0 | |
Liberal | Victor Finney | 6,551 | 29.3 | −26.7 | |
Labour | Charles Flynn | 5,089 | 22.7 | New | |
Majority | 4,190 | 18.7 | N/A | ||
Turnout | 22,381 | 82.2 | +6.6 | ||
Registered electors | 27,237 | ||||
Unionist gain from Liberal | Swing | +15.4 | |||
Party | Candidate | Votes | % | ±% | |
---|---|---|---|---|---|
Liberal | Victor Finney | 11,293 | 56.0 | +25.0 | |
Unionist | Douglas Clifton Brown | 8,887 | 44.0 | −0.8 | |
Majority | 2,406 | 12.0 | N/A | ||
Turnout | 20,180 | 75.6 | −3.7 | ||
Registered electors | 26,732 | ||||
Liberal gain from Unionist | Swing | +12.9 | |||
Party | Candidate | Votes | % | ±% | |
---|---|---|---|---|---|
Unionist | Douglas Clifton Brown | 9,369 | 44.8 | −4.1 | |
Liberal | Victor Finney | 6,486 | 31.0 | +6.1 | |
Labour | George Shield | 5,050 | 24.2 | −2.0 | |
Majority | 2,883 | 13.8 | −8.9 | ||
Turnout | 20,905 | 79.3 | +16.9 | ||
Registered electors | 26,372 | ||||
Unionist hold | Swing | −5.1 | |||
Party | Candidate | Votes | % | ±% | |
---|---|---|---|---|---|
C | Unionist | Douglas Clifton Brown | 7,763 | 48.9 | +3.1 |
Labour | William Weir | 4,168 | 26.2 | New | |
Liberal | Wentworth Beaumont | 3,948 | 24.9 | −29.3 | |
Majority | 3,595 | 22.7 | N/A | ||
Turnout | 15,879 | 62.4 | −21.0 | ||
Registered electors | 25,341 | ||||
Unionist gain from Liberal | Swing | +16.2 | |||
Cindicates candidate endorsed by the coalition government. |
General Election 1914–15:
Another General Election was required to take place before the end of 1915. The political parties had been making preparations for an election to take place and by July 1914, the following candidates had been selected:
Party | Candidate | Votes | % | ±% | |
---|---|---|---|---|---|
Liberal | Richard Durning Holt | 5,124 | 54.2 | −1.2 | |
Conservative | Alfred Henry Chaytor | 4,334 | 45.8 | +1.2 | |
Majority | 790 | 8.4 | −2.4 | ||
Turnout | 9,458 | 83.4 | −3.9 | ||
Registered electors | 11,335 | ||||
Liberal hold | Swing | −1.2 | |||
Party | Candidate | Votes | % | ±% | |
---|---|---|---|---|---|
Liberal | Richard Durning Holt | 5,478 | 55.4 | −6.0 | |
Conservative | Charles Loftus Bates | 4,417 | 44.6 | +6.0 | |
Majority | 1,061 | 10.8 | −12.0 | ||
Turnout | 9,895 | 87.3 | +4.2 | ||
Registered electors | 11,335 | ||||
Liberal hold | Swing | −6.0 | |||
Party | Candidate | Votes | % | ±% | |
---|---|---|---|---|---|
Liberal | Richard Durning Holt | 5,401 | 56.0 | −5.4 | |
Conservative | Charles Loftus Bates | 4,244 | 44.0 | +5.4 | |
Majority | 1,157 | 12.0 | −10.8 | ||
Turnout | 9,645 | 86.8 | +3.7 | ||
Registered electors | 11,116 | ||||
Liberal hold | Swing | −5.4 | |||
Party | Candidate | Votes | % | ±% | |
---|---|---|---|---|---|
Liberal | Wentworth Beaumont | 5,632 | 61.4 | +10.3 | |
Conservative | Nathaniel George Clayton | 3,547 | 38.6 | −10.3 | |
Majority | 2,085 | 22.8 | +20.6 | ||
Turnout | 9,179 | 83.1 | +3.5 | ||
Registered electors | 11,049 | ||||
Liberal hold | Swing | +10.3 | |||
Party | Candidate | Votes | % | ±% | |
---|---|---|---|---|---|
Liberal | Wentworth Beaumont | 4,197 | 51.1 | −1.5 | |
Liberal Unionist | Charles Howard | 4,011 | 48.9 | +1.5 | |
Majority | 186 | 2.2 | −3.0 | ||
Turnout | 8,208 | 79.6 | −2.2 | ||
Registered electors | 10,310 | ||||
Liberal hold | Swing | −1.5 | |||
Party | Candidate | Votes | % | ±% | |
---|---|---|---|---|---|
Liberal | Wentworth Beaumont | 4,438 | 52.6 | +3.1 | |
Conservative | Charles Edward Hunter | 4,003 | 47.4 | −3.1 | |
Majority | 435 | 5.2 | N/A | ||
Turnout | 8,441 | 81.8 | +0.4 | ||
Registered electors | 10,316 | ||||
Liberal gain from Conservative | Swing | +3.1 | |||
Party | Candidate | Votes | % | ±% | |
---|---|---|---|---|---|
Liberal | Miles MacInnes | 4,804 | 52.4 | +2.9 | |
Conservative | Richard Clayton | 4,358 | 47.6 | −2.9 | |
Majority | 446 | 4.8 | N/A | ||
Turnout | 9,162 | 87.3 | +5.9 | ||
Registered electors | 10,494 | ||||
Liberal gain from Conservative | Swing | +2.9 | |||
Party | Candidate | Votes | % | ±% | |
---|---|---|---|---|---|
Conservative | *Nathaniel George Clayton | 4,092 | 50.5 | +7.0 | |
Liberal | Miles MacInnes | 4,010 | 49.5 | -7.0 | |
Majority | 82 | 1.0 | N/A | ||
Turnout | 8,102 | 81.4 | +9.1 | ||
Registered electors | 9,954 | ||||
Conservative gain from Liberal | Swing | +7.0 | |||
Party | Candidate | Votes | % | ±% | |
---|---|---|---|---|---|
Liberal | Miles MacInnes | 4,177 | 56.5 | -2.1 | |
Conservative | Viscount Melgund | 3,220 | 43.5 | +2.1 | |
Majority | 957 | 13.0 | -4.2 | ||
Turnout | 7,397 | 72.3 | −14.2 | ||
Registered electors | 10,237 | ||||
Liberal hold | Swing | -2.1 | |||
Party | Candidate | Votes | % | ±% | |
---|---|---|---|---|---|
Liberal | Miles MacInnes | 5,193 | 58.6 | ||
Conservative | Matthew Ridley | 3,663 | 41.4 | ||
Majority | 1,530 | 17.2 | |||
Turnout | 8,856 | 86.5 | |||
Registered electors | 10,237 | ||||
Liberal win (new seat) |
Tynedale was a local government district in Northumberland, England. The district had a resident population of 58,808 according to the 2001 census. The main towns were Hexham, Haltwhistle and Prudhoe. The district contained part of Hadrian's Wall and the southern part of Northumberland National Park.
Haltwhistle is a market town and civil parish in Northumberland, England, 22.9 miles east of Carlisle and 36.8 miles west of Newcastle upon Tyne. It had a population of 3,811 at the 2011 Census.
Newcastle upon Tyne Central is a constituency represented in the House of Commons of the UK Parliament since 2010 by Chi Onwurah of the Labour Party. As with all constituencies, the constituency elects one Member of Parliament (MP) by the first past the post system of election at least every five years.
Newcastle upon Tyne North is a constituency represented in the House of Commons of the UK Parliament since 2010 by Catherine McKinnell of the Labour Party.
Tynemouth is a constituency in Tyne and Wear represented in the House of Commons of the UK Parliament since 1997 by Sir Alan Campbell, a member of the Labour Party.
North West Norfolk is a constituency represented in the House of Commons of the UK Parliament since 2019 by James Wild, a Conservative.
Wansbeck is a constituency represented in the House of Commons of the UK Parliament since 2010 by Ian Lavery, a member of the Labour Party.
Blyth Valley, formerly known as Blyth, is a constituency represented in the House of Commons of the UK Parliament since 2019 by Ian Levy, a Conservative.
Berwick-upon-Tweed is a parliamentary constituency in Northumberland represented in the House of Commons of the UK Parliament since 2015 by Anne-Marie Trevelyan, a Conservative.
Stone is a constituency in Staffordshire, represented in the House of Commons of the UK Parliament since its 1997 recreation by Sir Bill Cash, a Conservative. On 9 June 2023, he announced his intention to stand down at the next general election.
The Northern Football Alliance is a football league based in the North East, England. It has four divisions headed by the Premier Division, which sits at step 7 of the National League System.
Newcastle upon Tyne East is a constituency represented in the House of Commons of the UK Parliament by Nick Brown, formerly of the Labour Party. Brown has held the seat since its recreation in 2010.
Wallsend was a parliamentary constituency centred on Wallsend, a town on the north bank of the River Tyne in North Tyneside.
Horsley is a small village and civil parish in Northumberland, England. The village lies around 11 miles (18 km) from Newcastle upon Tyne and 12 miles (19 km) from Hexham.
Craig, F. W. S. (1983). British parliamentary election results 1918–1949 (3 ed.). Chichester: Parliamentary Research Services. ISBN 0-900178-06-X.