Mansfield | |
---|---|
County constituency for the House of Commons | |
County | Nottinghamshire |
Electorate | 79,849 (December 2010) [1] |
Major settlements | Mansfield |
Current constituency | |
Created | 1885 |
Member of Parliament | Ben Bradley (Conservative) |
Seats | One |
Created from | North Nottinghamshire |
Mansfield is a constituency [n 1] created in 1885 represented in the House of Commons of the UK Parliament since 2017 by Ben Bradley of the Conservative Party, who gained the seat at the 2017 general election, from the Labour Party. [n 2] This is the first time the seat has been represented by a Conservative since its creation in 1885.
The seat, centred on Mansfield in Nottinghamshire, in recent times has been considered a relatively marginal seat. [2] [3]
The Mansfield council area voted with more than 70% to Leave the European Union in the 2016 referendum. In 2019, the Conservatives received 63.9% of the vote in the formerly safe Labour constituency.
The constituency covers the towns of Mansfield and Warsop, Nottinghamshire.
1885–1918: The sessional division of Mansfield (except the parishes of Clipstone, Sookholme and Warsop), and the parishes of Annesley, Eastwood, Felley and Greasley in the sessional division of Nottingham. [4]
1918–1950: The municipal borough of Mansfield, the urban district of Huthwaite, Mansfield Woodhouse, and Sutton-in-Ashfield, and the rural district of Skegby (except the parish of Sookholme). [5]
1950–1955: The municipal borough of Mansfield and the urban district of Sutton in Ashfield. [6]
1955–1983: The municipal borough of Mansfield and the urban districts of Mansfield Woodhouse and Warsop. [7]
1983–2010: The Berry Hill, Broomhill, Cumberlands, Eakring, Forest Town, Ladybrook, Leeming, Lindhurst, Manor, Northfield, Oakham, Oak Tree, Pleasleyhill, Ravensdale, Sherwood and Titchfield wards of the District of Mansfield. [8]
2010–present: The District of Mansfield. [9]
2024-: The district of mansfield wards of Bancroft; Berry Hill; Brick Kiln; Carr Bank; Central; Eakring; Grange Farm; Holly Forest Town; Hornby; Kings Walk; Kingsway Forest Town; Lindhurst (part); Ling Forest; Manor; Market Warsop; Maun Valley Forest Town; Meden; Mill Lane; Netherfield; Newlands Forest Town; Oak Tree; Oakham; Park Hall; Penniment; Racecourse; Rock Hill; Rufford (majority); Sherwood (nearly all); Southwell; Thompsons; Vale; Wainwright; Warsop Carrs; West Bank; Yeoman Hill; and a very small part of Pleasley. [10]
Further to the 2023 Periodic Review of Westminster constituencies, enacted by the Parliamentary Constituencies Order 2023, the composition of the constituency from the 2024 United Kingdom general election will be reduced to bring the electorate within the permitted electoral range by transferring the Bull Farm and Pleasley Hill ward and polling district BHC in the Berry Hill ward (as they existed on 1 December 2020) to Ashfield. [11]
The seat was created in the Redistribution of Seats Act 1885 and in the mid-19th century to the mid-20th century its economy centred on coal mining and the market town itself. Among many classes of local labourers saw organised Labour Party support, in Trade Unions, party clubs and civic society. Progression in the party's polling was heightened from the early 1920s when the seat joined many wrested from the Liberal Party, enabling the formation of the first Labour government. By length of tenure and in great majorities a safe seat status emerged for Labour (on the basis of these standard criteria) in the 1950s and 1960s. In the 1980s general elections Labour's Mansfield candidates came closer to losing to Conservatives. At the 1983 election, Labour held the seat by just over 2,000 votes – at the following, in 1987, 56 votes. That election was set against the background of the party HQ-backed miners' strike of 1984, not supported by the majority of miners in Nottinghamshire.
In the elections after 1987 until 2017, the Labour MP Alan Meale held Mansfield with relatively large majorities. He was knighted in 2012 after receiving the award in the Queen's Birthday Honours list. [12]
At the 2005 general election, independent candidate Stewart Rickersey, a local District Councillor, took 17% of the vote, finishing in third place.
At the 2010 general election, Andre Camilleri, another candidate from Mansfield Independent Forum and previously a local councillor with special responsibility as a Cabinet Member for Mansfield District Council during 2003 to 2007, was placed fourth with 9% of the vote, above the 5% deposit threshold.
At the 2015 general election, the UKIP candidate Sid Pepper received 25% of the vote placing him third; this dropped to 5% at the 2017 election.
At the 2019 general election, Ben Bradley held Mansfield with a 16,306 majority, the highest ever for a Conservative candidate.
Party | Candidate | Votes | % | ±% | |
---|---|---|---|---|---|
Conservative | Ben Bradley [14] | ||||
Socialist Labour | Steve Jones [15] [ dead link ] | ||||
Green | Philip Shields [16] | ||||
Labour | Steve Yemm [17] | ||||
Party | Candidate | Votes | % | ±% | |
---|---|---|---|---|---|
Conservative | Ben Bradley | 31,484 | 63.9 | +17.3 | |
Labour | Sonya Ward | 15,178 | 30.8 | −13.7 | |
Liberal Democrats | Sarah Brown | 1,626 | 3.3 | +1.9 | |
Independent | Sid Pepper | 527 | 1.1 | −4.2 | |
Independent | Stephen Harvey | 458 | 0.9 | New | |
Majority | 16,306 | 33.1 | +31.0 | ||
Turnout | 49,273 | 63.9 | −0.6 | ||
Conservative hold | Swing | +15.0 | |||
Party | Candidate | Votes | % | ±% | |
---|---|---|---|---|---|
Conservative | Ben Bradley | 23,392 | 46.6 | +18.4 | |
Labour | Alan Meale | 22,335 | 44.5 | +5.1 | |
UKIP | Sid Pepper | 2,654 | 5.3 | −19.8 | |
Independent | Philip Shields | 1,079 | 2.2 | New | |
Liberal Democrats | Anita Prabhakar | 697 | 1.4 | −1.9 | |
Majority | 1,057 | 2.1 | N/A | ||
Turnout | 50,157 | 64.5 | +3.6 | ||
Conservative gain from Labour | Swing | +6.7 | |||
Party | Candidate | Votes | % | ±% | |
---|---|---|---|---|---|
Labour | Alan Meale [20] | 18,603 | 39.4 | +0.7 | |
Conservative | Andrea Clarke [21] | 13,288 | 28.2 | +1.9 | |
UKIP | Sid Pepper [22] | 11,850 | 25.1 | +18.9 | |
Liberal Democrats | Tony Rogers [23] | 1,642 | 3.5 | −11.9 | |
Green | Paul Frost [24] | 1,486 | 3.1 | New | |
TUSC | Karen Seymour [23] | 324 | 0.7 | New | |
Majority | 5,315 | 11.2 | −1.2 | ||
Turnout | 47,193 | 60.9 | +0.5 | ||
Labour hold | Swing | −0.6 | |||
Party | Candidate | Votes | % | ±% | |
---|---|---|---|---|---|
Labour | Alan Meale | 18,753 | 38.7 | −11.4 | |
Conservative | Tracy Critchlow | 12,741 | 26.3 | +7.6 | |
Liberal Democrats | Michael Wyatt [26] | 7,469 | 15.4 | +1.4 | |
Mansfield Independent Forum | Andre Camilleri | 4,339 | 9.0 | −8.0 | |
UKIP | David Hamilton | 2,985 | 6.2 | New | |
BNP | Rachel Hill | 2,108 | 4.4 | New | |
Majority | 6,012 | 12.4 | −19.0 | ||
Turnout | 48,395 | 60.4 | +3.5 | ||
Labour hold | Swing | −9.5 | |||
Party | Candidate | Votes | % | ±% | |
---|---|---|---|---|---|
Labour | Alan Meale | 18,400 | 48.1 | −9.0 | |
Conservative | Anne Wright | 7,035 | 18.4 | −8.8 | |
Mansfield Independent Forum | Stewart Rickersey | 6,491 | 17.0 | New | |
Liberal Democrats | Roger Shelley | 5,316 | 13.9 | −1.8 | |
Veritas | Michael Harvey | 1,034 | 2.7 | New | |
Majority | 11,365 | 29.7 | -0.2 | ||
Turnout | 38,276 | 55.4 | +0.2 | ||
Labour hold | Swing | −0.1 | |||
Party | Candidate | Votes | % | ±% | |
---|---|---|---|---|---|
Labour | Alan Meale | 21,050 | 57.1 | -7.3 | |
Conservative | William Wellesley | 10,012 | 27.2 | +6.0 | |
Liberal Democrats | Tim Hill | 5,790 | 15.7 | +4.6 | |
Majority | 11,038 | 29.9 | -13.4 | ||
Turnout | 36,852 | 55.2 | -15.5 | ||
Labour hold | Swing | ||||
Party | Candidate | Votes | % | ±% | |
---|---|---|---|---|---|
Labour | Alan Meale | 30,556 | 64.4 | +10.0 | |
Conservative | Tim Frost | 10,038 | 21.2 | −11.9 | |
Liberal Democrats | Phil Smith | 5,244 | 11.1 | −1.5 | |
Referendum | Jim Bogusz | 1,588 | 3.3 | New | |
Majority | 20,518 | 43.3 | +22.0 | ||
Turnout | 47,426 | 70.7 | -11.5 | ||
Labour hold | Swing | ||||
Party | Candidate | Votes | % | ±% | |
---|---|---|---|---|---|
Labour | Alan Meale | 29,932 | 54.4 | +16.9 | |
Conservative | Gary S. Mond | 18,208 | 33.1 | −4.3 | |
Liberal Democrats | Stuart R. Thompstone | 6,925 | 12.6 | −9.6 | |
Majority | 11,724 | 21.3 | +21.2 | ||
Turnout | 55,065 | 82.2 | +3.8 | ||
Labour hold | Swing | +10.6 | |||
Party | Candidate | Votes | % | ±% | |
---|---|---|---|---|---|
Labour | Alan Meale | 19,610 | 37.5 | −3.0 | |
Conservative | Charles Hendry | 19,554 | 37.4 | +1.8 | |
SDP | Barry Answer | 11,604 | 22.2 | −1.7 | |
Moderate Labour | Brian Marshall | 1,580 | 3.0 | New | |
Majority | 56 | 0.1 | -4.8 | ||
Turnout | 52,348 | 78.4 | +7.7 | ||
Labour hold | Swing | −2.4 | |||
Party | Candidate | Votes | % | ±% | |
---|---|---|---|---|---|
Labour | Don Concannon | 18,670 | 40.5 | -11.8 | |
Conservative | Richard Wrenn | 16,454 | 35.6 | +3.7 | |
SDP | Stephen Taylor | 11,036 | 23.9 | New | |
Majority | 2,216 | 4.9 | -15.5 | ||
Turnout | 46,160 | 70.7 | -6.6 | ||
Labour hold | Swing | -7.75 | |||
Party | Candidate | Votes | % | ±% | |
---|---|---|---|---|---|
Labour | Don Concannon | 29,051 | 52.28 | -5.13 | |
Conservative | K Daly | 17,720 | 31.89 | +8.73 | |
Liberal | David Chambers | 8,536 | 15.36 | -3.19 | |
National Front | P Donovan | 259 | 0.47 | New | |
Majority | 11,331 | 20.39 | |||
Turnout | 55,566 | 77.34 | |||
Labour hold | Swing | -6.93 | |||
Party | Candidate | Votes | % | ±% | |
---|---|---|---|---|---|
Labour | Don Concannon | 28,964 | 57.41 | ||
Conservative | JR Wood | 11,685 | 23.16 | ||
Liberal | David Chambers | 9,358 | 18.55 | ||
Communist | Frederick Charles Westacott | 448 | 0.89 | ||
Majority | 17,279 | 34.25 | |||
Turnout | 50,455 | 72.54 | |||
Labour hold | Swing | ||||
Party | Candidate | Votes | % | ±% | |
---|---|---|---|---|---|
Labour | Don Concannon | 34,378 | 64.51 | ||
Conservative | HJ Thompson | 18,236 | 34.22 | ||
Communist | Frederick Charles Westacott | 675 | 1.27 | ||
Majority | 16,142 | 30.29 | |||
Turnout | 53,289 | 77.35 | |||
Labour hold | Swing | ||||
Party | Candidate | Votes | % | ±% | |
---|---|---|---|---|---|
Labour | Don Concannon | 30,554 | 66.12 | ||
Conservative | C William H Morton | 15,027 | 32.52 | ||
Communist | Frederick Charles Westacott | 628 | 1.36 | ||
Majority | 15,527 | 33.60 | |||
Turnout | 46,209 | 68.67 | |||
Labour hold | Swing | ||||
Party | Candidate | Votes | % | ±% | |
---|---|---|---|---|---|
Labour | Don Concannon | 28,849 | 64.24 | ||
Conservative | Kenneth Clarke | 9,987 | 22.24 | ||
Liberal | Reginald Strauther | 5,483 | 12.21 | ||
Communist | Frederick Charles Westacott | 590 | 1.31 | New | |
Majority | 18,862 | 42.00 | |||
Turnout | 44,909 | 74.82 | |||
Labour hold | Swing | ||||
Party | Candidate | Votes | % | ±% | |
---|---|---|---|---|---|
Labour | Bernard Taylor | 29,055 | 63.57 | ||
Conservative | Kenneth Clarke | 10,021 | 21.93 | ||
Liberal | Reginald Strauther | 6,628 | 14.50 | ||
Majority | 19,034 | 41.64 | |||
Turnout | 45,704 | 77.86 | |||
Labour hold | Swing | ||||
Party | Candidate | Votes | % | ±% | |
---|---|---|---|---|---|
Labour | Bernard Taylor | 31,066 | 67.88 | ||
Conservative | M Robert V Eliot | 14,700 | 32.12 | ||
Majority | 16,366 | 35.76 | |||
Turnout | 45,766 | 80.75 | |||
Labour hold | Swing | ||||
Party | Candidate | Votes | % | ±% | |
---|---|---|---|---|---|
Labour | Bernard Taylor | 29,543 | 68.46 | ||
Conservative | Ian Berkeley Church | 13,610 | 31.54 | ||
Majority | 15,933 | 36.92 | |||
Turnout | 43,153 | 78.15 | |||
Labour hold | Swing | ||||
Party | Candidate | Votes | % | ±% | |
---|---|---|---|---|---|
Labour | Bernard Taylor | 37,097 | 69.92 | ||
Conservative | Muriel Evelyn Williamson | 15,961 | 30.08 | ||
Majority | 21,136 | 39.84 | |||
Turnout | 53,058 | 83.34 | |||
Labour hold | Swing | ||||
Party | Candidate | Votes | % | ±% | |
---|---|---|---|---|---|
Labour | Bernard Taylor | 36,224 | 66.65 | ||
Conservative | Herbert Leslie Milliard | 12,495 | 22.99 | ||
Liberal | C H Preston Robinson | 5,145 | 9.47 | New | |
Communist | W Les Ellis [34] | 482 | 0.89 | New | |
Majority | 23,729 | 43.66 | |||
Turnout | 54,346 | 85.83 | |||
Labour hold | Swing | ||||
Party | Candidate | Votes | % | ±% | |
---|---|---|---|---|---|
Labour | Bernard Taylor | 43,113 | 75.09 | ||
Conservative | Thomas Lynch | 14,302 | 24.91 | ||
Majority | 28,811 | 50.18 | |||
Turnout | 57,415 | 75.93 | |||
Labour hold | Swing | ||||
Party | Candidate | Votes | % | ±% | |
---|---|---|---|---|---|
Labour | Bernard Taylor | Unopposed | N/A | N/A | |
Labour hold | |||||
Party | Candidate | Votes | % | ±% | |
---|---|---|---|---|---|
Labour | Charles Brown | 31,803 | 68.01 | ||
Conservative | Alexander Spearman | 14,962 | 31.99 | ||
Majority | 16,841 | 36.02 | |||
Turnout | 46,765 | 69.54 | |||
Labour hold | Swing | ||||
Party | Candidate | Votes | % | ±% | |
---|---|---|---|---|---|
Labour | Charles Brown | 26,865 | 55.77 | ||
Conservative | ESB Hopkin | 21,303 | 44.23 | ||
Majority | 5,562 | 11.54 | |||
Turnout | 48,168 | 77.01 | |||
Labour hold | Swing | ||||
Party | Candidate | Votes | % | ±% | |
---|---|---|---|---|---|
Labour | Charles Brown | 28,416 | 58.6 | −0.4 | |
Liberal | William Collins | 10,517 | 21.7 | New | |
Unionist | S R Sidebottom | 9,035 | 18.6 | −22.4 | |
Communist | Rosina Smith | 533 | 1.1 | New | |
Majority | 17,899 | 36.9 | +18.9 | ||
Turnout | 48,501 | 81.2 | +6.4 | ||
Registered electors | 59,735 | ||||
Labour hold | Swing | +11.0 | |||
Party | Candidate | Votes | % | ±% | |
---|---|---|---|---|---|
Labour | Frank Varley | 19,441 | 59.0 | +1.2 | |
Unionist | C.L. Hanington | 13,535 | 41.0 | New | |
Majority | 5,906 | 18.0 | +2.4 | ||
Turnout | 32,976 | 74.8 | −1.1 | ||
Registered electors | 44,094 | ||||
Labour hold | Swing | +1.2 | |||
Party | Candidate | Votes | % | ±% | |
---|---|---|---|---|---|
Labour | Frank Varley | 18,813 | 57.8 | +9.8 | |
Liberal | Albert Bennett | 13,757 | 42.2 | −9.8 | |
Majority | 5,056 | 15.6 | N/A | ||
Turnout | 32,570 | 75.9 | +1.6 | ||
Registered electors | 42,937 | ||||
Labour gain from Liberal | Swing | +9.8 | |||
Party | Candidate | Votes | % | ±% | |
---|---|---|---|---|---|
Liberal | Albert Bennett | 16,192 | 52.0 | +32.5 | |
Labour | William Carter | 14,917 | 48.0 | +4.4 | |
Majority | 1,275 | 4.0 | N/A | ||
Turnout | 31,109 | 74.3 | +21.8 | ||
Registered electors | 41,868 | ||||
Liberal gain from Labour | Swing | +14.1 | |||
Party | Candidate | Votes | % | ±% | |
---|---|---|---|---|---|
Labour | William Carter | 8,957 | 43.6 | New | |
C | National Democratic | George Jarrett | 6,678 | 32.6 | New |
Liberal | Violet Markham | 4,000 | 19.5 | −53.5 | |
Independent | Nowroji Merwangi Tarachand | 878 | 4.3 | New | |
Majority | 2,279 | 11.0 | N/A | ||
Turnout | 20,513 | 52.5 | −21.4 | ||
Registered electors | 39,041 | ||||
Labour gain from Liberal | Swing | N/A | |||
Cindicates candidate endorsed by the coalition government. |
Party | Candidate | Votes | % | ±% | |
---|---|---|---|---|---|
Liberal | Cecil Foljambe | 6,120 | 72.6 | ||
Conservative | John Horne Payne | 2,305 | 27.4 | ||
Majority | 3,815 | 45.2 | |||
Turnout | 8,425 | 85.4 | |||
Registered electors | 9,862 | ||||
Liberal win (new seat) |
Party | Candidate | Votes | % | ±% | |
---|---|---|---|---|---|
Liberal | Cecil Foljambe | 4,876 | 63.3 | -9.3 | |
Conservative | Lancelot Rolleston | 2,832 | 36.7 | +9.3 | |
Majority | 2,044 | 26.6 | -18.6 | ||
Turnout | 7,708 | 78.2 | -7.2 | ||
Registered electors | 9,862 | ||||
Liberal hold | Swing | -9.3 | |||
Party | Candidate | Votes | % | ±% | |
---|---|---|---|---|---|
Liberal | John Williams | 5,731 | 63.9 | +0.6 | |
Conservative | Daniel Warde | 3,235 | 36.1 | -0.6 | |
Majority | 2,496 | 27.8 | +1.2 | ||
Turnout | 8,966 | 77.7 | -0.5 | ||
Registered electors | 11,539 | ||||
Liberal hold | Swing | +0.6 | |||
Party | Candidate | Votes | % | ±% | |
---|---|---|---|---|---|
Liberal | John Williams | 5,670 | 57.0 | -6.9 | |
Conservative | Henry Eyre | 4,285 | 43.0 | +6.9 | |
Majority | 1,385 | 14.0 | -13.8 | ||
Turnout | 9,955 | 80.6 | +2.9 | ||
Registered electors | 12,345 | ||||
Liberal hold | Swing | -6.9 | |||
Party | Candidate | Votes | % | ±% | |
---|---|---|---|---|---|
Liberal | Arthur Markham | 6,496 | 61.2 | +4.2 | |
Conservative | Henry Eyre | 4,127 | 38.8 | -4.2 | |
Majority | 2,369 | 22.4 | +8.4 | ||
Turnout | 10,623 | 73.5 | -7.1 | ||
Registered electors | 14,456 | ||||
Liberal hold | Swing | +4.2 | |||
Party | Candidate | Votes | % | ±% | |
---|---|---|---|---|---|
Liberal | Arthur Markham | Unopposed | |||
Liberal hold | |||||
Party | Candidate | Votes | % | ±% | |
---|---|---|---|---|---|
Liberal | Arthur Markham | 12,622 | 74.2 | N/A | |
Conservative | John George Drummond Campbell | 4,382 | 25.8 | New | |
Majority | 8,240 | 48.4 | N/A | ||
Turnout | 17,004 | 80.7 | N/A | ||
Liberal hold | Swing | ||||
Party | Candidate | Votes | % | ±% | |
---|---|---|---|---|---|
Liberal | Arthur Markham | 11,383 | 73.0 | -1.2 | |
Conservative | Frederick Pepys Cockerill | 4,200 | 27.0 | +1.2 | |
Majority | 7,183 | 46.0 | -2.4 | ||
Turnout | 15,583 | 73.9 | -6.8 | ||
Liberal hold | Swing | -1.2 | |||
General Election 1914–15:
Another General Election was required to take place before the end of 1915. The political parties had been making preparations for an election to take place and by July 1914, the following candidates had been selected;
Party | Candidate | Votes | % | ±% | |
---|---|---|---|---|---|
Liberal | Charles Seely | 7,597 | 63.0 | -10.0 | |
Independent | Arthur Turnbull | 4,456 | 37.0 | New | |
Majority | 3,141 | 26.0 | -20.0 | ||
Turnout | 12,053 | 48.7 | -25.2 | ||
Liberal hold | Swing | ||||
Arthur Turnbull was supported by Horatio Bottomley
Warwick and Leamington is a constituency represented in the House of Commons of the UK Parliament since the 2017 general election by Matt Western, of the Labour Party.
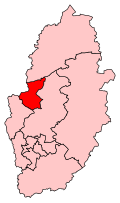
Ashfield is a constituency represented in the House of Commons of the UK Parliament by Lee Anderson, formerly of the Conservative Party, but who had the whip suspended in February 2024 and two weeks later joined Reform UK to become their first MP. The constituency is in the English county of Nottinghamshire, East Midlands; located to the north west of the city of Nottingham in the Erewash Valley along the border with neighbouring county Derbyshire. Ashfield was part of the Red Wall which by and large, voted Conservative in the 2019 general election. In the 2016 referendum on membership of the European Union, Ashfield voted 70% in favour of Brexit.
Battersea is a constituency in the London Borough of Wandsworth. It has been represented since 2017 by Marsha de Cordova of the Labour Party.
Burnley is a constituency centred on the town of Burnley in Lancashire which has been represented since 2019 by Antony Higginbotham, a Conservative.
Barrow and Furness, formerly known as Barrow-in-Furness, is a constituency in Cumbria which has been represented in the House of Commons of the UK Parliament by Simon Fell of the Conservative Party since 2019.
Macclesfield is a constituency in Cheshire represented in the House of Commons of the UK Parliament since 2010 by David Rutley, a Conservative.
Southport is a constituency in Merseyside which has been represented in the House of Commons of the UK Parliament since 2017 by Damien Moore of the Conservative Party.
West Derbyshire was a county constituency represented in the House of Commons of the Parliament of the United Kingdom. From 1885, until it was replaced by the Derbyshire Dales constituency in the 2010 general election, it elected one Member of Parliament (MP) by the first past the post voting system. It was a safe Conservative seat for most of its existence.
Shipley is a constituency represented in the House of Commons of the UK Parliament since 2005 by Philip Davies, a Conservative.
Eastbourne is a constituency for the House of Commons of the UK Parliament. It was created as one of nine in Sussex in 1885, since when it has reduced in geographic size reflecting the growth of its main settlement, Eastbourne.
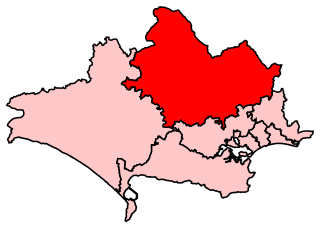
North Dorset is a constituency represented in the House of Commons of the UK Parliament since 2015 by Simon Hoare, a Conservative.
Dewsbury is a constituency created in 1868. This seat is represented in the House of Commons of the United Kingdom Parliament since 2019 by Mark Eastwood of the Conservative Party.
Normanton was a county constituency represented in the House of Commons of the Parliament of the United Kingdom. It elected one Member of Parliament (MP) by the first past the post system of election.
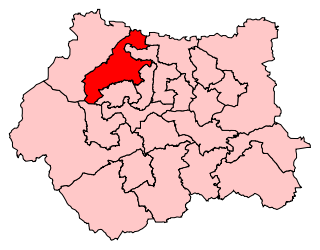
Keighley is a constituency in West Yorkshire created in 1885 represented in the House of Commons of the UK Parliament since 2019 by Robbie Moore of the Conservative Party.
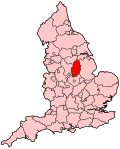
Newark is a constituency in Nottinghamshire, England. It is currently represented by Robert Jenrick of the Conservative Party who won the seat in a by-election on 5 June 2014, following the resignation of Patrick Mercer in April 2014.
Sherwood is a constituency represented in the House of Commons of the UK Parliament since 2010 by Mark Spencer, a Conservative. The constituency's name is common with Sherwood Forest which is in the area.
Bassetlaw is a parliamentary constituency in Nottinghamshire, represented in the House of Commons of the UK Parliament since the 2019 general election by Brendan Clarke-Smith, a Conservative. Before that election, the seat had been part of the so-called "red wall", being held by the Labour Party since 1935.
Broxtowe is a parliamentary constituency in Nottinghamshire, England, represented in the House of Commons of the UK Parliament since 2019 by Darren Henry, a Conservative.
North East Derbyshire is a constituency created in 1885 represented in the House of Commons of the UK Parliament since 2017 by Lee Rowley of the Conservative Party. This was the first time a Conservative candidate had been elected since 1935.
{{cite web}}
: Missing or empty |title=
(help)