Newbury | |
---|---|
County constituency for the House of Commons | |
County | Berkshire |
Electorate | 82,034 (2018) [1] |
Major settlements | Newbury, Thatcham, Hungerford |
Current constituency | |
Created | 1885 |
Member of Parliament | Laura Farris (Conservative) |
Seats | One |
Created from | Berkshire |
Newbury is a constituency represented in the House of Commons of the UK Parliament from 2019 by Laura Farris, a Conservative. It was created by the Redistribution of Seats Act 1885 and has been in continual existence since then.
The constituency consists of most of West Berkshire and includes Newbury, Thatcham and Hungerford. To the east, the rest of West Berkshire is incorporated into the Wokingham and Reading West constituencies. [n 1]
Since its creation it has been a Conservative or Liberal/Liberal Democrat seat, sometimes seemingly marginal and sometimes seen as a safe seat, with a tendency towards being Conservative. [n 2] West Berkshire which is similar to its neighbours has a rather thriving economy with the headquarters of the communications company Vodafone that has created a cluster of around 80 mobile phone related businesses in Newbury, [2] while the Lambourn area is the second most important centre for the racehorse industry in Great Britain, employing over 800 people directly, and producing an annual income of £20 million. [3]
West Berkshire is also home to Atomic Weapons Establishment, near Aldermaston, Wolseley plc, Bayer and PepsiCo. There are high proportions of detached and semi-detached housing, and lower than average dependency on social housing. [4] [5] The seat includes the former family home of Catherine, Duchess of Cambridge, wife of Prince William, Duke of Cambridge in Bucklebury.
The constituencies bordering Newbury (clockwise from north) are: Wantage, Henley, Reading West, Wokingham, Basingstoke, North West Hampshire and Devizes.
Originally, Newbury was part of a larger constituency of Berkshire, which returned two Members of Parliament (MPs), increased to three in the Reform Act of 1832. In the Redistribution of Seats Act of 1885 Berkshire was divided into three county constituencies, Northern (Abingdon), Southern (Newbury), and Eastern (Wokingham), and two borough constituencies, Reading and New Windsor, each returning one member.
The Conservatives have held the constituency for all but seventeen years since the creation of the seat – only three spells of Liberal Party, or Liberal Democrat, majorities have intersected their control. In 2015, the party held the largest majority in the seat since 1935 at 46%, before being reduced to 40.1% in 2017.
Since the February 1974 election, the Liberal Democrats have been one of the two largest parties in the constituency. They most recently gained the seat at the 1993 by-election, holding it until 2005 where it was regained by the Conservatives.
The constituency in 2010 produced the third lowest share of the vote for Labour (4.3%), one of five lost deposits for Labour nationally, below the 5% of the vote deposit threshold. [6] [n 3] In 2017, Labour earned its highest share of the vote in Newbury since the October 1974 election with 14.1% of the vote.
It was estimated that the constituency voted 51% in favour of remaining in the European Union during the 2016 referendum on EU membership, with 49% voting to leave. [7]
In December 2023, the Labour Party included the seat in its published list of 211 non-battleground seats, suggesting they did not see it as winnable. [8]
The constituency was created as the Southern or Newbury Division of Berkshire under the Redistribution of Seats Act 1885, when the three-member Parliamentary County of Berkshire was divided into the three single-member constituencies of Abingdon, Newbury and Wokingham. It comprised:
Only non-resident freeholders of the municipal borough Reading (which comprised the Parliamentary Borough of Reading) were entitled to vote.
Extended eastwards, with the addition of Wokingham and surrounding areas from the abolished Wokingham Division. Small area in the north transferred to Abingdon and areas which had been annexed by Reading County Borough transferred to the Parliamentary Borough thereof.
Wokingham and rural areas to the south and east of Reading transferred to the re-established constituency of Wokingham. Small area transferred from Abingdon.
Gained the Tilehurst ward from the abolished constituency of Reading North. From the 1964 general election, the wards of Norcot and Tilehurst were included following a revision to the local authority wards in Reading. [10]
The two Reading wards were transferred back to the re-established constituency of Reading North. The boundary with Abingdon was slightly amended to take account of changes to local government boundaries.
Gained a small area of the abolished constituency of Abingdon (part of the former Rural District of Wantage) which was retained by Berkshire when the rest of the area comprising Abingdon was transferred to Oxfordshire by the Local Government Act 1972. Areas to the west of Reading included in the new constituency of Reading West.
Small loss to Wokingham in the east of the constituency (Burghfield and Mortimer wards).
Further minor loss to Wokingham.
Further to the 2023 Periodic Review of Westminster constituencies, enacted by the Parliamentary Constituencies Order 2023, from the 2024 United Kingdom general election, the constituency will be composed of the following (as they existed on 1 December 2020):
The electorate will be further reduced to bring it within the permitted range by transferring eastern, rural areas to the new constituency of Reading West and Mid Berkshire.
An incumbent MP has been defeated just four times, in the elections of 1906, 1923, 1924, and 2005.
Election | Member [16] | Party | |
---|---|---|---|
1885 | William George Mount | Conservative | |
1900 | William Mount | Conservative | |
1906 | Frederick Coleridge Mackarness | Liberal | |
1910 | William Mount | Conservative | |
1922 | Howard Clifton Brown | Conservative | |
1923 | Harold Stranger | Liberal | |
1924 | Howard Clifton Brown | Conservative | |
1945 | Anthony Hurd | Conservative | |
1964 | John Astor | Conservative | |
Feb 1974 | Sir Michael McNair-Wilson | Conservative | |
1992 | Judith Chaplin | Conservative | |
1993 by-election | David Rendel | Liberal Democrat | |
2005 | Richard Benyon | Conservative | |
2019 | Independent | ||
Conservative | |||
2019 | Laura Farris | Conservative |
Party | Candidate | Votes | % | ±% | |
---|---|---|---|---|---|
Labour | Liz Bell [17] | ||||
Liberal Democrats | Lee Dillon [18] | ||||
Conservative | Laura Farris [19] | ||||
Green | Steve Masters [20] | ||||
Reform UK | Doug Terry [21] | ||||
Majority | |||||
Turnout | |||||
Swing | |||||
Party | Candidate | Votes | % | ±% | |
---|---|---|---|---|---|
Conservative | Laura Farris | 34,431 | 57.4 | -4.1 | |
Liberal Democrats | Lee Dillon | 18,384 | 30.6 | +9.2 | |
Labour | James Wilder | 4,404 | 7.3 | -6.8 | |
Green | Stephen Masters | 2,454 | 4.1 | +1.6 | |
Independent | Ben Holden-Crowther | 325 | 0.5 | New | |
Majority | 16,047 | 26.8 | -13.3 | ||
Turnout | 59,998 | 71.9 | -1.5 | ||
Conservative hold | Swing | -6.7 | |||
Party | Candidate | Votes | % | ±% | |
---|---|---|---|---|---|
Conservative | Richard Benyon | 37,399 | 61.5 | +0.5 | |
Liberal Democrats | Judith Bunting | 13,019 | 21.4 | +6.4 | |
Labour | Alex Skirvin | 8,596 | 14.1 | +5.7 | |
Green | Paul Field | 1,531 | 2.5 | -1.6 | |
Apolitical Democrats | Dave Yates | 304 | 0.5 | +0.1 | |
Majority | 24,380 | 40.1 | -5.9 | ||
Turnout | 60,849 | 73.4 | +1.3 | ||
Conservative hold | Swing | -3.0 | |||
Party | Candidate | Votes | % | ±% | |
---|---|---|---|---|---|
Conservative | Richard Benyon | 34,973 | 61.0 | +4.6 | |
Liberal Democrats | Judith Bunting | 8,605 | 15.0 | -20.5 | |
UKIP | Catherine Anderson | 6,195 | 10.8 | +8.3 | |
Labour | Jonny Roberts | 4,837 | 8.4 | +4.1 | |
Green | Paul Field | 2,324 | 4.1 | +3.3 | |
Apolitical Democrats | Peter Norman | 228 | 0.4 | +0.2 | |
Independent | Barrie Singleton | 85 | 0.1 | New | |
Patriotic Socialist Party | Andrew Stott | 53 | 0.1 | New | |
Majority | 26,368 | 46.0 | +25.1 | ||
Turnout | 57,300 | 72.1 | +1.9 | ||
Conservative hold | Swing | +12.6 | |||
Party | Candidate | Votes | % | ±% | |
---|---|---|---|---|---|
Conservative | Richard Benyon | 33,057 | 56.4 | +7.4 | |
Liberal Democrats | David Rendel | 20,809 | 35.5 | −7.1 | |
Labour | Hannah Cooper | 2,505 | 4.3 | −1.7 | |
UKIP | David Black | 1,475 | 2.5 | +0.9 | |
Green | Adrian Hollister | 490 | 0.8 | New | |
Independent | Brian Burgess | 158 | 0.3 | New | |
Apolitical Democrat | David Yates | 95 | 0.2 | New | |
Majority | 12,248 | 20.9 | +14.6 | ||
Turnout | 58,589 | 70.2 | −2.4 | ||
Conservative hold | Swing | +7.3 | |||
Party | Candidate | Votes | % | ±% | |
---|---|---|---|---|---|
Conservative | Richard Benyon | 26,771 | 49.0 | +5.5 | |
Liberal Democrats | David Rendel | 23,311 | 42.6 | −5.6 | |
Labour | Oscar Van Nooijen | 3,239 | 5.9 | −1.0 | |
UKIP | David McMahon | 857 | 1.6 | +0.2 | |
Independent | Nick Cornish | 409 | 0.7 | New | |
Independent | Barrie Singleton | 86 | 0.2 | New | |
Majority | 3,460 | 6.4 | N/A | ||
Turnout | 54,673 | 72.0 | +4.7 | ||
Conservative gain from Liberal Democrats | Swing | ||||
Party | Candidate | Votes | % | ±% | |
---|---|---|---|---|---|
Liberal Democrats | David Rendel | 24,507 | 48.2 | −4.7 | |
Conservative | Richard Benyon | 22,092 | 43.5 | +5.7 | |
Labour | Steve Billcliffe | 3,523 | 6.9 | +1.4 | |
UKIP | Delphine Gray-Fisk | 685 | 1.4 | +0.9 | |
Majority | 2,415 | 4.7 | −10.4 | ||
Turnout | 50,807 | 67.3 | −9.0 | ||
Liberal Democrats hold | Swing | ||||
Party | Candidate | Votes | % | ±% | |
---|---|---|---|---|---|
Liberal Democrats | David Rendel | 29,887 | 52.9 | +15.8 | |
Conservative | Richard Benyon | 21,370 | 37.8 | −18.1 | |
Labour | Paul Hannon | 3,107 | 5.5 | −0.6 | |
Referendum | Ted Snook | 992 | 1.8 | New | |
Green | Rachel Stark | 644 | 1.1 | N/A | |
UKIP | R Tubb | 302 | 0.5 | New | |
Socialist Labour | Katrina Howse | 174 | 0.3 | New | |
Majority | 8,517 | 15.1 | N/A | ||
Turnout | 56,476 | 76.3 | +5.0 | ||
Liberal Democrats gain from Conservative | Swing | ||||
Party | Candidate | Votes | % | ±% | |
---|---|---|---|---|---|
Liberal Democrats | David Rendel | 37,590 | 65.1 | +27.8 | |
Conservative | Julian Davidson | 15,535 | 26.9 | −29.0 | |
Labour | Steve Billcliffe | 1,151 | 2.0 | −4.0 | |
Anti-Federalist League | Alan Sked | 601 | 1.0 | New | |
Conservative Candidate | Andrew Bannon | 561 | 1.0 | New | |
Commoners' Party | Stephen Martin | 435 | 0.8 | New | |
Monster Raving Loony | Screaming Lord Sutch | 432 | 0.7 | New | |
Green | Jim Wallis | 341 | 0.6 | −0.2 | |
Referendum Party | Robin Marlar | 338 | 0.6 | New | |
Conservative Rebel | John Browne | 267 | 0.5 | New | |
Corrective Party | Lindi St Clair | 170 | 0.3 | New | |
Maastricht Referendum for Britain | Bill Board | 84 | 0.1 | New | |
Natural Law | Michael Grenville | 60 | 0.1 | New | |
People & Pensioners Party | Johnathon Day | 49 | 0.1 | New | |
21st Century Independent Foresters | Colin Palmer | 40 | 0.1 | New | |
Defence of Children's Humanity Bosnia | Mladen Grbin | 33 | 0.1 | New | |
SDP | Alan Page | 33 | 0.1 | New | |
Communist (PCC) | Anne Murphy | 32 | 0.1 | New | |
Give The Royal Billions To Schools | Michael Stone | 21 | 0.1 | New | |
Majority | 22,055 | 38.2 | N/A | ||
Turnout | 57,399 | 71.3 | −11.46 | ||
Liberal Democrats gain from Conservative | Swing | +28.4 | |||
Party | Candidate | Votes | % | ±% | |
---|---|---|---|---|---|
Conservative | Judith Chaplin | 37,135 | 55.9 | −4.2 | |
Liberal Democrats | David Rendel | 24,778 | 37.3 | +5.6 | |
Labour | Richard J E Hall | 3,962 | 6.0 | −2.1 | |
Green | Jim Wallis | 539 | 0.8 | New | |
Majority | 12,357 | 18.6 | −9.8 | ||
Turnout | 66,414 | 82.8 | +4.8 | ||
Conservative hold | Swing | −4.9 | |||
Party | Candidate | Votes | % | ±% | |
---|---|---|---|---|---|
Conservative | Michael McNair-Wilson | 35,266 | 60.1 | +0.8 | |
Alliance (Liberal) | David Rendel | 18,608 | 31.7 | −3.3 | |
Labour | Robert Stapley | 4,765 | 8.1 | +2.5 | |
Majority | 16,658 | 28.4 | +4.1 | ||
Turnout | 58,639 | 78.0 | +2.8 | ||
Conservative hold | Swing | ||||
Party | Candidate | Votes | % | ±% | |
---|---|---|---|---|---|
Conservative | Michael McNair-Wilson | 31,836 | 59.3 | +6.2 | |
Alliance (Liberal) | Anthony Richards | 18,798 | 35.0 | −1.0 | |
Labour | Richard Knight | 3,027 | 5.6 | −5.2 | |
Majority | 13,038 | 24.3 | +7.2 | ||
Turnout | 53,661 | 75.2 | -4.1 | ||
Conservative hold | Swing | ||||
Party | Candidate | Votes | % | ±% | |
---|---|---|---|---|---|
Conservative | Michael McNair-Wilson | 33,677 | 52.8 | +10.4 | |
Liberal | Anthony Richards | 23,388 | 36.7 | −3.9 | |
Labour | Joan Ruddock | 6,676 | 10.5 | −6.2 | |
Majority | 10,289 | 16.1 | +14.3 | ||
Turnout | 63,741 | 79.3 | +3.0 | ||
Conservative hold | Swing | ||||
Party | Candidate | Votes | % | ±% | |
---|---|---|---|---|---|
Conservative | Michael McNair-Wilson | 23,499 | 42.4 | 0.0 | |
Liberal | Dane Clouston | 22,477 | 40.6 | +0.3 | |
Labour | Celia Fletcher | 9,390 | 16.7 | −0.6 | |
Majority | 1,022 | 1.8 | −0.3 | ||
Turnout | 55,366 | 76.3 | −4.5 | ||
Conservative hold | Swing | ||||
Party | Candidate | Votes | % | ±% | |
---|---|---|---|---|---|
Conservative | Michael McNair-Wilson | 24,620 | 42.4 | -6.4 | |
Liberal | Dane Clouston | 23,419 | 40.3 | +19.0 | |
Labour | Celia Fletcher | 10,935 | 17.3 | -12.6 | |
Majority | 1,201 | 2.1 | -16.7 | ||
Turnout | 58,974 | 80.8 | +8.2 | ||
Conservative hold | Swing | ||||
After the 1970 general election, Newbury's boundaries were altered to reduce the size of the electorate which had grown to over 85,000. After the boundary changes, the electorate numbered around 72,000 people. This came into effect for the first general election in February 1974.
Party | Candidate | Votes | % | ±% | |
---|---|---|---|---|---|
Conservative | John Astor | 30,380 | 48.8 | +3.5 | |
Labour | Timothy Sims | 18,647 | 29.9 | −8.1 | |
Liberal | Dane Clouston | 13,279 | 21.3 | +4.6 | |
Majority | 11,733 | 18.9 | +11.6 | ||
Turnout | 55,392 | 72.6 | −6.5 | ||
Conservative hold | Swing | ||||
Party | Candidate | Votes | % | ±% | |
---|---|---|---|---|---|
Conservative | John Astor | 25,908 | 45.3 | 0.0 | |
Labour | Ronald Spiller | 21,762 | 38.0 | +3.6 | |
Liberal | Stanley Clement Davies | 9,571 | 16.7 | −3.5 | |
Majority | 4,146 | 7.3 | −3.6 | ||
Turnout | 57,241 | 79.1 | −0.2 | ||
Conservative hold | Swing | ||||
Party | Candidate | Votes | % | ±% | |
---|---|---|---|---|---|
Conservative | John Astor | 24,936 | 45.3 | −14.7 | |
Labour | David Stoddart | 18,943 | 34.4 | -5.6 | |
Liberal | Denis Egginton | 11,124 | 20.2 | New | |
Majority | 5,993 | 10.9 | −9.1 | ||
Turnout | 55,003 | 79.3 | +0.6 | ||
Conservative hold | Swing | ||||
Party | Candidate | Votes | % | ±% | |
---|---|---|---|---|---|
Conservative | Anthony Hurd | 29,703 | 60.0 | +1.9 | |
Labour | David Stoddart | 19,787 | 40.0 | −1.9 | |
Majority | 9,916 | 20.0 | +3.8 | ||
Turnout | 49,490 | 78.7 | +0.4 | ||
Conservative hold | Swing | ||||
Party | Candidate | Votes | % | ±% | |
---|---|---|---|---|---|
Conservative | Anthony Hurd | 29,703 | 58.1 | −1.7 | |
Labour | Jon Evans | 18,843 | 41.9 | +1.7 | |
Majority | 7,237 | 16.2 | −3.4 | ||
Turnout | 48,546 | 78.3 | −0.4 | ||
Conservative hold | Swing | ||||
Party | Candidate | Votes | % | ±% | |
---|---|---|---|---|---|
Conservative | Anthony Hurd | 20,102 | 59.8 | +7.0 | |
Labour | Colin Jackson | 13,507 | 40.2 | +5.5 | |
Majority | 6,595 | 19.6 | +1.5 | ||
Turnout | 33,609 | 78.7 | −2.4 | ||
Conservative hold | Swing | ||||
Party | Candidate | Votes | % | ±% | |
---|---|---|---|---|---|
Conservative | Anthony Hurd | 18,150 | 52.8 | +0.4 | |
Labour | Colin Jackson | 11,914 | 34.7 | +1.0 | |
Liberal | Edwin Burrows | 4,284 | 12.5 | -0.5 | |
Majority | 6,236 | 18.1 | -0.6 | ||
Turnout | 34,348 | 81.1 | +15.7 | ||
Conservative hold | Swing | ||||
Party | Candidate | Votes | % | ±% | |
---|---|---|---|---|---|
Conservative | Anthony Hurd | 24,463 | 52.4 | −20.6 | |
Labour | Iris Brook | 15,754 | 33.7 | +6.7 | |
Liberal | Eric Digby Tempest Vane | 6,052 | 13.0 | New | |
Common Wealth | George Booth Suggett | 424 | 0.9 | New | |
Majority | 8,709 | 18.7 | −27.3 | ||
Turnout | 46,693 | 65.4 | −0.1 | ||
Conservative hold | Swing | ||||
Party | Candidate | Votes | % | ±% | |
---|---|---|---|---|---|
Conservative | Howard Clifton Brown | 24,642 | 73.0 | N/A | |
Labour | Richard Russell | 9,125 | 27.0 | New | |
Majority | 15,517 | 46.0 | N/A | ||
Turnout | 33,767 | 65.5 | N/A | ||
Conservative hold | Swing | N/A | |||
Party | Candidate | Votes | % | ±% | |
---|---|---|---|---|---|
Conservative | Howard Clifton Brown | Unopposed | |||
Conservative hold | Swing | N/A | |||
Party | Candidate | Votes | % | ±% | |
---|---|---|---|---|---|
Unionist | Howard Clifton Brown | 17,800 | 51.0 | −4.9 | |
Liberal | Edward Harold Brooks | 13,604 | 39.0 | −0.5 | |
Labour | Frank Jacques | 3,471 | 10.0 | +5.4 | |
Majority | 4,196 | 12.0 | −4.4 | ||
Turnout | 34,875 | 78.3 | −2.6 | ||
Unionist hold | Swing | -2.2 | |||
Party | Candidate | Votes | % | ±% | |
---|---|---|---|---|---|
Unionist | Howard Clifton Brown | 14,759 | 55.9 | +6.0 | |
Liberal | Harold Stranger | 10,444 | 39.5 | −10.6 | |
Labour | Frank Jacques | 1,219 | 4.6 | New | |
Majority | 4,315 | 16.4 | N/A | ||
Turnout | 26,422 | 80.9 | +9.6 | ||
Unionist gain from Liberal | Swing | ||||
Party | Candidate | Votes | % | ±% | |
---|---|---|---|---|---|
Liberal | Harold Stranger | 11,226 | 50.1 | +7.5 | |
Unionist | Howard Clifton Brown | 11,185 | 49.9 | −7.5 | |
Majority | 41 | 0.2 | N/A | ||
Turnout | 22,411 | 71.3 | +1.6 | ||
Liberal gain from Unionist | Swing | +7.5 | |||
Party | Candidate | Votes | % | ±% | |
---|---|---|---|---|---|
Unionist | Howard Clifton Brown | 12,322 | 57.4 | N/A | |
Liberal | Harold Stranger | 9,144 | 42.6 | New | |
Majority | 3,178 | 14.8 | N/A | ||
Turnout | 21,466 | 69.7 | N/A | ||
Unionist hold | Swing | N/A | |||
Party | Candidate | Votes | % | ±% | |
---|---|---|---|---|---|
C | Unionist | Howard Clifton Brown | Unopposed | ||
Unionist hold | |||||
Cindicates candidate endorsed by the coalition government. |
Party | Candidate | Votes | % | ±% | |
---|---|---|---|---|---|
C | Unionist | William Mount | Unopposed | ||
Unionist hold | |||||
Cindicates candidate endorsed by the coalition government. |
Party | Candidate | Votes | % | ±% | |
---|---|---|---|---|---|
Conservative | William Mount | 6,485 | 60.3 | +0.3 | |
Liberal | Lisle March-Phillipps | 4,278 | 39.7 | −0.3 | |
Majority | 2,207 | 20.4 | +0.4 | ||
Turnout | 10,763 | 82.4 | -8.0 | ||
Conservative hold | Swing | ||||
Party | Candidate | Votes | % | ±% | |
---|---|---|---|---|---|
Conservative | William Mount | 7,081 | 60.0 | +12.0 | |
Liberal | Thomas Hedderwick | 4,723 | 40.0 | −12.0 | |
Majority | 2,358 | 20.0 | N/A | ||
Turnout | 11,804 | 90.4 | +2.9 | ||
Conservative gain from Liberal | Swing | ||||
Party | Candidate | Votes | % | ±% | |
---|---|---|---|---|---|
Liberal | Frederick Mackarness | 5,338 | 52.0 | New | |
Conservative | William Mount | 4,936 | 48.0 | N/A | |
Majority | 402 | 4.0 | N/A | ||
Turnout | 10,274 | 87.5 | N/A | ||
Registered electors | 11,746 | ||||
Liberal gain from Conservative | Swing | N/A | |||
Party | Candidate | Votes | % | ±% | |
---|---|---|---|---|---|
Conservative | William Mount | Unopposed | |||
Conservative hold | |||||
Party | Candidate | Votes | % | ±% | |
---|---|---|---|---|---|
Conservative | William Mount | 4,895 | 56.5 | +2.7 | |
Liberal | John Swinburne | 3,766 | 43.5 | −2.7 | |
Majority | 1,129 | 13.0 | +5.4 | ||
Turnout | 8,661 | 81.5 | −1.0 | ||
Registered electors | 10,621 | ||||
Conservative hold | Swing | +2.7 | |||
Party | Candidate | Votes | % | ±% | |
---|---|---|---|---|---|
Conservative | William Mount | 4,588 | 53.8 | N/A | |
Liberal | Thomas Stevens [37] | 3,938 | 46.2 | New | |
Majority | 650 | 7.6 | N/A | ||
Turnout | 8,526 | 82.5 | N/A | ||
Registered electors | 10,338 | ||||
Conservative hold | Swing | N/A | |||
Party | Candidate | Votes | % | ±% | |
---|---|---|---|---|---|
Conservative | William Mount | Unopposed | |||
Conservative hold | |||||
Party | Candidate | Votes | % | ±% | |
---|---|---|---|---|---|
Conservative | William Mount | 4,631 | 51.1 | ||
Liberal | George Palmer | 4,429 | 48.9 | ||
Majority | 202 | 2.2 | |||
Turnout | 9,060 | 86.7 | |||
Registered electors | 10,453 | ||||
Conservative win (new seat) |
The Royal County of Berkshire, commonly known as simply Berkshire, is a ceremonial county in South East England. It is bordered by Oxfordshire to the north, Buckinghamshire to the north-east, Greater London to the east, Surrey to the south-east, Hampshire to the south, and Wiltshire to the west. Reading is the largest settlement and the county town.
Newbury is a market town in West Berkshire, England, in the valley of the River Kennet. It is 26 miles (42 km) south of Oxford, 25 miles (40 km) north of Winchester, 27 miles (43 km) southeast of Swindon and 20 miles (32 km) west of Reading. It is also where West Berkshire Council is headquartered.
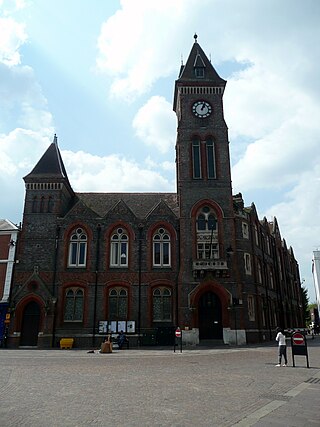
West Berkshire is a unitary authority area in the ceremonial county of Berkshire, England. It is administered from Newbury by West Berkshire Council.
Hungerford is a historic market town and civil parish in Berkshire, England, 8 miles (13 km) west of Newbury, 9 miles (14 km) east of Marlborough, 27 miles (43 km) north-east of Salisbury and 60 miles (97 km) west of London. The Kennet and Avon Canal passes through the town alongside the River Dun, a major tributary of the River Kennet. The confluence with the Kennet is to the north of the centre whence canal and river both continue east. Amenities include schools, shops, cafés, restaurants, and facilities for the main national sports. Hungerford railway station is a minor stop on the Reading to Taunton Line.
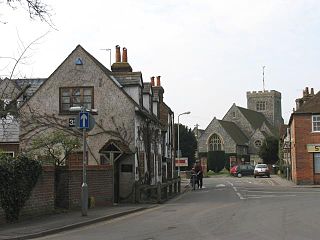
Thatcham is a market town and civil parish in the West Berkshire, England. It is situated in the valley of the River Kennet 3 miles (4.8 km) east of Newbury, 14 miles (23 km) west of Reading and 54 miles (87 km) west of London. The town has a long history dating back to prehistoric times, a claimant to the title of oldest continuously inhabited place in Great Britain. As of 2021, it had a population of 25,464, though it is part of a built-up area comprising itself and neighbouring Newbury of over 70,000 residents. It is on the route of the A4 Bath Road, the historic main road between London and Bristol.
Reading East is a constituency represented in the House of Commons of the UK Parliament since 2017 by Matt Rodda, of the Labour Party. The seat is one of two Labour seats from a total of eight seats in Berkshire.
Reading West is a constituency represented in the House of Commons of the UK Parliament since 2010 by Alok Sharma, a Conservative.
Oxford East is a constituency represented in the House of Commons of the UK Parliament by Anneliese Dodds of the Labour Party, who also serves as party chair.
Oxford West and Abingdon is a constituency represented in the House of Commons of the UK Parliament since 2017 by Layla Moran, a Liberal Democrat.
Wokingham is a constituency in Berkshire represented in the House of Commons of the Parliament of the United Kingdom since 1987 by John Redwood, a Conservative.
Maidenhead is a constituency in Berkshire represented in the House of Commons of the Parliament of the United Kingdom. Since its creation at the 1997 general election, the seat has been held by Conservative Member of Parliament Theresa May, who served as Home Secretary from 2010 to 2016 and as Prime Minister from 2016 to 2019. In March 2024, May announced she would be standing down as an MP at the next general election.
Bracknell is a constituency in Berkshire represented in the House of Commons of the UK Parliament since 2019 by James Sunderland, a Conservative. It was created for the 1997 general election, largely replacing the abolished county constituency of East Berkshire.
Reading was a parliamentary borough, and later a borough constituency in England, represented in the House of Commons of the Parliament of England until 1707, the Parliament of Great Britain from 1707 to 1800, and of the Parliament of the United Kingdom from 1801 to 1950 and 1955 to 1974. Until 1885, the constituency comprised the town of Reading in the county of Berkshire; after 1885, it was centred on the town but the exact boundaries differed.
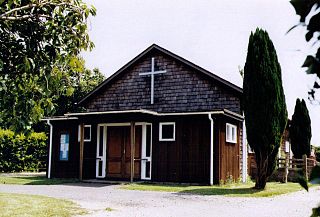
Southend or Bradfield Southend is a small rural village in the west of the civil parish of Bradfield in the English county of Berkshire. Until the 1965 opening of its church it was a hamlet. In the 2011 census it had 738 residents, forming 33.9% of the civil parish's recorded population.
The 2011 West Berkshire Council election took place on 5 May 2011 to elect members of West Berkshire Council in Berkshire, England. The whole council was up for election and the Conservative Party stayed in overall control of the council.
Reading West and Mid Berkshire is a proposed constituency in the House of Commons of the UK Parliament. It was formed as a result of the 2023 Periodic Review of Westminster constituencies and subsumes parts of the Newbury, Wokingham, and, soon to be former, Reading West constituencies. It will be first contested at the next general election.
{{cite book}}
: CS1 maint: multiple names: authors list (link)