North Norfolk | |
---|---|
County constituency for the House of Commons | |
County | Norfolk |
Electorate | 68,277 (December 2010) [1] |
Major settlements | Cromer, North Walsham, Sheringham, Wells-next-the-Sea |
Current constituency | |
Created | 1868 |
Member of Parliament | Duncan Baker (Conservative) |
Seats | one (two 1868–1885) |
Created from | West Norfolk East Norfolk |
North Norfolk is a constituency [n 1] represented in the House of Commons of the UK Parliament since 2019 by Duncan Baker, a Conservative. [n 2]
The seat covers a long stretch of the Norfolk coast including the seaside towns of Cromer, Wells-next-the-Sea and Sheringham.
The North Division of Norfolk was first created by the Reform Act 1867 as one of three two-member divisions of the Parliamentary County of Norfolk. Under the Redistribution of Seats Act 1885, the three two-member county divisions were replaced with six single-member divisions. The second version of this constituency was one of the single-member seats. It has remained as a single-member seat since then, being designated as a County Constituency from the 1950 general election.
Formerly held by Labour from 1945 to 1970, then the Conservatives from 1970 to 2001, the seat was represented by the Liberal Democrat Norman Lamb from 2001 until he stood down for the 2019 general election, when the Conservatives regained the seat from the Lib Dems with a swing of 17.5%.
The 2001 general election marked the first time that a Liberal aligned candidate had won a seat in Norfolk since 1929. This was to be followed by the election of Simon Wright in Norwich South in 2010. While Wright's success was short-lived (he was defeated in 2015), Lamb retained his seat, which at the 2015 election was one of only two Liberal Democrat seats in southern England, and one of only eight in the whole UK. At the 2017 general election, in which the Liberal Democrats lost five of their nine seats, North Norfolk was one of the four held. Although the seat had been held by Labour for the 25 years following World War II, Labour have slumped to a distant third in recent years, and came fourth in 2015, and last in a narrower field of three candidates in 2017.
North Norfolk was described by the Earl of Leicester as "the one constituency in England where, in 1964, it was so feudal that it had to be explained to the electors that the ballot was secret." [2] Feudal is used as a metaphor, or shorthand, meaning constitutionally backward.
The seat was formed largely from northern parts of the abolished Eastern Division, with a small part transferred from the Western Division. It also absorbed the Parliamentary Borough of Great Yarmouth, which had been disenfranchised for corruption under the Act.
Great Yarmouth re-established as a single-member Parliamentary Borough. Eastern parts were transferred to the re-established Eastern Division.
Gained the area around Fakenham from the abolished North-Western Division, and lost small areas in the south to the Eastern and South-Western Divisions.
Gained North Walsham and the Rural District of Smallburgh from the abolished Eastern Division. An area comprising the former Rural District of Aylsham (now part of the St Faith's and Aylsham Rural District) was transferred to the new constituency of Central Norfolk.
Gained the Rural District of St Faiths and Aylsham, including Hellesdon and Sprowston, from the now abolished constituency of Central Norfolk. Wells-next-the-Sea and the Rural District of Walsingham, including Fakenham, were transferred to the re-established constituency of North West Norfolk.
The seat was extended westwards, regaining Wells-next-the-Sea and areas comprising the former Rural District of Walsingham, including Fakenham, from North West Norfolk. Suburbs of Norwich, including Hellesdon and Sprowston, were transferred to Norwich North, and remaining southern areas, including Aylsham, to the new constituency of Mid Norfolk.
Fakenham and surrounding areas were transferred out once again to the new constituency of Broadland.
Further to the 2023 Periodic Review of Westminster constituencies, enacted by the Parliamentary Constituencies Order 2023, from the next general election, due by January 2025, the constituency will be composed of the following wards of the District of North Norfolk (as they existed on 1st December 2020):
Bacton; Beeston Regis & The Runtons; Briston; Coastal; Cromer Town; Erpingham; Gresham; Happisburgh; Hickling; Holt; Hoveton & Tunstead; Mundesley; North Walsham East; North Walsham Market Cross; North Walsham West; Poppyland; Priory; Roughton; St. Benet’s; Sheringham North; Sheringham South; Stalham; Stody; Suffield Park; Trunch; Wells with Holkham; Worstead. [10]
Minor gain following changes to local authority ward boundaries.
Election | 1st member [11] | 1st party | 2nd member [11] | 2nd party | ||
---|---|---|---|---|---|---|
1868 | constituency created | |||||
1868 | Frederick Walpole | Conservative | Sir Edmund Lacon | Conservative | ||
1876 by-election | James Duff | Conservative | ||||
1879 by-election | Edward Birkbeck | Conservative | ||||
1885 | reduced to one member |
Election | Member [11] | Party | |
---|---|---|---|
1885 | Herbert Cozens-Hardy | Liberal | |
1899 by-election | William Brampton Gurdon | Liberal | |
Jan 1910 | Noel Buxton | Liberal | |
1918 | Douglas King | Coalition Independent | |
1920 | Coalition Conservative | ||
1922 | Noel Buxton | Labour | |
1930 by-election | Lady Noel-Buxton | Labour | |
1931 | Thomas Cook | Conservative | |
1945 | Edwin Gooch | Labour | |
1964 | Bert Hazell | Labour | |
1970 | Ralph Howell | Conservative | |
1997 | David Prior | Conservative | |
2001 | Sir Norman Lamb | Liberal Democrats | |
2019 | Duncan Baker | Conservative |
Party | Candidate | Votes | % | ±% | |
---|---|---|---|---|---|
Liberal Democrats | Steffan Aquarone [12] | ||||
Labour | Cathy Cordiner-Achenbach [13] | ||||
Green | Liz Dixon [14] | ||||
Majority | |||||
Turnout |
Party | Candidate | Votes | % | ±% | |
---|---|---|---|---|---|
Conservative | Duncan Baker | 29,792 | 58.6 | +16.9 | |
Liberal Democrats | Karen Ward | 15,397 | 30.3 | -18.1 | |
Labour | Emma Corlett | 3,895 | 7.7 | -2.2 | |
Brexit Party | Harry Gywnne | 1,739 | 3.4 | New | |
Majority | 14,395 | 28.3 | N/A | ||
Turnout | 50,823 | 71.9 | -3.4 | ||
Conservative gain from Liberal Democrats | Swing | +17.5 | |||
Sir Norman Lamb did not stand for re-election. The seat saw the largest decrease in the Liberal Democrat vote share at the 2019 general election, [16] and the third highest increase in vote share for the Conservatives. [17]
Party | Candidate | Votes | % | ±% | |
---|---|---|---|---|---|
Liberal Democrats | Norman Lamb | 25,260 | 48.4 | +9.3 | |
Conservative | James Wild | 21,748 | 41.7 | +10.8 | |
Labour | Stephen Burke | 5,180 | 9.9 | -0.3 | |
Majority | 3,512 | 6.7 | -1.5 | ||
Turnout | 52,188 | 75.3 | +3.6 | ||
Liberal Democrats hold | Swing | -0.8 | |||
Party | Candidate | Votes | % | ±% | |
---|---|---|---|---|---|
Liberal Democrats | Norman Lamb | 19,299 | 39.1 | -16.4 | |
Conservative | Ann Steward | 15,256 | 30.9 | -1.2 | |
UKIP | Michael Baker | 8,328 | 16.9 | +11.5 | |
Labour | Denise Burke | 5,043 | 10.2 | +4.4 | |
Green | Mike Macartney-Filgate | 1,488 | 3.0 | +2.0 | |
Majority | 4,043 | 8.2 | -15.2 | ||
Turnout | 49,414 | 71.7 | -1.5 | ||
Liberal Democrats hold | Swing | -7.6 | |||
Party | Candidate | Votes | % | ±% | |
---|---|---|---|---|---|
Liberal Democrats | Norman Lamb | 27,554 | 55.5 | +2.3 | |
Conservative | Trevor Ivory | 15,928 | 32.1 | -3.9 | |
Labour | Phil Harris | 2,896 | 5.8 | -3.1 | |
UKIP | Michael Baker | 2,680 | 5.4 | +3.7 | |
Green | Andrew Boswell | 508 | 1.0 | New | |
Independent | Simon Mann | 95 | 0.2 | New | |
Majority | 11,626 | 23.4 | +5.4 | ||
Turnout | 49,661 | 73.2 | +0.5 | ||
Liberal Democrats hold | Swing | +3.1 | |||
Party | Candidate | Votes | % | ±% | |
---|---|---|---|---|---|
Liberal Democrats | Norman Lamb | 31,515 | 53.4 | +10.7 | |
Conservative | Iain Dale | 20,909 | 35.5 | −6.3 | |
Labour | Phil Harris | 5,447 | 9.2 | −4.1 | |
UKIP | Stuart Agnew | 978 | 1.7 | +0.6 | |
Independent | Justin Appleyard | 116 | 0.2 | New | |
Majority | 10,606 | 17.9 | +17.0 | ||
Turnout | 58,965 | 73.0 | +2.8 | ||
Liberal Democrats hold | Swing | +8.5 | |||
Party | Candidate | Votes | % | ±% | |
---|---|---|---|---|---|
Liberal Democrats | Norman Lamb | 23,978 | 42.7 | +8.4 | |
Conservative | David Prior | 23,495 | 41.8 | +5.3 | |
Labour | Mike Gates | 7,490 | 13.3 | -11.8 | |
Green | Mike Sheridan | 649 | 1.2 | New | |
UKIP | Paul Simison | 608 | 1.1 | New | |
Majority | 483 | 0.9 | N/A | ||
Turnout | 56,220 | 70.2 | -5.8 | ||
Liberal Democrats gain from Conservative | Swing | +1.5 | |||
Party | Candidate | Votes | % | ±% | |
---|---|---|---|---|---|
Conservative | David Prior | 21,456 | 36.5 | -11.8 | |
Liberal Democrats | Norman Lamb | 20,163 | 34.3 | +7.0 | |
Labour | Michael Cullingham | 14,736 | 25.1 | +1.9 | |
Referendum | John Allen | 2,458 | 4.2 | New | |
Majority | 1,293 | 2.2 | -18.8 | ||
Turnout | 58,813 | 76.0 | -4.8 | ||
Conservative hold | Swing | -9.5 | |||
Party | Candidate | Votes | % | ±% | |
---|---|---|---|---|---|
Conservative | Ralph Howell | 28,810 | 48.3 | -5.0 | |
Liberal Democrats | Norman Lamb | 16,265 | 27.3 | +2.3 | |
Labour | Michael Cullingham | 13,850 | 23.2 | +3.3 | |
Green | Angie Zelter | 559 | 0.9 | -0.8 | |
Natural Law | S. Jackson | 167 | 0.3 | New | |
Majority | 12,545 | 21.0 | -7.3 | ||
Turnout | 59,651 | 80.8 | +3.3 | ||
Conservative hold | Swing | -3.6 | |||
Party | Candidate | Votes | % | ±% | |
---|---|---|---|---|---|
Conservative | Ralph Howell | 28,822 | 53.3 | -0.7 | |
Alliance | Neil Anthony | 13,512 | 25.0 | -1.8 | |
Labour | Anthony Earle | 10,765 | 19.9 | +0.7 | |
Green | Michael Filgate | 960 | 1.8 | New | |
Majority | 15,310 | 28.3 | +1.1 | ||
Turnout | 54,059 | 77.5 | +2.9 | ||
Conservative hold | Swing | +0.5 | |||
Party | Candidate | Votes | % | ±% | |
---|---|---|---|---|---|
Conservative | Ralph Howell | 26,230 | 54.0 | -2.9 | |
Alliance | John Elworthy | 13,007 | 26.8 | +13.0 | |
Labour | Edward Barber | 9,317 | 19.2 | -9.4 | |
Majority | 13,223 | 27.2 | -1.1 | ||
Turnout | 48,554 | 74.6 | -4.1 | ||
Conservative hold | Swing | ||||
Party | Candidate | Votes | % | ±% | |
---|---|---|---|---|---|
Conservative | Ralph Howell | 43,952 | 56.9 | +8.8 | |
Labour | R. S. Dimmick | 22,126 | 28.6 | -3.4 | |
Liberal | Gustav Rex Collings | 10,643 | 13.8 | -6.1 | |
National Front | A. C. R. Sizeland | 548 | 0.7 | New | |
Majority | 21,826 | 28.3 | +12.2 | ||
Turnout | 72,269 | 78.7 | +2.2 | ||
Conservative hold | Swing | +6.1 | |||
Party | Candidate | Votes | % | ±% | |
---|---|---|---|---|---|
Conservative | Ralph Howell | 33,312 | 48.1 | +0.5 | |
Labour | D. M. Mason | 22,191 | 32.0 | +3.4 | |
Liberal | Richard Moore | 13,776 | 19.9 | -3.9 | |
Majority | 11,121 | 16.1 | -2.9 | ||
Turnout | 69,279 | 76.5 | -6.9 | ||
Conservative hold | Swing | ||||
Party | Candidate | Votes | % | ±% | |
---|---|---|---|---|---|
Conservative | Ralph Howell | 35,684 | 47.6 | -7.7 | |
Labour | D. M. Mason | 21,394 | 28.6 | -16.1 | |
Liberal | Richard Moore | 17,853 | 23.8 | New | |
Majority | 14,290 | 19.0 | +8.4 | ||
Turnout | 74,931 | 83.4 | +3.1 | ||
Conservative hold | Swing | ||||
Party | Candidate | Votes | % | ±% | |
---|---|---|---|---|---|
Conservative | Ralph Howell | 24,587 | 55.3 | +6.2 | |
Labour | Bert Hazell | 19,903 | 44.7 | -6.2 | |
Majority | 4,684 | 10.6 | N/A | ||
Turnout | 44,490 | 80.3 | -2.9 | ||
Conservative gain from Labour | Swing | ||||
Party | Candidate | Votes | % | ±% | |
---|---|---|---|---|---|
Labour | Bert Hazell | 20,796 | 50.90 | ||
Conservative | Ralph Howell | 20,059 | 49.10 | ||
Majority | 737 | 1.80 | |||
Turnout | 40,855 | 83.19 | |||
Labour hold | Swing | ||||
Party | Candidate | Votes | % | ±% | |
---|---|---|---|---|---|
Labour | Bert Hazell | 19,360 | 50.1 | -0.7 | |
Conservative | Frank Henry Easton | 19,307 | 49.9 | +0.8 | |
Majority | 53 | 0.2 | -1.5 | ||
Turnout | 38,667 | 79.7 | -0.1 | ||
Labour hold | Swing | ||||
Party | Candidate | Votes | % | ±% | |
---|---|---|---|---|---|
Labour | Edwin Gooch | 19,784 | 50.85 | ||
National Liberal | Frank Henry Easton | 19,126 | 49.15 | ||
Majority | 658 | 1.70 | |||
Turnout | 38,910 | 79.81 | |||
Labour hold | Swing | ||||
Party | Candidate | Votes | % | ±% | |
---|---|---|---|---|---|
Labour | Edwin Gooch | 20,899 | 51.53 | ||
National Liberal | William Scarlett Jameson | 19,657 | 48.47 | ||
Majority | 1,242 | 3.06 | |||
Turnout | 40,556 | 81.64 | |||
Labour hold | Swing | ||||
Party | Candidate | Votes | % | ±% | |
---|---|---|---|---|---|
Labour | Edwin Gooch | 21,067 | 50.33 | ||
National Liberal | Douglas M. Reid | 20,788 | 49.67 | ||
Majority | 279 | 0.66 | |||
Turnout | 41,855 | 83.66 | |||
Labour hold | Swing | ||||
Party | Candidate | Votes | % | ±% | |
---|---|---|---|---|---|
Labour | Edwin Gooch | 19,790 | 47.99 | ||
National Liberal | Douglas M. Reid | 17,741 | 43.03 | ||
Liberal | Arnold Hilward Jones | 3,703 | 8.98 | New | |
Majority | 2,049 | 4.96 | |||
Turnout | 41,234 | 84.31 | |||
Labour hold | Swing | ||||
Party | Candidate | Votes | % | ±% | |
---|---|---|---|---|---|
Labour | Edwin Gooch | 17,753 | 58.67 | ||
Conservative | Thomas Cook | 12,507 | 41.33 | ||
Majority | 5,246 | 17.34 | N/A | ||
Turnout | 30,260 | 70.94 | |||
Labour gain from Conservative | Swing | ||||
Party | Candidate | Votes | % | ±% | |
---|---|---|---|---|---|
Conservative | Thomas Cook | 17,863 | 55.26 | ||
Labour | Lucy Noel-Buxton | 14,465 | 44.74 | ||
Majority | 3,398 | 10.52 | |||
Turnout | 32,328 | 78.14 | |||
Conservative hold | Swing | ||||
Party | Candidate | Votes | % | ±% | |
---|---|---|---|---|---|
Conservative | Thomas Cook | 19,988 | 60.53 | ||
Labour | Lucy Noel-Buxton | 13,035 | 39.47 | ||
Majority | 6,953 | 21.06 | N/A | ||
Turnout | 33,023 | 82.27 | |||
Conservative gain from Labour | Swing | ||||
Party | Candidate | Votes | % | ±% | |
---|---|---|---|---|---|
Labour | Lucy Noel-Buxton | 14,821 | 50.3 | +2.8 | |
Conservative | Thomas Cook | 14,642 | 49.7 | +8.4 | |
Majority | 179 | 0.6 | -5.6 | ||
Turnout | 29,463 | 75.0 | -2.9 | ||
Labour hold | Swing | -2.8 | |||
Party | Candidate | Votes | % | ±% | |
---|---|---|---|---|---|
Labour | Noel Buxton | 14,544 | 47.5 | −1.2 | |
Unionist | Thomas Cook | 12,661 | 41.3 | +0.7 | |
Liberal | Zelia Hoffman | 3,407 | 11.1 | +0.4 | |
Majority | 1,883 | 6.2 | −1.9 | ||
Turnout | 30,612 | 77.9 | +0.8 | ||
Registered electors | 39,272 | ||||
Labour hold | Swing | −1.0 | |||
Party | Candidate | Votes | % | ±% | |
---|---|---|---|---|---|
Labour | Noel Buxton | 11,978 | 48.7 | −8.9 | |
Unionist | Thomas Cook | 9,974 | 40.6 | −1.8 | |
Liberal | Maurice Alexander | 2,637 | 10.7 | New | |
Majority | 2,004 | 8.1 | −7.1 | ||
Turnout | 24,589 | 77.1 | +8.8 | ||
Registered electors | 31,913 | ||||
Labour hold | Swing | −3.6 | |||
Party | Candidate | Votes | % | ±% | |
---|---|---|---|---|---|
Labour | Noel Buxton | 12,278 | 57.6 | +5.4 | |
Unionist | Brian Smith | 9,022 | 42.4 | −5.4 | |
Majority | 3,256 | 15.2 | +10.8 | ||
Turnout | 21,300 | 68.3 | −6.9 | ||
Registered electors | 31,205 | ||||
Labour hold | Swing | +5.4 | |||
Party | Candidate | Votes | % | ±% | |
---|---|---|---|---|---|
Labour | Noel Buxton | 12,004 | 52.2 | +2.8 | |
Unionist | Roger Bowan Crewdson | 10,975 | 47.8 | New | |
Majority | 1,029 | 4.4 | N/A | ||
Turnout | 22,979 | 75.2 | +14.4 | ||
Registered electors | 30,556 | ||||
Labour gain from Independent | Swing | ||||
Party | Candidate | Votes | % | ±% | |
---|---|---|---|---|---|
C | Independent | Douglas King * | 9,274 | 50.6 | +3.8 |
Liberal | Noel Buxton | 9,061 | 49.4 | −3.8 | |
Majority | 213 | 1.2 | N/A | ||
Turnout | 18,335 | 60.8 | −25.9 | ||
Registered electors | 30,179 | ||||
Independent gain from Liberal | Swing | +3.8 | |||
Cindicates candidate endorsed by the coalition government. |
* King was named a Unionist candidate in the official list of Coalition Government endorsements, but he wrote to The Times stating he had left the party before the election and should be classed as an independent. He later rejoined the party.
General election 1914–15: Another general election was required to take place before the end of 1915. The political parties had been making preparations for an election to take place and by the July 1914, the following candidates had been selected;
Party | Candidate | Votes | % | ±% | |
---|---|---|---|---|---|
Liberal | Noel Noel-Buxton | 5,187 | 53.6 | +0.6 | |
Conservative | Douglas King | 4,491 | 46.4 | −0.6 | |
Majority | 696 | 7.2 | +1.2 | ||
Turnout | 9,678 | 86.7 | −1.0 | ||
Registered electors | 11,169 | ||||
Liberal hold | Swing | +0.6 | |||
Party | Candidate | Votes | % | ±% | |
---|---|---|---|---|---|
Liberal | Noel Noel-Buxton | 5,189 | 53.0 | −5.7 | |
Conservative | Douglas King | 4,604 | 47.0 | +5.7 | |
Majority | 585 | 6.0 | −11.4 | ||
Turnout | 9,793 | 87.7 | +6.3 | ||
Registered electors | 11,169 | ||||
Liberal hold | Swing | −5.7 | |||
Party | Candidate | Votes | % | ±% | |
---|---|---|---|---|---|
Liberal | William Brampton Gurdon | 5,155 | 58.7 | +2.5 | |
Conservative | F. T. S. Rippingall | 3,628 | 41.3 | −2.5 | |
Majority | 1,527 | 17.4 | +5.0 | ||
Turnout | 8,783 | 81.4 | +3.6 | ||
Registered electors | 10,795 | ||||
Liberal hold | Swing | +2.5 | |||
Party | Candidate | Votes | % | ±% | |
---|---|---|---|---|---|
Liberal | William Brampton Gurdon | 4,490 | 56.2 | +3.0 | |
Conservative | Henry Spencer Follett | 3,493 | 43.8 | −3.0 | |
Majority | 997 | 12.4 | +6.0 | ||
Turnout | 7,983 | 77.8 | −2.7 | ||
Registered electors | 10,261 | ||||
Liberal hold | Swing | +3.0 | |||
Party | Candidate | Votes | % | ±% | |
---|---|---|---|---|---|
Liberal | William Brampton Gurdon | 4,775 | 57.0 | +3.8 | |
Conservative | Kenneth Kemp | 3,610 | 43.0 | −3.8 | |
Majority | 1,165 | 14.0 | +7.6 | ||
Turnout | 8,385 | 83.7 | +3.2 | ||
Registered electors | 10,017 | ||||
Liberal hold | Swing | +3.8 | |||
Party | Candidate | Votes | % | ±% | |
---|---|---|---|---|---|
Liberal | Herbert Cozens-Hardy | 4,246 | 53.2 | −5.0 | |
Conservative | Kenneth Kemp | 3,738 | 46.8 | +5.0 | |
Majority | 508 | 6.4 | −10.0 | ||
Turnout | 7,984 | 80.5 | −9.5 | ||
Registered electors | 9,924 | ||||
Liberal hold | Swing | −5.0 | |||
Party | Candidate | Votes | % | ±% | |
---|---|---|---|---|---|
Liberal | Herbert Cozens-Hardy | 4,561 | 58.2 | +3.1 | |
Conservative | John Cator [32] | 3,278 | 41.8 | −3.1 | |
Majority | 1,283 | 16.4 | +6.2 | ||
Turnout | 7,839 | 90.0 | +14.0 | ||
Registered electors | 8,713 | ||||
Liberal hold | Swing | +3.1 | |||
Party | Candidate | Votes | % | ±% | |
---|---|---|---|---|---|
Liberal | Herbert Cozens-Hardy | 4,084 | 55.1 | -5.0 | |
Conservative | Ailwyn Fellowes | 3,324 | 44.9 | +5.0 | |
Majority | 760 | 10.2 | -10.0 | ||
Turnout | 7,408 | 76.0 | -9.9 | ||
Registered electors | 9,742 | ||||
Liberal hold | Swing | −5.0 | |||
Party | Candidate | Votes | % | ±% | |
---|---|---|---|---|---|
Liberal | Herbert Cozens-Hardy | 5,028 | 60.1 | New | |
Conservative | Samuel Hoare | 3,342 | 39.9 | N/A | |
Majority | 1,686 | 20.2 | N/A | ||
Turnout | 8,370 | 85.9 | N/A | ||
Registered electors | 9,742 | ||||
Liberal gain from Conservative | Swing | N/A | |||
Party | Candidate | Votes | % | ±% | |
---|---|---|---|---|---|
Conservative | Edward Birkbeck | Unopposed | |||
Conservative | Edmund Lacon | Unopposed | |||
Registered electors | 6,519 | ||||
Conservative hold | |||||
Party | Candidate | Votes | % | ±% | |
---|---|---|---|---|---|
Conservative | Edward Birkbeck | 2,742 | 54.9 | N/A | |
Liberal | Thomas Buxton | 2,252 | 45.1 | N/A | |
Majority | 490 | 9.8 | N/A | ||
Turnout | 4,994 | 77.1 | N/A | ||
Registered electors | 6,474 | ||||
Conservative hold | |||||
Party | Candidate | Votes | % | ±% | |
---|---|---|---|---|---|
Conservative | James Duff | 2,302 | 51.2 | N/A | |
Liberal | Thomas Buxton | 2,192 | 48.8 | New | |
Majority | 110 | 2.4 | N/A | ||
Turnout | 4,494 | 72.1 | N/A | ||
Registered electors | 6,231 | ||||
Conservative hold | |||||
Party | Candidate | Votes | % | ±% | |
---|---|---|---|---|---|
Conservative | Frederick Walpole | Unopposed | |||
Conservative | Edmund Lacon | Unopposed | |||
Registered electors | 6,325 | ||||
Conservative hold | |||||
Party | Candidate | Votes | % | ±% | |
---|---|---|---|---|---|
Conservative | Frederick Walpole | 2,630 | 27.7 | ||
Conservative | Edmund Lacon | 2,563 | 27.0 | ||
Liberal | Edmond Wodehouse | 2,235 | 23.5 | ||
Liberal | Robert Gurdon [34] | 2,078 | 21.9 | ||
Majority | 328 | 3.5 | |||
Turnout | 4,753 (est) | 73.9 (est) | |||
Registered electors | 6,432 | ||||
Conservative win (new seat) | |||||
Conservative win (new seat) |
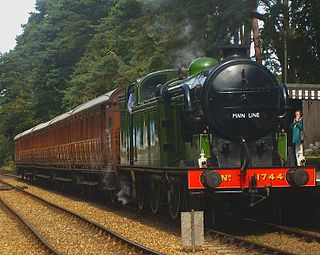
The North Norfolk Railway (NNR) – also known as the "Poppy Line" – is a 5+1⁄4-mile (8.4 km) heritage steam railway in Norfolk, England, running between the towns of Sheringham and Holt. The North Norfolk Railway is owned and operated as a public limited company, originally called Central Norfolk Enterprises Limited. The railway is listed as exempt from the UK Railways (Interoperability) Regulations 2000.
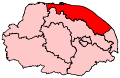
North Norfolk is a local government district in Norfolk, England. Its council is based in Cromer, and the largest town is North Walsham. The district also includes the towns of Fakenham, Holt, Sheringham, Stalham and Wells-next-the-Sea, along with numerous villages and surrounding rural areas.
Norwich North is a constituency represented in the House of Commons of the UK Parliament since 2009 by Conservative Chloe Smith.
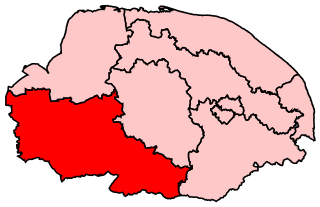
South West Norfolk is a constituency represented in the House of Commons of the UK Parliament since 2010 by Liz Truss of the Conservative Party, who briefly served as Prime Minister of the United Kingdom from September to October 2022.
North West Norfolk is a constituency represented in the House of Commons of the UK Parliament since 2019 by James Wild, a Conservative.
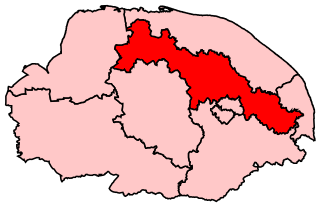
Mid Norfolk is a constituency represented in the House of Commons of the UK Parliament since 2010 by George Freeman, a Conservative.
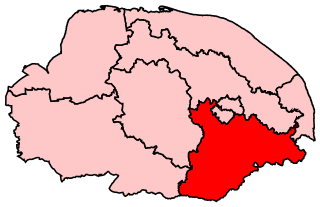
South Norfolk is a constituency represented in the House of Commons of the UK Parliament since 2001 by Richard Bacon, a Conservative.
Ingworth is a village and a civil parish in the English county of Norfolk. It is 1.7 miles (2.7 km) north of Aylsham, 14.3 miles (23.0 km) north of Norwich, 7.3 miles (11.7 km) east of North Walsham and 9 miles (14 km) south-southwest of Cromer. The nearest railway station is at North Walsham, which is located on the Bittern Line between Sheringham and Norwich. The nearest airport is Norwich International Airport. The village is bypassed by the A140 road, 0.9 miles (1.4 km) to the west. The village and parish of Ingworth had, in the 2001 census, a population of 94. For the purposes of local government, the village falls within the district of North Norfolk. The population taken at the 2011 census remained less than 100 and was included in the civil parish of Erpingham.
Broadland is a Norfolk constituency, which has been represented in the House of Commons of the UK Parliament since the 2019 general election by Jerome Mayhew, a Conservative.
East Norfolk was a constituency in the county of Norfolk that returned two members of parliament to the House of Commons of the Parliament of the United Kingdom from 1832 until 1868. It was re-established in 1885 with representation of one member. That seat was abolished in 1950.
The NR postcode area, also known as the Norwich postcode area, is a group of 35 postcode districts in the east of England, within 16 post towns. These cover central and eastern Norfolk and part of north-east Suffolk.
Thursford is a village and civil parish in the county of Norfolk, eastern England. The village is 16.3 miles southwest of Cromer, 24.5 miles northwest of Norwich and 121 miles north-east of London. The village lies 6.9 miles northwest of the nearby town of Fakenham. The nearest railway station is at Sheringham for the Bittern Line which runs between Sheringham, Cromer and Norwich. The nearest airport is Norwich International Airport. The village once had its own Thursford railway station which is now closed. It is a proposed stop on the Norfolk Orbital Railway.
The East Norfolk Railway was a pre-grouping railway company operating a standard gauge 25 mile, mostly single track, railway running between Norwich Thorpe railway station and Cromer in the English county of Norfolk. It opened in 1874, reaching Cromer three years later, and remains mostly operational. The company also operated a branch between Wroxham and County School, which closed to passengers in 1952, and had proposed a branch to Blakeney in 1878, which was never constructed.
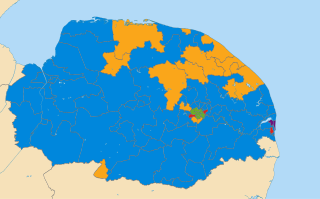
The Norfolk County Council election took place on 4 June 2009, coinciding with local elections for all county councils in England.
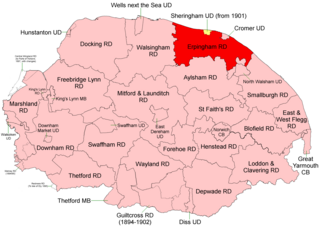
Erpingham Rural District was a rural district in Norfolk, England from 1894 to 1974.
Smallburgh Rural District was a rural district in Norfolk, England from 1894 to 1974.