West Derbyshire | |
---|---|
Former County constituency for the House of Commons | |
County | Derbyshire |
Major settlements | Bakewell, Matlock, Wirksworth |
1885–2010 | |
Seats | One |
Created from | North Derbyshire |
Replaced by | Derbyshire Dales |
West Derbyshire was a county constituency represented in the House of Commons of the Parliament of the United Kingdom. From 1885, until it was replaced by the Derbyshire Dales constituency in the 2010 general election, it elected one Member of Parliament (MP) by the first past the post voting system. It was a safe Conservative seat for most of its existence.
This was the only really safe Conservative seat in Derbyshire, consisting mostly of rural villages and tourist towns like Bakewell and Matlock; Labour's only strengths were in Wirksworth and Masson, not enough to end the long-standing Conservative representation of this seat.
Following their review of parliamentary representation in Derbyshire, the Boundary Commission for England created a new constituency of Derbyshire Dales based on the existing West Derbyshire constituency.
Historically associated with the Cavendish family, the seat and its predecessors were usually represented by one of the future Dukes of Devonshire or their relatives from 1580 until the Second World War. When the Cavendish family left the Liberals over Irish Home Rule the seat stayed loyal to them as they sat first as Liberal Unionists then as Conservatives. In 1918 the hold on the constituency was briefly broken by Charles Frederick White standing for the Liberals, but the seat was regained in 1923. In a by-election in 1944, White's son, also called Charles Frederick White resigned as the official Labour nominee in order to stand against the wartime party truce. He defeated the Conservative candidate, William Cavendish, Marquess of Hartington, and subsequently took the Labour whip in the Commons, holding the seat in the 1945 general election for Labour. The Conservatives regained the seat in the 1950 general election and have held it ever since. The closest they have come to losing was in the 1986 by-election when they held it by only 100 votes in a period of heavy unpopularity for the government of Margaret Thatcher.
Party | Candidate | Votes | % | ±% | |
---|---|---|---|---|---|
Liberal | Edward Cavendish | 5,020 | 54.8 | ||
Conservative | Frederic Charles Arkwright | 4,138 | 45.2 | ||
Majority | 882 | 9.6 | |||
Turnout | 9,158 | 88.8 | |||
Registered electors | 10,310 | ||||
Liberal win (new seat) |
Party | Candidate | Votes | % | ±% | |
---|---|---|---|---|---|
Liberal Unionist | Edward Cavendish | Unopposed | |||
Liberal Unionist gain from Liberal |
Party | Candidate | Votes | % | ±% | |
---|---|---|---|---|---|
Liberal Unionist | Victor Cavendish | Unopposed | |||
Liberal Unionist hold | |||||
Party | Candidate | Votes | % | ±% | |
---|---|---|---|---|---|
Liberal Unionist | Victor Cavendish | 5,961 | 68.3 | N/A | |
Liberal | Hugh MacDermot | 2,768 | 31.7 | New | |
Majority | 3,193 | 36.6 | N/A | ||
Turnout | 8,729 | 73.0 | N/A | ||
Registered electors | 11,956 | ||||
Liberal Unionist hold | Swing | N/A | |||
Party | Candidate | Votes | % | ±% | |
---|---|---|---|---|---|
Liberal Unionist | Victor Cavendish | Unopposed | |||
Liberal Unionist hold | |||||
Party | Candidate | Votes | % | ±% | |
---|---|---|---|---|---|
Liberal Unionist | Victor Cavendish | Unopposed | |||
Liberal Unionist hold | |||||
Party | Candidate | Votes | % | ±% | |
---|---|---|---|---|---|
Liberal Unionist | Victor Cavendish | Unopposed | |||
Liberal Unionist hold | |||||
Party | Candidate | Votes | % | ±% | |
---|---|---|---|---|---|
Liberal Unionist | Victor Cavendish | 5,283 | 52.8 | N/A | |
Liberal | Edward Hinmers | 4,724 | 47.2 | New | |
Majority | 559 | 5.6 | N/A | ||
Turnout | 10,007 | 87.5 | N/A | ||
Registered electors | 11,443 | ||||
Liberal Unionist hold | Swing | N/A | |||
Party | Candidate | Votes | % | ±% | |
---|---|---|---|---|---|
Liberal Unionist | Henry Petty-Fitzmaurice | Unopposed | |||
Liberal Unionist hold | |||||
Party | Candidate | Votes | % | ±% | |
---|---|---|---|---|---|
Liberal Unionist | Henry Petty-Fitzmaurice | 5,974 | 54.8 | +2.0 | |
Liberal | Edward Hinmers | 4,925 | 45.2 | −2.0 | |
Majority | 1,049 | 9.6 | +4.0 | ||
Turnout | 10,899 | 91.1 | +3.6 | ||
Registered electors | 11,962 | ||||
Liberal Unionist hold | Swing | +2.0 | |||
Party | Candidate | Votes | % | ±% | |
---|---|---|---|---|---|
Liberal Unionist | Henry Petty-Fitzmaurice | 5,624 | 55.2 | +0.4 | |
Liberal | Charles White | 4,564 | 44.8 | −0.4 | |
Majority | 1,060 | 10.4 | +0.8 | ||
Turnout | 10,188 | 85.2 | −5.9 | ||
Registered electors | 11,962 | ||||
Liberal Unionist hold | Swing | +0.4 | |||
General Election 1914–15:
Another General Election was required to take place before the end of 1915. The political parties had been making preparations for an election to take place and by the July 1914, the following candidates had been selected;
Party | Candidate | Votes | % | ±% | |
---|---|---|---|---|---|
Liberal | Charles White | 10,752 | 55.6 | +10.8 | |
C | Unionist | Henry Petty-Fitzmaurice | 8,592 | 44.4 | −10.8 |
Majority | 2,160 | 11.2 | N/A | ||
Turnout | 19,344 | 66.0 | −19.2 | ||
Registered electors | 29,323 | ||||
Liberal gain from Unionist | Swing | +10.8 | |||
Cindicates candidate endorsed by the coalition government. |
Party | Candidate | Votes | % | ±% | |
---|---|---|---|---|---|
Liberal | Charles White | 13,060 | 50.2 | −5.4 | |
Unionist | Edward Cavendish | 12,973 | 49.8 | +5.4 | |
Majority | 87 | 0.4 | −10.8 | ||
Turnout | 26,033 | 86.1 | +20.1 | ||
Registered electors | 30,231 | ||||
Liberal hold | Swing | −5.4 | |||
Party | Candidate | Votes | % | ±% | |
---|---|---|---|---|---|
Unionist | Edward Cavendish | 13,419 | 50.9 | +1.1 | |
Liberal | William Christopher Mallison | 12,966 | 49.1 | −1.1 | |
Majority | 453 | 1.8 | N/A | ||
Turnout | 26,385 | 84.9 | −1.2 | ||
Registered electors | 31,067 | ||||
Unionist gain from Liberal | Swing | +1.1 | |||
Party | Candidate | Votes | % | ±% | |
---|---|---|---|---|---|
Unionist | Edward Cavendish | 15,324 | 56.9 | +6.0 | |
Liberal | William Christopher Mallison | 11,612 | 43.1 | −6.0 | |
Majority | 3,712 | 13.8 | +12.0 | ||
Turnout | 26,936 | 84.8 | −0.1 | ||
Registered electors | 31,757 | ||||
Unionist hold | Swing | +6.0 | |||
Party | Candidate | Votes | % | ±% | |
---|---|---|---|---|---|
Unionist | Edward Cavendish | 16,760 | 49.7 | −7.2 | |
Liberal | William Christopher Mallison | 13,277 | 39.4 | −3.7 | |
Labour | William Wilkinson | 3,660 | 10.9 | New | |
Majority | 3,483 | 10.3 | −3.5 | ||
Turnout | 33,697 | 83.2 | −1.6 | ||
Registered electors | 40,487 | ||||
Unionist hold | Swing | −1.8 | |||
Party | Candidate | Votes | % | ±% | |
---|---|---|---|---|---|
Conservative | Edward Cavendish | Unopposed | N/A | N/A | |
Conservative hold | Swing | ||||
Party | Candidate | Votes | % | ±% | |
---|---|---|---|---|---|
Conservative | Edward Cavendish | Unopposed | N/A | N/A | |
Conservative hold | Swing | ||||
Party | Candidate | Votes | % | ±% | |
---|---|---|---|---|---|
Conservative | Henry Hunloke | 16,740 | 48.6 | N/A | |
Labour | Charles White | 11,216 | 32.5 | New | |
Liberal | Milner Gray | 6,515 | 18.9 | New | |
Majority | 5,524 | 16.1 | N/A | ||
Turnout | 34,471 | 79.4 | N/A | ||
Conservative hold | Swing | ||||
General Election 1939–40
Another General Election was required to take place before the end of 1940. The political parties had been making preparations for an election to take place from 1939 and by the end of this year, the following candidates had been selected;
Party | Candidate | Votes | % | ±% | |
---|---|---|---|---|---|
Independent Labour | Charles White | 16,336 | 57.7 | N/A | |
Conservative | Marquess of Hartington | 11,775 | 41.5 | N/A | |
Agriculturalist | Robert Goodall | 233 | 0.8 | New | |
Majority | 4,561 | 16.2 | N/A | ||
Turnout | 28,344 | 65.4 | N/A | ||
Independent Labour gain from Conservative | Swing | ||||
Party | Candidate | Votes | % | ±% | |
---|---|---|---|---|---|
Labour | Charles White | 18,331 | 48.8 | +16.3 | |
Conservative | William Aitken | 18,175 | 48.4 | −0.2 | |
Agriculturalist | Robert Goodall | 1,068 | 2.8 | N/A | |
Majority | 156 | 0.4 | N/A | ||
Turnout | 37,574 | 81.7 | +2.3 | ||
Labour gain from Conservative | Swing | ||||
Party | Candidate | Votes | % | ±% | |
---|---|---|---|---|---|
Conservative | Edward Wakefield | 20,015 | 51.9 | +3.5 | |
Labour | N. Gratton | 13,478 | 35.0 | −13.8 | |
Liberal | George Frederick Strange | 5,070 | 13.2 | New | |
Majority | 6,537 | 16.9 | N/A | ||
Turnout | 33,563 | 87.5 | +5.8 | ||
Conservative gain from Labour | Swing | ||||
Party | Candidate | Votes | % | ±% | |
---|---|---|---|---|---|
Conservative | Edward Wakefield | 22,223 | 58.8 | +6.9 | |
Labour | Ronald Lewis | 15,578 | 41.2 | +6.2 | |
Majority | 6,645 | 17.6 | +0.7 | ||
Turnout | 37,801 | 84.4 | −3.1 | ||
Conservative hold | Swing | ||||
Party | Candidate | Votes | % | ±% | |
---|---|---|---|---|---|
Conservative | Edward Wakefield | 21,052 | 59.6 | +0.8 | |
Labour | Robert B. Stirling | 14,296 | 40.4 | −0.8 | |
Majority | 6,756 | 19.2 | +1.6 | ||
Turnout | 35,348 | 80.0 | −4.4 | ||
Conservative hold | Swing | ||||
Party | Candidate | Votes | % | ±% | |
---|---|---|---|---|---|
Conservative | Edward Wakefield | 22,034 | 61.3 | +1.7 | |
Labour | Albert E. Kitts | 13,925 | 38.7 | −1.7 | |
Majority | 8,109 | 22.6 | +3.5 | ||
Turnout | 35,959 | 82.0 | +2.0 | ||
Conservative hold | Swing | ||||
Party | Candidate | Votes | % | ±% | |
---|---|---|---|---|---|
Conservative | Aidan Crawley | 12,455 | 36.0 | −25.3 | |
Liberal | Ronald Gardner-Thorpe | 11,235 | 32.5 | New | |
Labour | John Dilks | 9,431 | 27.2 | −11.5 | |
Independent | Raymond Gregory | 1,433 | 4.1 | New | |
Majority | 1,220 | 3.5 | −19.1 | ||
Turnout | 34,554 | ||||
Conservative hold | Swing | ||||
Party | Candidate | Votes | % | ±% | |
---|---|---|---|---|---|
Conservative | Aidan Crawley | 16,825 | 44.2 | −18.1 | |
Liberal | Ronald Gardner-Thorpe | 11,559 | 30.4 | N/A | |
Labour | John Dilks | 9,669 | 25.4 | −13.3 | |
Majority | 5,266 | 13.8 | −8.8 | ||
Turnout | 38,053 | 85.8 | +3.8 | ||
Conservative hold | Swing | ||||
Party | Candidate | Votes | % | ±% | |
---|---|---|---|---|---|
Conservative | Aidan Crawley | 18,383 | 49.6 | +5.4 | |
Labour | Phillip Whitehead | 13,791 | 37.2 | +11.8 | |
Liberal | Peggy Edwards | 4,874 | 13.2 | −17.2 | |
Majority | 4,592 | 12.4 | −1.4 | ||
Turnout | 37,048 | 83.4 | −2.4 | ||
Conservative hold | Swing | ||||
Party | Candidate | Votes | % | ±% | |
---|---|---|---|---|---|
Conservative | James Scott-Hopkins | 16,319 | 56.7 | +7.1 | |
Liberal | Michael Aza Pinney | 5,696 | 19.8 | +6.6 | |
Labour | Robin Corbett | 5,284 | 18.3 | −18.9 | |
Independent | Robert Goodall | 1,496 | 5.2 | New | |
Majority | 10,623 | 36.9 | +24.5 | ||
Turnout | 28,795 | 64.5 | −18.9 | ||
Conservative hold | Swing | ||||
Party | Candidate | Votes | % | ±% | |
---|---|---|---|---|---|
Conservative | James Scott-Hopkins | 22,692 | 61.9 | +12.3 | |
Labour | Fred Inglis | 13,976 | 38.1 | +0.9 | |
Majority | 8,716 | 23.8 | +11.4 | ||
Turnout | 36,668 | 76.7 | −6.7 | ||
Conservative hold | Swing | ||||
Party | Candidate | Votes | % | ±% | |
---|---|---|---|---|---|
Conservative | James Scott-Hopkins | 19,941 | 48.7 | −13.2 | |
Liberal | Peter Worboys | 11,481 | 28.0 | New | |
Labour | Fred Inglis | 9,529 | 23.3 | −14.8 | |
Majority | 8,460 | 20.7 | −3.1 | ||
Turnout | 40,951 | 61.8 | −14.9 | ||
Conservative hold | Swing | ||||
Party | Candidate | Votes | % | ±% | |
---|---|---|---|---|---|
Conservative | James Scott-Hopkins | 18,468 | 47.9 | −0.8 | |
Liberal | Peter Worboys | 10,622 | 27.6 | −0.4 | |
Labour | David Townsend | 9,456 | 24.5 | +1.2 | |
Majority | 7,846 | 20.3 | −0.4 | ||
Turnout | 38,546 | 57.6 | −4.2 | ||
Conservative hold | Swing | ||||
Party | Candidate | Votes | % | ±% | |
---|---|---|---|---|---|
Conservative | Matthew Parris | 21,478 | 52.6 | +4.7 | |
Liberal | Peter Worboys | 11,261 | 27.6 | 0.0 | |
Labour | William Moore | 8,134 | 19.9 | −4.6 | |
Majority | 10,217 | 25.0 | +4.7 | ||
Turnout | 40,873 | 80.7 | +23.1 | ||
Conservative hold | Swing | ||||
Party | Candidate | Votes | % | ±% | |
---|---|---|---|---|---|
Conservative | Matthew Parris | 29,695 | 55.9 | +3.3 | |
Liberal | Viv Bingham | 14,370 | 27.0 | −0.6 | |
Labour | John March | 9,060 | 17.1 | −2.8 | |
Majority | 15,325 | 28.9 | +3.9 | ||
Turnout | 53,125 | 77.4 | −3.3 | ||
Conservative hold | Swing | ||||
Party | Candidate | Votes | % | ±% | |
---|---|---|---|---|---|
Conservative | Patrick McLoughlin | 19,896 | 39.5 | −16.4 | |
Liberal | Christopher Walmsley | 19,796 | 39.4 | +12.4 | |
Labour | William Moore | 9,952 | 19.8 | +2.7 | |
Rainbow Dream Ticket | R. C. Sidwell | 348 | 0.7 | New | |
Independent | Robert Goodall | 289 | 0.6 | New | |
Majority | 100 | 0.1 | −28.8 | ||
Turnout | 50,281 | 71.9 | −5.5 | ||
Conservative hold | Swing | ||||
Party | Candidate | Votes | % | ±% | |
---|---|---|---|---|---|
Conservative | Patrick McLoughlin | 31,224 | 53.1 | −2.8 | |
Liberal | Christopher Walmsley | 20,697 | 35.2 | +8.2 | |
Labour | William Moore | 6,875 | 11.7 | −5.4 | |
Majority | 10,527 | 17.9 | −11.0 | ||
Turnout | 58,796 | 83.1 | +5.7 | ||
Conservative hold | Swing | ||||
Party | Candidate | Votes | % | ±% | |
---|---|---|---|---|---|
Conservative | Patrick McLoughlin | 32,879 | 54.3 | +1.2 | |
Liberal Democrats | RD Fearn | 14,110 | 23.3 | −11.9 | |
Labour | Stephen J Clamp | 13,528 | 22.4 | +10.7 | |
Majority | 18,769 | 31.0 | +13.1 | ||
Turnout | 60,517 | 85.0 | +1.9 | ||
Conservative hold | Swing | +6.6 | |||
Party | Candidate | Votes | % | ±% | |
---|---|---|---|---|---|
Conservative | Patrick McLoughlin | 23,945 | 42.1 | ||
Labour | Stephen J Clamp | 19,060 | 33.5 | ||
Liberal Democrats | Christopher Seeley | 9,940 | 17.5 | ||
Referendum | John Gouriet | 2,499 | 4.4 | New | |
Independent Green | Godfrey Meynell | 593 | 1.0 | New | |
UKIP | Hugh Price | 484 | 0.9 | New | |
Monster Raving Loony | "The Flying Brick" Delves | 281 | 0.5 | New | |
Independent Back to Basics | Martin Kyslun | 81 | 0.1 | New | |
Majority | 4,885 | 8.6 | |||
Turnout | 56,883 | 78.2 | |||
Conservative hold | Swing | ||||
Party | Candidate | Votes | % | ±% | |
---|---|---|---|---|---|
Conservative | Patrick McLoughlin | 24,280 | 48.0 | +5.9 | |
Labour | Stephen J Clamp | 16,910 | 33.4 | −0.1 | |
Liberal Democrats | Jeremy Beckett | 7,922 | 15.7 | −1.8 | |
UKIP | Stuart Bavester | 672 | 1.3 | +0.4 | |
Monster Raving Loony | "The Flying Brick" Delves | 472 | 0.9 | +0.4 | |
Independent | Robert Goodall | 333 | 0.7 | New | |
Majority | 7,370 | 14.6 | +6.0 | ||
Turnout | 50,589 | 67.8 | −10.5 | ||
Conservative hold | Swing | ||||
Party | Candidate | Votes | % | ±% | |
---|---|---|---|---|---|
Conservative | Patrick McLoughlin | 24,378 | 47.7 | −0.3 | |
Labour | David Menon | 13,625 | 26.6 | −6.8 | |
Liberal Democrats | Ray Dring | 11,408 | 22.3 | +6.6 | |
UKIP | Michael Cruddas | 1,322 | 2.6 | +1.3 | |
Monster Raving Loony | "The Flying Brick" Delves | 405 | 0.8 | −0.1 | |
Independent | Martin Kyslun | 5 | 0.0 | New | |
Majority | 10,753 | 21.0 | +6.4 | ||
Turnout | 51,143 | 69.2 | +1.4 | ||
Conservative hold | Swing | +3.2 | |||
Craig, F. W. S. (1983). British parliamentary election results 1918–1949 (3 ed.). Chichester: Parliamentary Research Services. ISBN 0-900178-06-X.
High Peak is a parliamentary constituency represented in the House of Commons of the UK Parliament since 2019 by Robert Largan, a Conservative.
Barrow and Furness, formerly known as Barrow-in-Furness, is a constituency in Cumbria which has been represented in the House of Commons of the UK Parliament by Simon Fell of the Conservative Party since 2019.
Liverpool, Walton is a constituency represented in the House of Commons of the UK Parliament since 2017 by Dan Carden of the Labour Party. Carden won the highest percentage share of the vote in June 2017 of 650 constituencies, 85.7%. It is the safest Labour seat in the United Kingdom, and the safest seat in the country having been won by 85% of the vote in the most recent election in 2019.
Normanton was a county constituency represented in the House of Commons of the Parliament of the United Kingdom. It elected one Member of Parliament (MP) by the first past the post system of election.
Bassetlaw is a parliamentary constituency in Nottinghamshire, represented in the House of Commons of the UK Parliament since the 2019 general election by Brendan Clarke-Smith, a Conservative. Before that election, the seat had been part of the so-called "red wall", being held by the Labour Party since 1929.
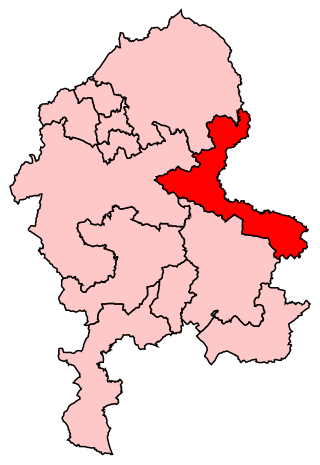
Burton is a constituency represented in the House of Commons of the Parliament of the United Kingdom. It elects one Member of Parliament (MP) by the first past the post system of election.
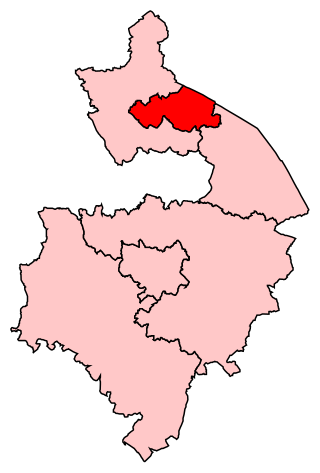
Nuneaton is a constituency represented in the House of Commons of the UK Parliament since 2010 by Marcus Jones, a Conservative. Since 1997, the seat has been seen as an important national bellwether.
Fareham is a constituency in Hampshire represented in the House of Commons of the UK Parliament. Since 2015, it has been represented by Suella Braverman of the Conservative Party.
Exeter is a constituency composed of the cathedral city and county town of Devon represented in the House of Commons of the UK Parliament. The constituency has had a history of representatives from 1900 of Conservative, Liberal Party, Independent and Labour representation.
Christchurch is a constituency in Dorset represented in the House of Commons of the UK Parliament since 1997 by Sir Christopher Chope of the Conservative Party.
Forest of Dean is a constituency in Gloucestershire represented in the House of Commons of the UK Parliament since 2005 by Mark Harper, a Conservative who has served as Secretary of State for Transport since 2022.
Bristol East is a constituency recreated in 1983 covering the eastern part of the City of Bristol, represented in the House of Commons of the UK Parliament since 2005 by Kerry McCarthy of the Labour Party.
Edinburgh Central was a burgh constituency of the House of Commons of the Parliament of the United Kingdom from 1885 to 2005. It elected one Member of Parliament (MP) by the first past the post system of election.
Glasgow Govan was a parliamentary constituency in the Govan district of Glasgow. It was represented in the House of Commons of the Parliament of the United Kingdom for 120 years; from 1885 until 2005, returning one Member of Parliament (MP) elected by the first-past-the-post system.
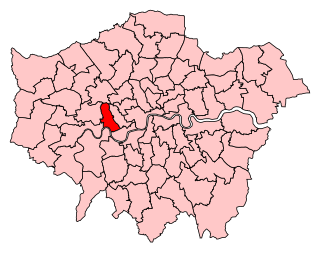
Hammersmith is a parliamentary constituency in the House of Commons of the UK Parliament. It is currently represented by Andy Slaughter, a member of the Labour Party, who has represented the seat since its recreation in 2010.
Mid Derbyshire is a constituency represented in the House of Commons of the UK Parliament since its 2010 creation by Pauline Latham, a Conservative.
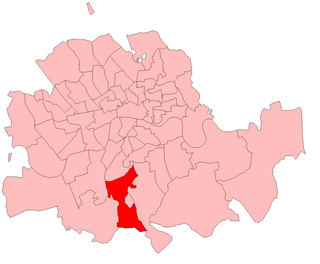
Peckham was a borough constituency in South London which returned one Member of Parliament (MP) to the House of Commons of the Parliament of the United Kingdom. Elections were held using the first-past-the-post voting system.
Norwood was a parliamentary constituency in south London which returned one Member of Parliament (MP) to the House of Commons of the Parliament of the United Kingdom by the first past the post system.
Kingston or Kingston-upon-Thames was a parliamentary constituency which covered the emerging southwest, outer London suburb of Kingston upon Thames and which existed between 1885 and 1997 and returned one Member of Parliament (MP) to the House of Commons of the UK Parliament. The Conservative candidate won each election during its 112-year existence.
Holland with Boston was a county constituency represented in the House of Commons of the Parliament of the United Kingdom from 1918 to 1997. It elected one Member of Parliament (MP) by the first past the post system of election.