| ||||||||||||||||||||||||||||
20 seats from odd-numbered districts in the California State Senate | ||||||||||||||||||||||||||||
---|---|---|---|---|---|---|---|---|---|---|---|---|---|---|---|---|---|---|---|---|---|---|---|---|---|---|---|---|
| ||||||||||||||||||||||||||||
Results: Democratic hold Democratic gain Republican hold | ||||||||||||||||||||||||||||
|
This article needs additional citations for verification .(January 2024) |
Elections in California |
---|
The 2012 California State Senate election was held on November 6, 2012, with the primary election on June 5, 2012. Voters in the 20 odd-numbered districts of the California State Senate voted for their representatives. Other elections were also held on November 6. The same year, voters also passed Proposition 28 that relaxed term limits on legislators in both chambers. [1]
California State Senate elections, 2012 Primary election — June 5, 2012 | ||||||
---|---|---|---|---|---|---|
Party | Votes | Percentage | Candidates | Advancing to general | Seats contesting | |
Democratic | 1,534,788 | 59.34% | 28 | 22 | 20 | |
Republican | 1,015,668 | 39.27% | 20 | 16 | 16 | |
Libertarian | 23,098 | 0.89% | 2 | 0 | 0 | |
No party preference | 11,923 | 0.46% | 1 | 0 | 0 | |
Peace and Freedom | 788 | 0.03% | 2 | 2 | 2 | |
Totals | 2,586,265 | 100.00% | 53 | 40 | — |
California State Senate elections, 2012 General election — November 6, 2012 | ||||||||
---|---|---|---|---|---|---|---|---|
Party | Votes | Percentage | Not up | Contested | Before | After | +/– | |
Democratic | 4,035,256 | 62.61% | 14 | 11 | 25 | 29 | 4 | |
Republican | 2,321,286 | 36.02% | 6 | 9 | 14† | 10† | 4 | |
Peace and Freedom | 88,658 | 1.38% | 0 | 0 | 0 | 0 | ||
Totals | 6,445,200 | 100.00% | 20 | 20 | 39† | 39† | — |
† The 4th district, which was not up for election in this cycle, was vacant due to the resignation of Republican Doug LaMalfa.
↓ | |||
29 | 1 | 10 | |
Democratic | Vacant | Republican |
District 1 • District 3 • District 5 • District 7 • District 9 • District 11 • District 13 • District 15 • District 17 • District 19 • District 21 • District 23 • District 25 • District 27 • District 29 • District 31 • District 33 • District 35 • District 37 • District 39 |
Primary election | ||||
---|---|---|---|---|
Party | Candidate | Votes | % | |
Republican | Ted Gaines (incumbent) | 110,168 | 48.2 | |
Democratic | Julie Griffith-Flatter | 68,947 | 30.2 | |
Republican | Les Baugh | 37,442 | 16.4 | |
No party preference | "Bo" Bogdan I. Ambrozewicz | 11,923 | 5.2 | |
Total votes | 228,480 | 100.0 | ||
General election | ||||
Republican | Ted Gaines (incumbent) | 263,256 | 63.7 | |
Democratic | Julie Griffith-Flatter | 150,111 | 36.3 | |
Total votes | 413,367 | 100.0 | ||
Republican hold | ||||
Primary election | ||||
---|---|---|---|---|
Party | Candidate | Votes | % | |
Democratic | Lois Wolk (incumbent) | 116,403 | 96.9 | |
Republican | Frank Miranda (write-in) | 2,402 | 2.0 | |
Republican | Gary Clift (write-in) | 1,341 | 1.1 | |
Total votes | 120,146 | 100.0 | ||
General election | ||||
Democratic | Lois Wolk (incumbent) | 233,406 | 66.2 | |
Republican | Frank Miranda | 119,033 | 33.8 | |
Total votes | 352,439 | 100.0 | ||
Democratic hold | ||||
Primary election | |||||
---|---|---|---|---|---|
Party | Candidate | Votes | % | ||
Democratic | Cathleen Galgiani | 52,148 | 40.7 | ||
Republican | Bill Berryhill | 45,819 | 35.8 | ||
Republican | Leroy Ornellas | 30,109 | 23.5 | ||
Total votes | 128,076 | 100.0 | |||
General election | |||||
Democratic | Cathleen Galgiani | 142,145 | 50.5 | ||
Republican | Bill Berryhill | 139,502 | 49.5 | ||
Total votes | 281,647 | 100.0 | |||
Democratic win (new seat) |
Primary election | ||||
---|---|---|---|---|
Party | Candidate | Votes | % | |
Democratic | Mark DeSaulnier (incumbent) | 91,224 | 57.0 | |
Republican | Mark P. Meuser | 68,730 | 43.0 | |
Total votes | 159,954 | 100.0 | ||
General election | ||||
Democratic | Mark DeSaulnier (incumbent) | 229,105 | 61.5 | |
Republican | Mark P. Meuser | 143,707 | 38.5 | |
Total votes | 372,812 | 100.0 | ||
Democratic hold | ||||
Primary election | ||||
---|---|---|---|---|
Party | Candidate | Votes | % | |
Democratic | Loni Hancock (incumbent) | 123,624 | 99.3 | |
Peace and Freedom | Mary Catherine McIlroy (write-in) | 785 | 0.6 | |
Libertarian | Lisa D. Ringer (write-in) | 95 | 0.1 | |
Total votes | 124,504 | 100.0 | ||
General election | ||||
Democratic | Loni Hancock (incumbent) | 300,994 | 85.8 | |
Peace and Freedom | Mary Catherine McIlroy | 49,987 | 14.2 | |
Total votes | 350,981 | 100.0 | ||
Democratic hold | ||||
Primary election | ||||
---|---|---|---|---|
Party | Candidate | Votes | % | |
Democratic | Mark Leno (incumbent) | 118,023 | 82.0 | |
Republican | Harmeet Dhillon | 25,828 | 18.0 | |
Total votes | 143,851 | 100.0 | ||
General election | ||||
Democratic | Mark Leno (incumbent) | 303,241 | 84.7 | |
Republican | Harmeet Dhillon | 54,887 | 15.3 | |
Total votes | 358,128 | 100.0 | ||
Democratic hold | ||||
Primary election | ||||
---|---|---|---|---|
Party | Candidate | Votes | % | |
Democratic | Jerry Hill | 76,033 | 51.1 | |
Democratic | Sally J. Lieber | 33,566 | 22.5 | |
Libertarian | John H. Webster | 23,003 | 15.4 | |
Democratic | Christopher Kent Chiang | 16,317 | 11.0 | |
Total votes | 148,919 | 100.0 | ||
General election | ||||
Democratic | Jerry Hill | 218,775 | 66.1 | |
Democratic | Sally J. Lieber | 112,321 | 33.9 | |
Total votes | 331,096 | 100.0 | ||
Democratic hold | ||||
Primary election | ||||
---|---|---|---|---|
Party | Candidate | Votes | % | |
Democratic | Jim Beall | 69,179 | 55.5 | |
Democratic | Joe Coto | 55,387 | 44.5 | |
Total votes | 124,566 | 100.0 | ||
General election | ||||
Democratic | Jim Beall | 160,451 | 56.7 | |
Democratic | Joe Coto | 122,345 | 43.3 | |
Total votes | 282,796 | 100.0 | ||
Democratic hold | ||||
Primary election | ||||
---|---|---|---|---|
Party | Candidate | Votes | % | |
Democratic | Bill Monning | 110,890 | 59.4 | |
Republican | Larry Beaman | 75,713 | 40.6 | |
Total votes | 186,603 | 100.0 | ||
General election | ||||
Democratic | Bill Monning | 236,213 | 63.3 | |
Republican | Larry Beaman | 136,836 | 36.7 | |
Total votes | 373,049 | 100.0 | ||
Democratic gain from Republican | ||||
Primary election | ||||
---|---|---|---|---|
Party | Candidate | Votes | % | |
Republican | Mike Stoker | 69,252 | 44.9 | |
Democratic | Hannah-Beth Jackson | 64,219 | 41.6 | |
Democratic | Jason Hodge | 20,828 | 13.5 | |
Total votes | 154,299 | 100.0 | ||
General election | ||||
Democratic | Hannah-Beth Jackson | 180,780 | 55.7 | |
Republican | Mike Stoker | 143,819 | 44.3 | |
Total votes | 324,599 | 100.0 | ||
Democratic gain from Republican | ||||
Primary election | ||||
---|---|---|---|---|
Party | Candidate | Votes | % | |
Republican | Steve Knight | 61,245 | 69.0 | |
Democratic | Star Moffatt | 27,545 | 31.0 | |
Total votes | 88,790 | 100.0 | ||
General election | ||||
Republican | Steve Knight | 153,412 | 57.6 | |
Democratic | Star Moffatt | 112,780 | 42.4 | |
Total votes | 266,192 | 100.0 | ||
Republican hold | ||||
Primary election | ||||
---|---|---|---|---|
Party | Candidate | Votes | % | |
Republican | Bill Emmerson (incumbent) | 70,465 | 65.0 | |
Democratic | Melissa Ruth O'Donnell | 37,939 | 35.0 | |
Total votes | 108,404 | 100.0 | ||
General election | ||||
Republican | Bill Emmerson (incumbent) | 159,045 | 56.3 | |
Democratic | Melissa Ruth O'Donnell | 123,518 | 43.7 | |
Total votes | 282,563 | 100.0 | ||
Republican gain from Democratic | ||||
Primary election | ||||
---|---|---|---|---|
Party | Candidate | Votes | % | |
Democratic | Carol Liu (incumbent) | 62,930 | 51.3 | |
Republican | Gilbert V. Gonzales | 53,093 | 43.3 | |
Democratic | Ameenah Fuller | 6,592 | 5.4 | |
Total votes | 122,615 | 100.0 | ||
General election | ||||
Democratic | Carol Liu (incumbent) | 213,127 | 60.8 | |
Republican | Gilbert V. Gonzales | 137,651 | 39.2 | |
Total votes | 350,778 | 100.0 | ||
Democratic hold | ||||
Primary election | ||||
---|---|---|---|---|
Party | Candidate | Votes | % | |
Republican | Todd Zink | 68,384 | 51.1 | |
Democratic | Fran Pavley (incumbent) | 65,552 | 48.9 | |
Total votes | 133,936 | 100.0 | ||
General election | ||||
Democratic | Fran Pavley (incumbent) | 197,757 | 53.6 | |
Republican | Todd Zink | 171,438 | 46.4 | |
Total votes | 369,195 | 100.0 | ||
Democratic hold | ||||
Primary election | ||||
---|---|---|---|---|
Party | Candidate | Votes | % | |
Republican | Bob Huff (incumbent) | 68,708 | 64.3 | |
Democratic | Greg Diamond | 38,169 | 35.7 | |
Total votes | 106,877 | 100.0 | ||
General election | ||||
Republican | Bob Huff (incumbent) | 160,912 | 55.1 | |
Democratic | Greg Diamond | 131,228 | 44.9 | |
Total votes | 292,140 | 100.0 | ||
Republican hold | ||||
Primary election | |||||
---|---|---|---|---|---|
Party | Candidate | Votes | % | ||
Republican | Jeff Miller | 38,641 | 51.1 | ||
Democratic | Richard Roth | 21,812 | 28.8 | ||
Democratic | Steve Clute | 15,191 | 20.1 | ||
Total votes | 75,644 | 100.0 | |||
General election | |||||
Democratic | Richard Roth | 133,882 | 55.3 | ||
Republican | Jeff Miller | 108,320 | 44.7 | ||
Total votes | 242,202 | 100.0 | |||
Democratic win (new seat) |
Primary election | ||||
---|---|---|---|---|
Party | Candidate | Votes | % | |
Democratic | Ricardo Lara | 35,865 | 100.0 | |
Peace and Freedom | Lee H. Chauser (write-in) | 3 | 0.0 | |
Total votes | 35,868 | 100.0 | ||
General election | ||||
Democratic | Ricardo Lara | 158,707 | 80.4 | |
Peace and Freedom | Lee H. Chauser | 38,671 | 19.6 | |
Total votes | 197,378 | 100.0 | ||
Democratic hold | ||||
Primary election | ||||
---|---|---|---|---|
Party | Candidate | Votes | % | |
Democratic | Roderick Wright (incumbent) | 40,312 | 57.4 | |
Republican | Charlotte A. Svolos | 18,793 | 26.8 | |
Democratic | Paul Butterfield | 11,091 | 15.8 | |
Total votes | 70,196 | 100.0 | ||
General election | ||||
Democratic | Roderick Wright (incumbent) | 192,483 | 76.5 | |
Republican | Charlotte A. Svolos | 59,077 | 23.5 | |
Total votes | 251,560 | 100.0 | ||
Democratic hold | ||||
Primary election | ||||
---|---|---|---|---|
Party | Candidate | Votes | % | |
Republican | Mimi Walters (incumbent) | 88,321 | 63.6 | |
Democratic | Steve Young | 50,562 | 36.4 | |
Total votes | 138,883 | 100.0 | ||
General election | ||||
Republican | Mimi Walters (incumbent) | 213,086 | 57.0 | |
Democratic | Steve Young | 160,595 | 43.0 | |
Total votes | 373,681 | 100.0 | ||
Republican hold | ||||
Primary election | ||||
---|---|---|---|---|
Party | Candidate | Votes | % | |
Democratic | Marty Block | 85,930 | 46.3 | |
Republican | George Plescia | 81,214 | 43.7 | |
Democratic | Patrick L. Marsh | 18,510 | 10.0 | |
Total votes | 185,654 | 100.0 | ||
General election | ||||
Democratic | Marty Block | 221,012 | 58.4 | |
Republican | George Plescia | 157,305 | 41.6 | |
Total votes | 378,317 | 100.0 | ||
Democratic hold | ||||
The Michigan Legislature is the legislature of the U.S. state of Michigan. It is organized as a bicameral body composed of an upper chamber, the Senate, and a lower chamber, the House of Representatives. Article IV of the Michigan Constitution, adopted in 1963, defines the role of the Legislature and how it is to be constituted. The chief purposes of the Legislature are to enact new laws and amend or repeal existing laws. The Legislature meets in the Capitol building in Lansing.
The Michigan Senate is the upper house of the Michigan Legislature. Along with the Michigan House of Representatives, it composes the state legislature, which has powers, roles and duties defined by Article IV of the Michigan Constitution, adopted in 1963. The primary purpose of the Legislature is to enact new laws and amend or repeal existing laws.
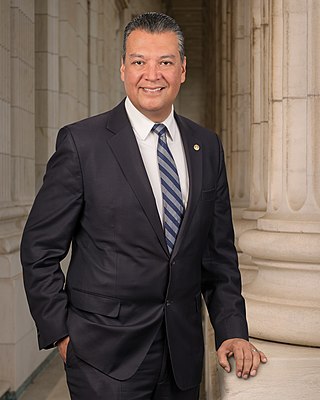
Richard Anthony Alarcon is an American politician who served as a member of the Los Angeles City Council from 1993 to 1998 and again from 2007 to 2013. A Democrat, he previously served in the California State Senate and, for approximately three months, in the California State Assembly.
The California Republican Party (CAGOP) is the affiliate of the United States Republican Party in the U.S. state of California. The party is based in Sacramento and is led by chair Jessica Millan Patterson.
Elections in California are held to fill various local, state and federal seats. In California, regular elections are held every even year ; however, some seats have terms of office that are longer than two years, so not every seat is on the ballot in every election. Special elections may be held to fill vacancies at other points in time. Recall elections can also be held. Additionally, statewide initiatives, legislative referrals and referendums may be on the ballot.
The California state elections, 2006 took place on November 7, 2006. Necessary primary elections were held on June 6. Among the elections that took place were all the seats of the California's State Assembly, 20 seats of the State Senate, seven constitutional officers, and all the seats of the Board of Equalization. Votes on retention of two Supreme Court justices and various Courts of Appeal judges were also held. Five propositions were also up for approval.
California's state elections were held November 2, 2004. Necessary primary elections were held on March 2. Up for election were all the seats of the State Assembly, 20 seats of the State Senate, and sixteen ballot measures.
California's state elections were held November 7, 2000. Necessary primary elections were held on March 7. Up for election were all the seats of the State Assembly, 20 seats of the State Senate, and eight ballot measures.
California's state elections were held November 3, 1992. Necessary primary elections were held on March 3. Up for election were all the seats of the State Assembly, 20 seats of the State Senate, and fifteen ballot measures.
California's state general elections were held November 5, 1996. Necessary primary elections were held on March 26, 1996. Up for election were all eighty (80) seats of the State Assembly, twenty (20) seats of the State Senate, and fifteen (15) statewide ballot measures.
The 2011 United States elections were held on Tuesday, November 8. This was an off-year election, in which the only seats up for election in the United States Congress were special elections. There were also four gubernatorial races, including a special election in West Virginia. There were also state legislative elections in four states and judicial elections in three states; as well as numerous citizen initiatives, mayoral races, and a variety of other local offices on the ballot.
The 2012 United States elections took place on November 6, 2012. Democratic President Barack Obama won reelection to a second term and the Democrats gained seats in both chambers of Congress, retaining control of the Senate even though the Republican Party retained control of the House of Representatives. As of 2024, this is the most recent election cycle in which neither the presidency nor a chamber of Congress changed partisan control, and the last time that the party that won the presidency simultaneously gained seats in both the House of Representatives and the Senate.
The 2014 United States elections were held on Tuesday, November 4, 2014, in the middle of Democratic President Barack Obama's second term. Republicans retained control of the House of Representatives and won control of the Senate.
The California state elections, June 2012 were held on June 5, 2012 and included two propositions, primary elections for each party's nominee for President, and primary elections to determine the top-two candidates for California's Class I seat to the United States Senate, all of California's seats to the House of Representatives, all of the seats of the State Assembly, and all odd-numbered seats of the State Senate, who will compete against each other in a run-off on November 6, 2012.
Nevada's 2012 general elections were held on November 6, 2012. Primary elections were held on June 12, 2012.
The 2018 United States elections were held on Tuesday, November 6, 2018. These midterm elections occurred during Incumbent Republican President Donald Trump's term. Although the Republican Party increased its majority in the Senate, unified Republican control of Congress and the White House was brought to an end when the Democratic Party won control of the House of Representatives in what was widely characterized as a "blue wave" election.
In California state elections, 2014 was the first year in which the top statewide offices were elected under the nonpartisan blanket primary, pursuant to Proposition 14, which passed with 53% voter approval in June 2010. Under this system, which first went into effect during the 2012 election year, all candidates appear on the same ballot, regardless of party. In the primary, voters may vote for any candidate, regardless of their party affiliation. The top two finishers, regardless of party, then advance to face each other in the general election in November.
California state elections in 2018 were held on Tuesday, November 6, 2018, with the primary elections being held on June 5, 2018. Voters elected one member to the United States Senate, 53 members to the United States House of Representatives, all eight state constitutional offices, all four members to the Board of Equalization, 20 members to the California State Senate, and all 80 members to the California State Assembly, among other elected offices.
The Michigan Senate election of 2022 occurred on November 8, 2022, to elect all 38 members to the Michigan Senate. The election coincided with elections for all of Michigan's constitutional offices; governor, attorney general, secretary of state and all 110 seats in the Michigan House of Representatives. Seats in the Michigan Senate were last elected in 2018.
The 2024 California State Senate election will be held on Tuesday, November 5, 2024, with the primary election being held on March 5, 2024. Voters in the 20 odd-numbered districts of the California State Senate will elect their representatives. The elections will coincide with the elections for other offices, including the state Assembly.