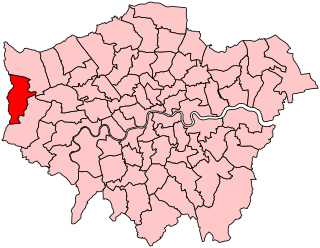
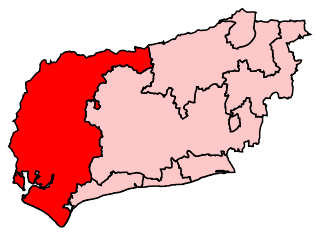
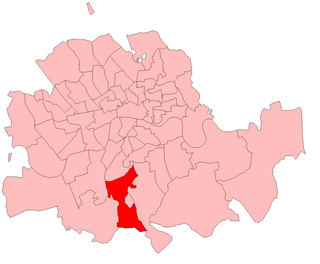
Ashford | |
---|---|
County constituency for the House of Commons | |
County | Kent |
Population | 112,940 (2011 census) [1] |
Electorate | 85,177 (December 2015) [2] |
Major settlements | Tenterden and Ashford |
Current constituency | |
Created | 1885 |
Member of Parliament | Damian Green (Conservative) |
Seats | One |
Created from | West Kent |
Ashford is a constituency [n 1] in Kent created in 1885 and represented in the House of Commons of the UK Parliament since 1997 by Damian Green, a Conservative who served as First Secretary of State between 11 June and 20 December 2017. [n 2]
The constituency includes all of Ashford, which is seeing significant housing expansion [3] and has a manufacturing and services employment base; and surrounding rural areas including Tenterden and Wye. Residents' health and wealth are in line with UK averages. [4] Due to population growth in Ashford itself, the 2023 boundary review proposes that Tenterden is removed from the Ashford constituency.
1885–1918: The Municipal Borough of Tenterden, the Sessional Divisions of Ashford and Cranbrook, the corporate towns of Lydd and New Romney, and part of the Liberty of Romney Marsh.
1918–1950: The Municipal Boroughs of Lydd, New Romney, and Tenterden, the Urban District of Ashford, and the Rural Districts of Cranbrook, East Ashford, Romney Marsh, Tenterden, and West Ashford.
1950–1974: The Municipal Borough of Tenterden, the Urban District of Ashford, and the Rural Districts of Cranbrook, East Ashford, Tenterden, and West Ashford.
1974–1983: The Municipal Borough of Tenterden, the Urban District of Ashford, and the Rural Districts of East Ashford, Tenterden, and West Ashford. Cranbrook Rural District was transferred to the new Royal Tunbridge Wells constituency.
1983–2010: The Borough of Ashford. The constituency boundaries remained unchanged from 1974.
2010–present: The Borough of Ashford wards of Aylesford Green, Beaver, Biddenden, Bockhanger, Boughton Aluph and Eastwell, Bybrook, Charing, Downs North, Downs West, Godinton, Great Chart with Singleton North, Highfield, Isle of Oxney, Kennington, Little Burton Farm, Norman, North Willesborough, Park Farm North, Park Farm South, Rolvenden and Tenterden West, St Michael's, Singleton South, South Willesborough, Stanhope, Stour, Tenterden North, Tenterden South, Victoria, Washford, Weald Central, Weald East, Weald North, Weald South, and Wye.
Ashford constituency has the large town of Ashford which has Ashford International railway station and the smaller town of Tenterden, one of the area's 46 villages, towns or town suburbs which are organised communities into civil parishes. Ashford town centre, its north and its west are the only unparished areas. [5]
Further to the 2023 Periodic Review of Westminster constituencies, enacted by the Parliamentary Constituencies Order 2023, from the 2024 United Kingdom general election, the constituency will be composed of the following (as they existed on 1 December 2020):
The bulk of the geographic area of the constituency, including the town of Tenterden, and comprising approximately 35% of the current electorate [7] will be included in the newly created constituency of Weald of Kent. To partly compensate, the two North Downs wards will be transferred from Folkestone and Hythe.
Created under the Redistribution of Seats Act 1885, Ashford has been won by a Conservative at every election except that of 1929 when it was won by a Liberal, after that party's turn towards the left marked by the People's Budget in 1911, who won with a majority of less than 1% of the vote.
The most marginal victory since 1929 occurred in 1997 when its voters returned a Conservative who won by a 9.7% majority. The 2015 result made the seat the 106th safest of the Conservative Party's 331 seats by percentage of majority. [8]
In June 2016, an estimated 60% of local adults voting in the EU membership referendum chose to leave the European Union instead of to remain. This was matched in two January 2018 votes in Parliament by its MP. [9]
Party | Candidate | Votes | % | ±% | |
---|---|---|---|---|---|
Conservative | Damian Green [11] | ||||
Labour | Sojan Joseph [12] | ||||
Reform UK | Tristram Kennedy Harper [13] | ||||
Consensus | James Ransley [14] | ||||
Green | Mandy Rossi [15] | ||||
Majority | |||||
Turnout | |||||
Registered electors | |||||
Swing | |||||
Party | Candidate | Votes | % | ±% | |
---|---|---|---|---|---|
Conservative | Damian Green | 37,270 | 62.1 | 3.1 | |
Labour | Dara Farrell | 13,241 | 22.0 | 7.8 | |
Liberal Democrats | Adrian Gee-Turner | 6,048 | 10.1 | 4.9 | |
Green | Mandy Rossi | 2,638 | 4.4 | 2.1 | |
Independent | Susannah De Sanvil | 862 | 1.4 | New | |
Majority | 24,029 | 40.1 | 10.9 | ||
Turnout | 60,059 | 67.1 | 1.4 | ||
Registered electors | 89,553 | ||||
Conservative hold | Swing | 5.4 | |||
Party | Candidate | Votes | % | ±% | |
---|---|---|---|---|---|
Conservative | Damian Green | 35,318 | 59.0 | 6.5 | |
Labour | Sally Gathern | 17,840 | 29.8 | 11.4 | |
Liberal Democrats | Adrian Gee-Turner | 3,101 | 5.2 | 0.8 | |
UKIP | Gerald O'Brien | 2,218 | 3.7 | 15.1 | |
Green | Mandy Rossi | 1,402 | 2.3 | 2.0 | |
Majority | 17,478 | 29.2 | 4.5 | ||
Turnout | 59,879 | 68.5 | 1.2 | ||
Registered electors | 87,387 | ||||
Conservative hold | Swing | 2.5 | |||
Party | Candidate | Votes | % | ±% | |
---|---|---|---|---|---|
Conservative | Damian Green | 30,094 | 52.5 | 1.6 | |
UKIP | Gerald O'Brien | 10,798 | 18.8 | 14.3 | |
Labour | Brendan Chilton | 10,580 | 18.4 | 1.7 | |
Liberal Democrats | Debbie Enever | 3,433 | 6.0 | 16.8 | |
Green | Mandy Rossi | 2,467 | 4.3 | 2.5 | |
Majority | 19,296 | 33.7 | 2.4 | ||
Turnout | 57,372 | 67.3 | 0.6 | ||
Registered electors | 85,177 | ||||
Conservative hold | Swing | 8.0 | |||
Party | Candidate | Votes | % | ±% | |
---|---|---|---|---|---|
Conservative | Damian Green | 29,878 | 54.1 | 2.7 | |
Liberal Democrats | Chris Took | 12,581 | 22.8 | 7.2 | |
Labour | Chris Clark | 9,204 | 16.7 | 9.7 | |
UKIP | Jeffrey Elenor [19] | 2,508 | 4.5 | 1.4 | |
Green | Steven Campkin | 1,014 | 1.8 | 1.6 | |
Majority | 17,297 | 31.3 | 5.6 | ||
Turnout | 55,185 | 67.9 | 2.5 | ||
Registered electors | 81,271 | ||||
Conservative hold | Swing | 2.3 | |||
Party | Candidate | Votes | % | ±% | |
---|---|---|---|---|---|
Conservative | Damian Green | 26,651 | 51.6 | 4.2 | |
Labour | Valerie Whitaker | 13,353 | 25.8 | 6.3 | |
Liberal Democrats | Chris Took | 8,308 | 16.1 | 1.0 | |
Green | Richard Boden | 1,753 | 3.4 | 0.6 | |
UKIP | Bernard Stroud | 1,620 | 3.1 | 0.5 | |
Majority | 13,298 | 25.8 | 10.5 | ||
Turnout | 51,685 | 65.0 | 2.5 | ||
Registered electors | 78,816 | ||||
Conservative hold | Swing | 5.2 | |||
Party | Candidate | Votes | % | ±% | |
---|---|---|---|---|---|
Conservative | Damian Green | 22,739 | 47.4 | 6.0 | |
Labour | John Adams | 15,380 | 32.1 | 0.4 | |
Liberal Democrats | Keith Fitchett | 7,236 | 15.1 | 4.6 | |
Green | Richard Boden | 1,353 | 2.8 | 1.6 | |
UKIP | David Waller | 1,229 | 2.6 | New | |
Majority | 7,359 | 15.3 | 5.6 | ||
Turnout | 47,937 | 62.5 | 11.7 | ||
Registered electors | 76,699 | ||||
Conservative hold | Swing | 3.2 | |||
Party | Candidate | Votes | % | ±% | |
---|---|---|---|---|---|
Conservative | Damian Green | 22,899 | 41.4 | 13.2 | |
Labour | John Ennals | 17,554 | 31.7 | 11.7 | |
Liberal Democrats | John Williams | 10,901 | 19.7 | 4.4 | |
Referendum | Christopher Cruden | 3,201 | 5.8 | New | |
Green | Richard Boden | 660 | 1.2 | 0.2 | |
Natural Law | Stephen Tyrell | 89 | 0.2 | New | |
Majority | 5,345 | 9.7 | 20.8 | ||
Turnout | 55,294 | 74.2 | 5.0 | ||
Registered electors | 74,512 | ||||
Conservative hold | Swing | 12.5 | |||
Party | Candidate | Votes | % | ±% | |
---|---|---|---|---|---|
Conservative | Keith Speed | 31,031 | 54.6 | 1.9 | |
Liberal Democrats | Christine Headley | 13,672 | 24.1 | 3.2 | |
Labour | Doreen Cameron | 11,365 | 20.0 | 5.3 | |
Green | Charles Porter | 773 | 1.4 | 0.1 | |
Majority | 17,359 | 30.5 | 1.3 | ||
Turnout | 56,841 | 79.2 | 3.5 | ||
Registered electors | 71,767 | ||||
Conservative hold | Swing | 0.7 | |||
Party | Candidate | Votes | % | ±% | |
---|---|---|---|---|---|
Conservative | Keith Speed | 29,978 | 56.5 | 0.3 | |
SDP | Neil Macmillan | 14,490 | 27.3 | 0.5 | |
Labour | Michael Wiggins | 7,775 | 14.7 | 1.8 | |
Green | Charles Porter | 778 | 1.5 | 0.3 | |
Majority | 15,488 | 29.2 | 0.2 | ||
Turnout | 53,021 | 75.7 | 2.5 | ||
Registered electors | 70,052 | ||||
Conservative hold | Swing | ||||
Party | Candidate | Votes | % | ±% | |
---|---|---|---|---|---|
Conservative | Keith Speed | 27,230 | 56.8 | 1.1 | |
SDP | Jo Hawkes | 13,319 | 27.8 | 11.6 | |
Labour | Paul Lewis | 6,167 | 12.9 | 13.8 | |
Ecology | Charles Porter | 569 | 1.2 | New | |
National Labour | J.W. King | 456 | 0.9 | New | |
BNP | R.E. Lockwood | 195 | 0.4 | New | |
Majority | 13,911 | 29.0 | 0.0 | ||
Turnout | 47,936 | 73.2 | 3.5 | ||
Registered electors | 65,442 | ||||
Conservative hold | Swing | ||||
Party | Candidate | Votes | % | ±% | |
---|---|---|---|---|---|
Conservative | Keith Speed | 26,224 | 55.7 | 11.4 | |
Labour | A.A. Gilbert | 12,586 | 26.7 | 3.8 | |
Liberal | Alison Wainman | 7,631 | 16.2 | 9.0 | |
National Front | K.R. McKilliam | 678 | 1.4 | New | |
Majority | 13,638 | 29.0 | 15.2 | ||
Turnout | 47,119 | 76.7 | 2.2 | ||
Registered electors | 61,460 | ||||
Conservative hold | Swing | ||||
Party | Candidate | Votes | % | ±% | |
---|---|---|---|---|---|
Conservative | Keith Speed | 19,294 | 44.3 | 1.9 | |
Labour | M.B. Jackson | 13,269 | 30.5 | 4.9 | |
Liberal | Clive G. Dennis | 10,983 | 25.2 | 3.0 | |
Majority | 6,025 | 13.8 | 4.2 | ||
Turnout | 43,546 | 74.5 | 7.0 | ||
Registered electors | 58,419 | ||||
Conservative hold | Swing | ||||
Party | Candidate | Votes | % | ±% | |
---|---|---|---|---|---|
Conservative | Bill Deedes | 21,773 | 46.2 | 6.4 | |
Liberal | Clive G. Dennis | 13,314 | 28.2 | 11.9 | |
Labour | M.B. Jackson | 12,077 | 25.6 | 5.4 | |
Majority | 8,459 | 18.0 | 8.0 | ||
Turnout | 47,164 | 81.5 | 9.0 | ||
Registered electors | 57,875 | ||||
Conservative hold | Swing | ||||
Party | Candidate | Votes | % | ±% | |
---|---|---|---|---|---|
Conservative | Bill Deedes | 26,649 | 54.8 | 4.8 | |
Labour | John M. Bowyer | 14,037 | 28.9 | 2.1 | |
Liberal | Frederick Charles Truman | 7,902 | 16.3 | 2.7 | |
Majority | 12,612 | 26.0 | 7.0 | ||
Turnout | 48,588 | 72.5 | 2.9 | ||
Registered electors | 66,975 | ||||
Conservative hold | Swing | 3.5 | |||
Party | Candidate | Votes | % | ±% | |
---|---|---|---|---|---|
Conservative | Bill Deedes | 21,362 | 50.0 | 0.6 | |
Labour | Charles A. Thomas | 13,249 | 31.0 | 2.8 | |
Liberal | J. Gavin W. Peck | 8,121 | 19.0 | 3.4 | |
Majority | 8,113 | 19.0 | 2.2 | ||
Turnout | 42,732 | 75.4 | 2.1 | ||
Registered electors | 56,669 | ||||
Conservative hold | Swing | ||||
Party | Candidate | Votes | % | ±% | |
---|---|---|---|---|---|
Conservative | Bill Deedes | 21,026 | 49.4 | 13.5 | |
Labour | Charles A. Thomas | 11,989 | 28.2 | 8.9 | |
Liberal | J. Gavin W. Peck | 9,531 | 22.4 | New | |
Majority | 9,037 | 21.2 | 4.6 | ||
Turnout | 42,546 | 77.5 | 0.0 | ||
Registered electors | 54,879 | ||||
Conservative hold | Swing | ||||
Party | Candidate | Votes | % | ±% | |
---|---|---|---|---|---|
Conservative | Bill Deedes | 25,383 | 62.9 | 2.4 | |
Labour | Reginald Ward | 14,983 | 37.1 | 2.4 | |
Majority | 10,400 | 25.8 | 4.9 | ||
Turnout | 40,366 | 77.5 | 0.6 | ||
Registered electors | 52,097 | ||||
Conservative hold | Swing | ||||
Party | Candidate | Votes | % | ±% | |
---|---|---|---|---|---|
Conservative | Bill Deedes | 23,992 | 60.5 | 1.4 | |
Labour | Neville Sandelson | 15,685 | 39.5 | 1.4 | |
Majority | 8,307 | 20.9 | 2.6 | ||
Turnout | 39,677 | 78.1 | 3.8 | ||
Registered electors | 50,821 | ||||
Conservative hold | Swing | ||||
Party | Candidate | Votes | % | ±% | |
---|---|---|---|---|---|
Conservative | Bill Deedes | 24,093 | 59.1 | 7.5 | |
Labour | Neville Sandelson | 16,645 | 40.9 | 4.3 | |
Majority | 7,448 | 18.3 | 3.3 | ||
Turnout | 40,738 | 81.9 | 2.2 | ||
Registered electors | 49,715 | ||||
Conservative hold | Swing | ||||
Party | Candidate | Votes | % | ±% | |
---|---|---|---|---|---|
Conservative | Bill Deedes | 21,095 | 51.6 | 0.4 | |
Labour | Neville Sandelson | 14,948 | 36.6 | 1.8 | |
Liberal | H. Shirley | 4,828 | 11.8 | 1,5 | |
Majority | 6,147 | 15.0 | 2.2 | ||
Turnout | 40,871 | 84.1 | 12.8 | ||
Registered electors | 48,607 | ||||
Conservative hold | Swing | ||||
Party | Candidate | Votes | % | ±% | |
---|---|---|---|---|---|
Conservative | Edward Percy Smith | 18,800 | 52.0 | 7.2 | |
Labour | Horace Waterton Lee | 12,575 | 34.8 | 17.2 | |
Liberal | Harold Vezey Strong | 4,804 | 13.3 | 9.9 | |
Majority | 6,225 | 17.2 | 18.8 | ||
Turnout | 36,179 | 71.3 | 2.3 | ||
Registered electors | 50,760 | ||||
Conservative hold | Swing | ||||
Party | Candidate | Votes | % | ±% | |
---|---|---|---|---|---|
Conservative | Edward Percy Smith | 9,648 | 69.7 | 10.5 | |
Common Wealth | Catherine E. Williamson | 4,192 | 30.3 | New | |
Majority | 5,456 | 39.4 | 3.4 | ||
Turnout | 13,840 | 27.7 | 45.9 | ||
Conservative hold | Swing | ||||
Party | Candidate | Votes | % | ±% | |
---|---|---|---|---|---|
Conservative | Patrick Spens | 21,323 | 59.2 | 0.5 | |
Liberal | Borlase Matthews | 8,338 | 23.2 | New | |
Labour | W.J. Beck | 6,333 | 17.6 | N/A | |
Majority | 12,985 | 36.0 | 18.6 | ||
Turnout | 35,994 | 73.6 | 2.3 | ||
Registered electors | 48,914 | ||||
Conservative hold | Swing | ||||
Party | Candidate | Votes | % | ±% | |
---|---|---|---|---|---|
Conservative | Patrick Spens | 16,051 | 47.7 | 11.0 | |
Liberal | Roderick Kedward | 11,423 | 33.9 | 7.4 | |
Labour | W.J. Beck | 6,178 | 18.4 | New | |
Majority | 4,628 | 13.8 | 3.6 | ||
Turnout | 33,652 | 70.9 | 5.0 | ||
Conservative hold | Swing | ||||
Party | Candidate | Votes | % | ±% | |
---|---|---|---|---|---|
Conservative | Michael Knatchbull | 20,891 | 58.7 | 16.1 | |
National Liberal | Roderick Kedward | 14,681 | 41.3 | 4.7 | |
Majority | 6,210 | 17.4 | 14.0 | ||
Turnout | 35,572 | 75.9 | 0.6 | ||
Conservative gain from Liberal | Swing | ||||
Party | Candidate | Votes | % | ±% | |
---|---|---|---|---|---|
Liberal | Roderick Kedward | 15,753 | 46.0 | 24.2 | |
Unionist | Samuel Strang Steel | 14,579 | 42.6 | 17.8 | |
Labour | Mont Follick | 3,885 | 11.4 | 6.4 | |
Majority | 1,174 | 3.4 | 42.0 | ||
Turnout | 34,217 | 75.3 | 4.9 | ||
Registered electors | 45,445 | ||||
Liberal gain from Unionist | Swing | 21.0 | |||
Party | Candidate | Votes | % | ±% | |
---|---|---|---|---|---|
Unionist | Samuel Strang Steel | 15,159 | 60.4 | 1.7 | |
Liberal | Leonard John Humphrey | 5,487 | 21.8 | New | |
Labour | Basil Noble | 4,473 | 17.8 | 20.1 | |
Majority | 9,672 | 38.6 | 14.4 | ||
Turnout | 25,119 | 70.4 | 12.6 | ||
Registered electors | 35,659 | ||||
Unionist hold | Swing | 9.2 | |||
Party | Candidate | Votes | % | ±% | |
---|---|---|---|---|---|
Unionist | Samuel Strang Steel | 12,644 | 62.1 | 7.0 | |
Labour | Basil Noble | 7,709 | 37.9 | 7.0 | |
Majority | 4,935 | 24.2 | 14.0 | ||
Turnout | 20,353 | 57.8 | 6.4 | ||
Registered electors | 35,223 | ||||
Unionist hold | Swing | 7.0 | |||
Party | Candidate | Votes | % | ±% | |
---|---|---|---|---|---|
Unionist | Samuel Strang Steel | 15,638 | 69.1 | 11.9 | |
Labour | Basil Noble | 6,977 | 30.9 | New | |
Majority | 8,661 | 38.2 | 23.8 | ||
Turnout | 22,615 | 64.2 | 25.0 | ||
Registered electors | 35,240 | ||||
Unionist hold | Swing | N/A | |||
Party | Candidate | Votes | % | ±% | |
---|---|---|---|---|---|
C | Unionist | Samuel Strang Steel | 10,258 | 81.0 | N/A |
Independent Democrat | William H. Deedes | 2,408 | 19.0 | New | |
Majority | 7,850 | 62.0 | N/A | ||
Turnout | 12,666 | 39.2 | N/A | ||
Registered electors | 32,349 | ||||
Unionist hold | Swing | N/A | |||
Cindicates candidate endorsed by the coalition government. |
General Election 1914–15: Another General Election was required to take place before the end of 1915. The political parties had been making preparations for an election to take place and by July 1914, the following candidates had been selected;
Party | Candidate | Votes | % | ±% | |
---|---|---|---|---|---|
Conservative | Laurence Hardy | Unopposed | |||
Conservative hold | |||||
Party | Candidate | Votes | % | ±% | |
---|---|---|---|---|---|
Conservative | Laurence Hardy | 7,966 | 64.3 | 12.7 | |
Liberal | Reginald John Farrer | 4,422 | 35.7 | 12.7 | |
Majority | 3,544 | 28.6 | 25.4 | ||
Turnout | 12,418 | 87.2 | 3.5 | ||
Conservative hold | Swing | ||||
Party | Candidate | Votes | % | ±% | |
---|---|---|---|---|---|
Conservative | Laurence Hardy | 5,994 | 51.6 | 20.0 | |
Liberal | Percy Harris | 5,614 | 48.4 | New | |
Majority | 380 | 3.2 | 40.0 | ||
Turnout | 11,608 | 83.7 | 18.9 | ||
Registered electors | 13,864 | ||||
Conservative hold | Swing | N/A | |||
Party | Candidate | Votes | % | ±% | |
---|---|---|---|---|---|
Conservative | Laurence Hardy | 5,898 | 71.6 | N/A | |
Independent Protestant | Benjamin Nicholson | 2,343 | 28.4 | New | |
Majority | 3,555 | 43.2 | N/A | ||
Turnout | 8,241 | 64.8 | N/A | ||
Registered electors | 12,714 | ||||
Conservative hold | Swing | N/A | |||
Party | Candidate | Votes | % | ±% | |
---|---|---|---|---|---|
Conservative | Laurence Hardy | Unopposed | |||
Conservative hold | |||||
Party | Candidate | Votes | % | ±% | |
---|---|---|---|---|---|
Conservative | Laurence Hardy | 5,512 | 56.3 | N/A | |
Liberal | John U Bugler | 4,281 | 43.7 | New | |
Majority | 1,231 | 12.6 | N/A | ||
Turnout | 9,793 | 68.4 | N/A | ||
Registered electors | 14,314 | ||||
Conservative hold | Swing | N/A | |||
Party | Candidate | Votes | % | ±% | |
---|---|---|---|---|---|
Conservative | William Pomfret | Unopposed | |||
Conservative hold | |||||
Party | Candidate | Votes | % | ±% | |
---|---|---|---|---|---|
Conservative | William Pomfret | 6,020 | 55.2 | N/A | |
Liberal | George Crispe Whiteley | 4,895 | 44.8 | N/A | |
Majority | 1,125 | 10.4 | N/A | ||
Turnout | 10,915 | 81.5 | N/A | ||
Registered electors | 13,389 | ||||
Conservative win (new seat) |
The Borough of Ashford is a local government district with borough status in Kent, England. It is named after its largest town, Ashford, where the council is based. The borough also includes the town of Tenterden and an extensive surrounding rural area including numerous villages; with an area of 580 square kilometres (220 sq mi), it is the largest district in Kent. Parts of the borough lie within the designated Areas of Outstanding Natural Beauty of High Weald and the Kent Downs.
Folkestone and Hythe is a constituency in Kent represented in the House of Commons of the UK Parliament since 2010 by Damian Collins, a Conservative.
Uxbridge was a seat returning one Member of Parliament (MP) of the House of Commons of the UK Parliament from 1885 to 2010. Its MPs elected were: Conservative Party candidates for 107 years and Labour Party candidates for 18 years. The closing 40 years of the seat's history saw Conservative victory — in 1997 on a very marginal majority in relative terms.
Chichester is a constituency in West Sussex, represented in the House of Commons of the UK Parliament since 2017 by Gillian Keegan, a Conservative.
Forest of Dean is a constituency in Gloucestershire represented in the House of Commons of the UK Parliament since 2005 by Mark Harper, a Conservative who has served as Secretary of State for Transport since 2022.
Reigate is a constituency in Surrey represented in the House of Commons of the UK Parliament since 1997 by Crispin Blunt, originally of the Conservative Party, but as of October 2023, sitting as an Independent, after having the whip suspended.
Ashford Borough Council is the local authority for the Borough of Ashford in Kent, England. The council is elected every four years. Since the last boundary changes in 2019, 47 councillors have been elected from 39 wards.
The Stour Valley Walk is a recreational walking route that follows the River Stour, through the Low Weald and Kent Downs, from its source at Lenham to its estuary at Pegwell Bay.
Ashford Green Corridor is a green space that runs through the town of Ashford in Kent, England. The Green Corridor is made up of parks, recreation grounds and other green spaces alongside the rivers that flow through Ashford. It is a Local Nature Reserve.
Manchester East was one of six single-member parliamentary constituencies created in 1885 by the division of the existing three-member Parliamentary Borough of Manchester. The others were: Manchester South, Manchester North, Manchester North East, Manchester North West and Manchester South West. They were all abolished in 1918.
Birmingham East was a parliamentary constituency in the city of Birmingham, England. It returned one Member of Parliament (MP) to the House of Commons of the Parliament of the United Kingdom, elected by the first-past-the-post voting system.
Clapham was a borough constituency in South London which returned one Member of Parliament (MP) to the House of Commons of the UK Parliament. It was created in time for the 1885 general election then altered in periodic national boundary reviews, principally in 1918, and abolished before the February 1974 general election. In its early years the seat was officially named Battersea and Clapham Parliamentary Borough: No. 2—The Clapham Division.
Norwood was a parliamentary constituency in south London which returned one Member of Parliament (MP) to the House of Commons of the Parliament of the United Kingdom by the first past the post system.
Hackney Central was a borough constituency in what was then the Metropolitan Borough of Hackney, in London. It returned one Member of Parliament (MP) to the House of Commons of the Parliament of the United Kingdom.
Birmingham Handsworth was a parliamentary constituency centred on the Handsworth district of Birmingham. It returned one Member of Parliament (MP) to the House of Commons of the Parliament of the United Kingdom. It was abolished in 1983.
Denbigh District of Boroughs was a parliamentary constituency centred on the town of Denbigh in Wales. It returned one Member of Parliament (MP) to the British House of Commons.
William Pomfret Pomfret was an English banker and Conservative politician who sat in the House of Commons from 1885 to 1892.
Weald of Kent is a proposed constituency of the House of Commons in the UK Parliament. Further to the completion of the 2023 Periodic Review of Westminster constituencies, it will first be contested at the next general election.
{{cite book}}
: |work=
ignored (help){{cite book}}
: |work=
ignored (help){{cite book}}
: |work=
ignored (help)