Eastbourne | |
---|---|
Borough constituency for the House of Commons | |
County | East Sussex |
Electorate | 79,307 (December 2019) [1] |
Major settlements | Eastbourne |
Current constituency | |
Created | 1885 |
Member of Parliament | Caroline Ansell (Conservative) |
Seats | One |
Created from | East Sussex |
Eastbourne is a constituency for the House of Commons of the UK Parliament. It was created as one of nine in Sussex in 1885, since when it has reduced in geographic size reflecting the growth of its main settlement, Eastbourne. [n 1]
The seat was re-won in 2019 by Caroline Ansell, a Conservative and the constituencies first female MP, who ousted Liberal Democrat Stephen Lloyd; she earlier did so in 2015. [n 2] Since the seat's creation it has been won by candidates from either of these two political parties (and their early forebears, the Liberal Party and the Unionist Party). The seat has had four by-elections, lastly in 1990.
For 94 years of the 20th Century, the seat was represented by Conservative MPs. The seat in the 1930s saw three unopposed candidates: in 1932, March 1935 and November 1935. Eastbourne has been considered relative to others a very marginal seat, as well as a swing seat, since 1997 as its winner's majority has been at most 7.86% of the vote. A 8.9% majority Tory re-gain took place in 1992 and since 2010 the seat has changed hands (between the two parties mentioned) all four possible times.
The constituency contains urban and suburban developments, including the whole of the Eastbourne Borough Council administrative area, as well as the village of Willingdon on its outskirts, which forms a small part of the Wealden District Council administrative area.
Eastbourne itself is on the edge of the London Commuter Belt and is a coastal resort town. The Eastbourne seat has narrowed at every Boundary Commission Periodic Review, as the population of the core town has grown.
Chris Hanretty, the Professor of Politics at Royal Holloway, estimated that Eastbourne voted 57.6% to 42.4% in favour of leaving the European Union during the 2016 referendum. [3]
This seat was created by the Redistribution of Seats Act 1885. This zone had been in the East Sussex constituency, which in turn had been created with two seats by the Reform Act 1832 as a division of the 13th century-founded Sussex parliamentary county which had two seats (returned two knights of the shire).
1885–1918: The Corporate Towns of Pevensey and Seaford, the Sessional Divisions of Hailsham and Uckfield (except the parishes of East Hoathly and Waldron), and part of the Sessional Division of Lewes.
1918–1950: The Borough of Eastbourne, the Rural District of Eastbourne, and in the Rural District of Hailsham the parishes of Arlington, Chalvington, Chiddingly, Hailsham, Hellingly, Laughton, and Ripe.
1950–1955: The Boroughs of Eastbourne and Bexhill, and in the Rural District of Hailsham the parishes of East Dean, Friston, Hooe, Jevington, Ninfield, Pevensey, Polegate, Wartling, Westham, and Willingdon.
1955–1974: The Borough of Eastbourne, and part of the Rural District of Hailsham.
1974–1983: The Borough of Eastbourne, and in the Rural District of Hailsham the parishes of East Dean, Friston, Jevington, Pevensey, Polegate, Westdean, Westham, and Willingdon.
1983–1997: The Borough of Eastbourne, and the District of Wealden wards of Polegate North, Polegate South, and Willingdon.
1997–2010: As prior, substituting East Dean for the Polegate wards.
2010–present: As prior, less East Dean.
Further to the 2023 Periodic Review of Westminster constituencies, enacted by the Parliamentary Constituencies Order 2023, the composition of the constituency from the 2024 general election will be reduced to bring its electorate within the permitted range by transferring the parts within District of Wealden to the Lewes constituency. The boundaries will now be coterminous with those of the Borough of Eastbourne. [4]
From 1910 until 1987 the seat returned Conservative Party candidates at every election. The large rural vote within the seat, until boundary changes in 1983, resulted in strong Conservative support – rural English voters tended to be richer and more right-wing (anti-socialist, pro-Empire before 1960s, pro-Established Church and pro-defence) compared to other voters.
The seat became a marginal, or swing seat, from the 1990 by-election onwards, being closely fought for between the two locally dominant parties. A Liberal Democrat gained the seat at the 2010 general election, in a vote which saw Eastbourne return the sixth-lowest Labour share of the vote of the 631 candidates who stood at the election, with only 4.8%. [5] In 2015, the seat was the 9th most marginal of the Conservative Party's 331 seats, by share of the vote. [6]
Party | Candidate | Votes | % | ±% | |
---|---|---|---|---|---|
Conservative | Caroline Ansell [7] | ||||
Liberal Democrats | Josh Babarinde [8] | ||||
Green | Mike Munson [9] | ||||
Labour | Paul Richards [10] | ||||
Majority | |||||
Turnout |
Party | Candidate | Votes | % | ±% | |
---|---|---|---|---|---|
Conservative | Caroline Ansell | 26,951 | 48.9 | +4.8 | |
Liberal Democrats | Stephen Lloyd | 22,620 | 41.0 | -5.9 | |
Labour | Jake Lambert | 3,848 | 7.0 | -1.1 | |
Brexit Party | Stephen Gander | 1,530 | 2.8 | New | |
Independent | Ken Pollock | 185 | 0.3 | New | |
Majority | 4,331 | 7.9 | N/A | ||
Turnout | 55,134 | 69.5 | -3.4 | ||
Conservative gain from Liberal Democrats | Swing | +5.3 | |||
Party | Candidate | Votes | % | ±% | |
---|---|---|---|---|---|
Liberal Democrats | Stephen Lloyd | 26,924 | 46.9 | +8.7 | |
Conservative | Caroline Ansell | 25,315 | 44.1 | +4.5 | |
Labour | Jake Lambert | 4,671 | 8.1 | +0.3 | |
Green | Alex Hough | 510 | 0.9 | -1.7 | |
Majority | 1,609 | 2.8 | N/A | ||
Turnout | 57,420 | 72.9 | +5.3 | ||
Liberal Democrats gain from Conservative | Swing | +2.1 | |||
Party | Candidate | Votes | % | ±% | |
---|---|---|---|---|---|
Conservative | Caroline Ansell | 20,934 | 39.6 | -1.1 | |
Liberal Democrats | Stephen Lloyd | 20,201 | 38.2 | -9.1 | |
UKIP | Nigel Jones | 6,139 | 11.6 | +9.1 | |
Labour | Jake Lambert | 4,143 | 7.8 | +3.0 | |
Green | Andrew Durling | 1,351 | 2.6 | New | |
Independent | Paul Howard | 139 | 0.3 | New | |
Majority | 733 | 1.4 | New | ||
Turnout | 52,907 | 67.6 | +0.6 | ||
Conservative gain from Liberal Democrats | Swing | +4.0 | |||
Party | Candidate | Votes | % | ±% | |
---|---|---|---|---|---|
Liberal Democrats | Stephen Lloyd | 24,658 | 47.3 | +5.6 | |
Conservative | Nigel Waterson | 21,223 | 40.7 | -2.3 | |
Labour | Dave Brinson | 2,497 | 4.8 | -6.0 | |
Independent | Stephen Shing | 1,327 | 2.5 | New | |
UKIP | Roger Needham | 1,305 | 2.5 | ±0.0 | |
BNP | Colin Poulter | 939 | 1.8 | New | |
Independent | Michael Baldry | 101 | 0.2 | New | |
Independent | Keith Gell | 74 | 0.1 | New | |
Majority | 3,435 | 6.6 | N/A | ||
Turnout | 52,124 | 67.0 | +3.8 | ||
Liberal Democrats gain from Conservative | Swing | +4.0 | |||
Party | Candidate | Votes | % | ±% | |
---|---|---|---|---|---|
Conservative | Nigel Waterson | 21,033 | 43.5 | −0.6 | |
Liberal Democrats | Stephen Lloyd | 19,909 | 41.1 | +1.8 | |
Labour | Andrew Jones | 5,268 | 10.9 | −2.4 | |
UKIP | Andrew Meggs | 1,233 | 2.5 | +0.5 | |
Green | Clive Gross | 949 | 2.0 | New | |
Majority | 1,124 | 2.4 | -2.4 | ||
Turnout | 48,392 | 64.8 | +5.2 | ||
Conservative hold | Swing | -1.2 | |||
Party | Candidate | Votes | % | ±% | |
---|---|---|---|---|---|
Conservative | Nigel Waterson | 19,738 | 44.1 | +2.0 | |
Liberal Democrats | Chris Berry | 17,584 | 39.3 | +1.0 | |
Labour | Gillian Roles | 5,967 | 13.3 | +0.8 | |
UKIP | Barry Jones | 907 | 2.0 | New | |
Liberal | Theresia Williamson | 574 | 1.3 | −0.1 | |
Majority | 2,154 | 4.8 | +1.0 | ||
Turnout | 44,770 | 59.6 | −13.2 | ||
Conservative hold | Swing | +1.5 | |||
Party | Candidate | Votes | % | ±% | |
---|---|---|---|---|---|
Conservative | Nigel Waterson | 22,183 | 42.1 | −10.9 | |
Liberal Democrats | Chris Berry | 20,189 | 38.3 | −2.9 | |
Labour | David Lines | 6,576 | 12.5 | +7.8 | |
Referendum | Trevor Lowe | 2,724 | 5.2 | New | |
Liberal | Theresia Williamson | 741 | 1.4 | New | |
Natural Law | John Dawkins | 254 | 0.5 | New | |
Majority | 1,994 | 3.8 | -5.1 | ||
Turnout | 52,667 | 72.8 | -8.1 | ||
Conservative hold | Swing | -4.0 | |||
This constituency underwent boundary changes between the 1992 and 1997 general elections and thus change in share of vote is based on a notional calculation.
Party | Candidate | Votes | % | ±% | |
---|---|---|---|---|---|
Conservative | Nigel Waterson | 31,792 | 51.6 | −8.3 | |
Liberal Democrats | David Bellotti | 26,311 | 42.7 | +13.0 | |
Labour | Ivan A. Gibbons | 2,834 | 4.6 | −4.2 | |
Green | David Aherne | 391 | 0.6 | −0.9 | |
Liberal | MT Williamson | 296 | 0.5 | −29.3 | |
Majority | 5,481 | 8.9 | −21.3 | ||
Turnout | 61,624 | 80.9 | +5.3 | ||
Conservative hold | Swing | −10.7 | |||
Party | Candidate | Votes | % | ±% | |
---|---|---|---|---|---|
Liberal Democrats | David Bellotti | 23,415 | 50.8 | +21.1 | |
Conservative | Richard Hickmet | 18,865 | 41.0 | -18.9 | |
Labour | Charlotte Atkins | 2,308 | 5.0 | -3.8 | |
Green | David Aherne | 553 | 1.2 | -0.4 | |
Liberal | Theresia Williamson | 526 | 1.1 | New | |
Corrective Party | Lady Whiplash | 216 | 0.5 | New | |
National Front | John McAuley | 154 | 0.3 | New | |
Ironside Party | Eric Page | 35 | 0.1 | New | |
Majority | 4,550 | 9.8 | New | ||
Turnout | 46,072 | 60.7 | -14.9 | ||
Liberal Democrats gain from Conservative | Swing | +20.0 | |||
Party | Candidate | Votes | % | ±% | |
---|---|---|---|---|---|
Conservative | Ian Gow | 33,587 | 59.9 | +0.8 | |
Liberal | Peter Driver | 16,664 | 29.7 | -4.1 | |
Labour | Ash Patel | 4,928 | 8.8 | +1.7 | |
Green | Ruth Addison | 867 | 1.6 | New | |
Majority | 16,923 | 30.2 | +4.9 | ||
Turnout | 56,046 | 75.6 | +2.6 | ||
Conservative hold | Swing | +2.5 | |||
Party | Candidate | Votes | % | ±% | |
---|---|---|---|---|---|
Conservative | Ian Gow | 31,501 | 59.1 | -3.9 | |
Liberal | Peter Driver | 18,015 | 33.8 | +15.0 | |
Labour | Charles Clark | 3,790 | 7.1 | -10.1 | |
Majority | 13,486 | 25.3 | -19.0 | ||
Turnout | 53,306 | 73.0 | -3.7 | ||
Conservative hold | Swing | -9.5 | |||
Party | Candidate | Votes | % | ±% | |
---|---|---|---|---|---|
Conservative | Ian Gow | 37,168 | 63.1 | +8.4 | |
Liberal | David Bellotti | 11,084 | 18.8 | -7.1 | |
Labour | Len Caine | 10,166 | 17.2 | -2.3 | |
National Front | C Mitchell | 533 | 0.9 | New | |
Majority | 26,084 | 44.3 | +15.5 | ||
Turnout | 58,951 | 76.7 | +2.2 | ||
Conservative hold | Swing | +7.8 | |||
Party | Candidate | Votes | % | ±% | |
---|---|---|---|---|---|
Conservative | Ian Gow | 30,442 | 54.7 | +3.6 | |
Liberal | Gurth Hoyer-Millar | 14,417 | 25.9 | -13.2 | |
Labour | Len Caine | 10,830 | 19.5 | +9.9 | |
Majority | 16,025 | 28.8 | |||
Turnout | 55,689 | 74.55 | |||
Conservative hold | Swing | +8.4 | |||
Party | Candidate | Votes | % | ±% | |
---|---|---|---|---|---|
Conservative | Ian Gow | 31,462 | 51.3 | ||
Liberal | Stephen Terrell | 23,987 | 39.1 | ||
Labour | David Dawson | 5,874 | 9.6 | ||
Majority | 7,475 | 12.19 | |||
Turnout | 61,323 | 82.60 | |||
Conservative hold | Swing | ||||
Party | Candidate | Votes | % | ±% | |
---|---|---|---|---|---|
Conservative | Charles Taylor | 30,296 | 48.8 | ||
Liberal | Stephen Terrell | 23,308 | 37.6 | ||
Labour | Cyril George Abley | 8,475 | 13.7 | ||
Majority | 6,988 | 11.2 | |||
Turnout | 62,079 | 73.67 | |||
Conservative hold | Swing | - | |||
Party | Candidate | Votes | % | ±% | |
---|---|---|---|---|---|
Conservative | Charles Taylor | 26,039 | 46.26 | ||
Liberal | Stephen Terrell | 16,746 | 29.75 | ||
Labour | John Harold High | 12,620 | 22.42 | ||
Independent | Vernon Hubert Petty | 883 | 1.57 | New | |
Majority | 9,293 | 16.51 | |||
Turnout | 56,288 | 77.24 | |||
Conservative hold | Swing | ||||
Party | Candidate | Votes | % | ±% | |
---|---|---|---|---|---|
Conservative | Charles Taylor | 26,410 | 49.01 | ||
Liberal | Stephen Terrell | 15,441 | 28.66 | ||
Labour Co-op | Joan E. M. Baker | 12,034 | 22.33 | ||
Majority | 10,969 | 20.35 | |||
Turnout | 53,885 | 76.70 | |||
Conservative hold | Swing | ||||
Party | Candidate | Votes | % | ±% | |
---|---|---|---|---|---|
Conservative | Charles Taylor | 27,874 | 57.28 | ||
Labour | Anthony Albert Dumont | 11,837 | 24.32 | ||
Liberal | Ronald Gardner-Thorpe | 8,955 | 18.40 | New | |
Majority | 16,037 | 32.96 | |||
Turnout | 48,666 | 77.28 | |||
Conservative hold | Swing | ||||
Party | Candidate | Votes | % | ±% | |
---|---|---|---|---|---|
Conservative | Charles Taylor | 29,779 | 65.68 | ||
Labour | John A. Lewis | 15,561 | 34.32 | ||
Majority | 14,218 | 31.36 | |||
Turnout | 45,340 | 75.81 | |||
Conservative hold | Swing | ||||
Party | Candidate | Votes | % | ±% | |
---|---|---|---|---|---|
Conservative | Charles Taylor | 39,278 | 67.15 | ||
Labour | Christopher Attlee | 19,217 | 32.85 | ||
Majority | 20,061 | 34.30 | |||
Turnout | 58,495 | 81.93 | |||
Conservative hold | Swing | ||||
Party | Candidate | Votes | % | ±% | |
---|---|---|---|---|---|
Conservative | Charles Taylor | 35,425 | 59.54 | ||
Labour | Reginald Groves | 18,304 | 30.77 | ||
Liberal | Cecil Herbert Louis Douglas-Bate | 5,766 | 9.69 | ||
Majority | 17,121 | 28.77 | |||
Turnout | 59,495 | 85.08 | |||
Conservative hold | Swing | ||||
Party | Candidate | Votes | % | ±% | |
---|---|---|---|---|---|
Conservative | Charles Taylor | 18,173 | 53.24 | N/A | |
Labour | Duncan Newman Smith | 12,637 | 37.02 | New | |
Liberal | John Stafford Gowland | 2,797 | 8.19 | New | |
Independent National | Reg Hipwell | 524 | 1.54 | New | |
Majority | 5,536 | 16.22 | N/A | ||
Turnout | 34,131 | 77.35 | N/A | ||
Conservative hold | |||||
Party | Candidate | Votes | % | ±% | |
---|---|---|---|---|---|
Conservative | Charles Taylor | Unopposed | |||
Conservative hold | |||||
Party | Candidate | Votes | % | ±% | |
---|---|---|---|---|---|
Conservative | Charles Taylor | Unopposed | |||
Conservative hold | |||||
Party | Candidate | Votes | % | ±% | |
---|---|---|---|---|---|
Conservative | John Slater | Unopposed | |||
Conservative hold | |||||
Party | Candidate | Votes | % | ±% | |
---|---|---|---|---|---|
Conservative | Edward Marjoribanks | 31,240 | 85.31 | ||
Labour | A.J. Marshall | 5,379 | 14.69 | ||
Majority | 25,861 | 70.62 | |||
Turnout | 36,619 | 71.86 | |||
Conservative hold | Swing | ||||
Party | Candidate | Votes | % | ±% | |
---|---|---|---|---|---|
Unionist | Edward Marjoribanks | 18,157 | 49.9 | -8.5 | |
Labour | Richard S Chatfield | 8,204 | 22.5 | +5.6 | |
Liberal | Clive Stuart Saxon Burt | 7,812 | 21.4 | -3.3 | |
Ind. Unionist | P E Hurst | 2,277 | 6.2 | New | |
Majority | 9,953 | 27.4 | -6.3 | ||
Turnout | 36,450 | 74.5 | +13.7 | ||
Unionist hold | Swing | -7.0 | |||
Party | Candidate | Votes | % | ±% | |
---|---|---|---|---|---|
Unionist | Reginald Hall | 12,741 | 58.4 | -9.5 | |
Liberal | Harcourt Johnstone | 5,386 | 24.7 | +8.6 | |
Labour | Thomas Williams | 3,696 | 16.9 | +0.9 | |
Majority | 7,355 | 33.7 | -18.1 | ||
Turnout | 21,823 | 60.7 | -14.9 | ||
Unionist hold | Swing | -9.0 | |||
Party | Candidate | Votes | % | ±% | |
---|---|---|---|---|---|
Unionist | George Lloyd | 17,533 | 67.9 | +14.1 | |
Liberal | Joseph James Davies | 4,168 | 16.1 | -30.1 | |
Labour | D J Davis | 4,138 | 16.0 | New | |
Majority | 13,365 | 51.8 | +44.2 | ||
Turnout | 25,839 | 77.6 | +0.6 | ||
Unionist hold | Swing | +22.1 | |||
Party | Candidate | Votes | % | ±% | |
---|---|---|---|---|---|
Unionist | Rupert Gwynne | 13,276 | 53.8 | -6.7 | |
Liberal | Thomas Wiles | 11,396 | 46.2 | +6.7 | |
Majority | 1,880 | 7.6 | -13.4 | ||
Turnout | 24,672 | 77.0 | -0.2 | ||
Unionist hold | Swing | -6.7 | |||
Party | Candidate | Votes | % | ±% | |
---|---|---|---|---|---|
Unionist | Rupert Gwynne | 14,601 | 60.5 | -3.1 | |
Liberal | Edward Duke | 9,550 | 39.5 | +29.1 | |
Majority | 5,051 | 21.0 | -16.6 | ||
Turnout | 24,151 | 77.2 | |||
Unionist hold | Swing | -16.1 | |||
Party | Candidate | Votes | % | ±% | |
---|---|---|---|---|---|
C | Unionist | Rupert Gwynne | 11,357 | 63.6 | +5.3 |
Labour | Thomas Burleigh Hasdell | 4,641 | 26.0 | New | |
Liberal | Alfred John Callaghan | 1,852 | 10.4 | −31.3 | |
Majority | 6,716 | 37.6 | +21.0 | ||
Turnout | 17,850 | 59.8 | −23.4 | ||
Unionist hold | Swing | +18.3 | |||
Cindicates candidate endorsed by the coalition government. |
General Election 1914–15:
Another General Election was required to take place before the end of 1915. The political parties had been making preparations for an election to take place and by July 1914, the following candidates had been selected;
Party | Candidate | Votes | % | ±% | |
---|---|---|---|---|---|
Conservative | Rupert Gwynne | 6,873 | 58.3 | −0.7 | |
Liberal | Hector Morison | 4,920 | 41.7 | +0.7 | |
Majority | 1,953 | 16.6 | −1.4 | ||
Turnout | 11,793 | 83.2 | −7.1 | ||
Registered electors | 14,172 | ||||
Conservative hold | Swing | −0.7 | |||
Party | Candidate | Votes | % | ±% | |
---|---|---|---|---|---|
Conservative | Rupert Gwynne | 7,553 | 59.0 | +11.8 | |
Liberal | Hector Morison | 5,249 | 41.0 | −11.8 | |
Majority | 2,304 | 18.0 | N/A | ||
Turnout | 12,802 | 90.3 | +3.3 | ||
Registered electors | 14,172 | ||||
Conservative gain from Liberal | Swing | +11.8 | |||
Party | Candidate | Votes | % | ±% | |
---|---|---|---|---|---|
Liberal | Hubert Beaumont | 5,933 | 52.8 | +6.6 | |
Conservative | Lindsay Hogg | 5,303 | 47.2 | -6.6 | |
Majority | 630 | 5.6 | N/A | ||
Turnout | 11,236 | 87.0 | +5.2 | ||
Registered electors | 12,913 | ||||
Liberal gain from Conservative | Swing | +6.6 | |||
Party | Candidate | Votes | % | ±% | |
---|---|---|---|---|---|
Conservative | Lindsay Hogg | 4,948 | 53.8 | +3.4 | |
Liberal | Thomas Seymour Brand | 4,254 | 46.2 | −3.4 | |
Majority | 694 | 7.6 | +6.8 | ||
Turnout | 9,202 | 81.8 | +4.0 | ||
Registered electors | 11,248 | ||||
Conservative hold | Swing | +3.4 | |||
Party | Candidate | Votes | % | ±% | |
---|---|---|---|---|---|
Conservative | Edward Field | 4,139 | 50.4 | −2.0 | |
Liberal | Thomas Seymour Brand | 4,079 | 49.6 | +2.0 | |
Majority | 60 | 0.8 | −4.0 | ||
Turnout | 8,218 | 77.8 | +0.9 | ||
Registered electors | 10,563 | ||||
Conservative hold | Swing | −2.0 | |||
Party | Candidate | Votes | % | ±% | |
---|---|---|---|---|---|
Conservative | Edward Field | 4,037 | 52.4 | −7.7 | |
Liberal | Thomas Seymour Brand | 3,674 | 47.6 | +7.7 | |
Majority | 363 | 4.8 | −15.4 | ||
Turnout | 7,711 | 76.9 | +3.3 | ||
Registered electors | 10,029 | ||||
Conservative hold | Swing | −7.7 | |||
Party | Candidate | Votes | % | ±% | |
---|---|---|---|---|---|
Conservative | Edward Field | 3,760 | 60.1 | +9.6 | |
Liberal | James Clifton Brown [31] | 2,501 | 39.9 | −9.6 | |
Majority | 1,259 | 20.2 | +19.2 | ||
Turnout | 6,261 | 73.6 | −9.4 | ||
Registered electors | 8,504 | ||||
Conservative hold | Swing | +9.6 | |||
Party | Candidate | Votes | % | ±% | |
---|---|---|---|---|---|
Conservative | Edward Field | 3,561 | 50.5 | ||
Liberal | George Ambrose Wallis | 3,497 | 49.5 | ||
Majority | 64 | 1.0 | |||
Turnout | 7,058 | 83.0 | |||
Registered electors | 8,504 | ||||
Conservative win (new seat) |
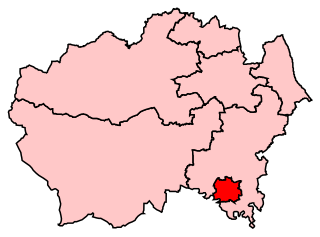
Polegate is a town and civil parish in the Wealden District of East Sussex, England, United Kingdom. It is located five miles (8 km) north of the seaside resort of Eastbourne and is part of the greater area of that town. Although once a railway settlement, its rail links were closed as part of the Beeching cuts. The 2011 census put the civil parish of Polegate at a population of 8,586, with 41.2% aged 65 and over.
Orpington is a constituency created in 1945 and represented in the House of Commons of the UK Parliament since 2019 by Gareth Bacon, a Conservative. It is the largest constituency in Greater London by area, covering the east and south of the London Borough of Bromley.
Newbury is a constituency of the Parliament of the United Kingdom, located in the English county of Berkshire. It was created by the Redistribution of Seats Act 1885 and has been in continual existence since then. Between the 2019 general election and the dissolution of parliament in preparation for the 2024 general election, it was represented by Laura Farris, a Conservative.
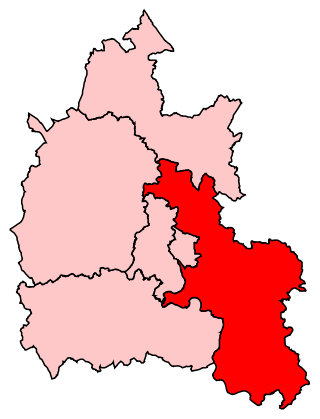
Henley is a constituency in Oxfordshire represented in the House of Commons of the UK Parliament since 2008 by John Howell, a Member of Parliament from the Conservative Party.
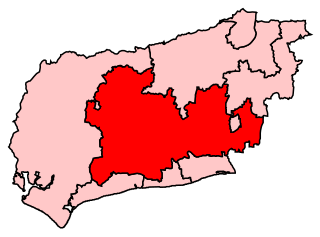
Arundel and South Downs is a constituency in West Sussex created in 1997 and represented in the House of Commons of the UK Parliament since 2019 by Andrew Griffith of the Conservative Party.
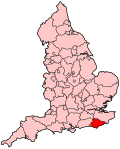
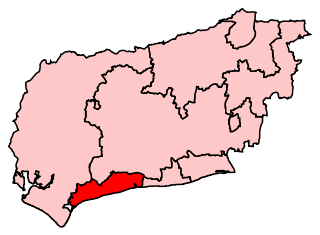
Lewes is a constituency in East Sussex represented in the House of Commons of the UK Parliament since 2015 by Maria Caulfield, a Conservative.
Chorley is a constituency in Lancashire represented in the House of Commons of the UK Parliament since 1997 by Lindsay Hoyle. Hoyle was originally elected for the Labour Party, but in 2019 became the Speaker, making him unaffiliated.
Fylde is a constituency in Lancashire which was represented in the House of Commons of the UK Parliament from 2010 by Mark Menzies, formerly of the Conservative Party, but later an Independent after the whip was withdrawn in April 2024, with allegations he misused campaign funds.
Southport is a constituency in Merseyside which has been represented in the House of Commons of the UK Parliament since 2017 by Damien Moore of the Conservative Party.
Wealden is a constituency represented in the House of Commons of the UK Parliament since 2015 by Nus Ghani, a Conservative. Ghani is the first Muslim woman to be elected as a Conservative member of Parliament.
Brighton Kemptown is a constituency represented in the House of Commons of the UK Parliament since 2017 by Lloyd Russell-Moyle, an Independent, after being suspended by the Labour Party in May 2024. The seat is often referred to as Brighton Kemptown and Peacehaven by local political parties, and will formally adopt that name following the 2024 general election.
Darlington is the parliamentary constituency for the eponymous market town in County Durham in the North East of England. It is currently represented in the House of Commons of the UK Parliament by Peter Gibson of the Conservative Party, who was first elected in 2019.
Tunbridge Wells is a constituency in Kent represented in the House of Commons of the UK Parliament since 2005 by Greg Clark, a Conservative who served as Secretary of State for Business, Energy and Industrial Strategy from 2016 to 2019 and then as Secretary of State for Levelling Up, Housing and Communities in 2022 as part of a caretaker government led by former Prime Minister Boris Johnson.
North Cornwall is a constituency represented in the House of Commons of the UK Parliament by Scott Mann, a Conservative since the 2015 general election. Like all British constituencies, the seat elects one Member of Parliament (MP) by the first past the post system of election at least every five years. The seat was created in 1918. Since 1950, the constituency has been held by MPs from either the Conservative Party or the Liberal Democrats.
Bexhill and Battle is a constituency in East Sussex represented in the House of Commons of the UK Parliament since 2015 by Huw Merriman of the Conservative Party.
Bognor Regis and Littlehampton is a constituency in West Sussex represented in the House of Commons of the UK Parliament since 1997 by Nick Gibb, a Conservative.
Crawley is a constituency in West Sussex represented in the House of Commons of the UK Parliament since 2010 by Henry Smith of the Conservative Party.
Hastings and Rye is a constituency in East Sussex represented in the House of Commons of the UK Parliament since 2019 by Sally-Ann Hart of the Conservative Party. From 2010 until 2019, it was represented by Amber Rudd, who served as Secretary of State for Energy and Climate Change, Minister for Women and Equalities, Secretary of State for the Home Department and Secretary of State for Work and Pensions under the governments of David Cameron, Theresa May and Boris Johnson.
The 2011 Wealden District Council election took place on 5 May 2011 to elect members of Wealden District Council in East Sussex, England. The whole council was up for election and the Conservative Party stayed in overall control of the council.
{{cite web}}
: Missing or empty |title=
(help){{cite book}}
: |work=
ignored (help)