Southampton, Itchen | |
---|---|
Borough constituency for the House of Commons | |
County | Hampshire |
Electorate | 74,513 (December 2010) [1] |
Major settlements | Southampton |
Current constituency | |
Created | 1950 |
Member of Parliament | Royston Smith (Conservative) |
Seats | One |
Created from | Southampton |
Southampton, Itchen is a constituency [n 1] represented in the House of Commons of the UK Parliament since 2015 by Royston Smith, a Conservative member of parliament. [n 2] Discounting the Speaker (of the House of Commons) returned in the early 1970s in two elections, local voters have elected the MP from only two parties alternately for various periods, with one party reaffiliation (defection) between elections when the Labour Party split in the 1980s.
Since 1987, campaigns in the seat have resulted in a minimum of 26.8% of votes at each election consistently for the same two parties' choice for candidate, and the next highest-placed share having fluctuated between 3% and 23% of the vote. In those recent elections, save for 2015 when UKIP surged nationally, the third-placed candidate has been a Liberal Democrat, whose candidate lost their deposit in the result perhaps uniquely for an English university city seat in 2017, but which takes in far fewer of the university areas than Southampton Test. The seat attracted nine candidates in 1997; three in 1992. Oldest elections in the seat were sometimes a two-candidate contest, as in comparator mid-twentieth century English elections.
The constituency was created in 1950, when the two-member Southampton constituency was abolished.
The constituency is named after the River Itchen, which flows through it and is the lesser of the two major rivers that reach the tidal estuary of Southampton Water at the city. Although until the 1970s it was a safe Labour seat, it elected a Conservative MP, Christopher Chope in 1983 and 1987 after the sitting MP Bob Mitchell left Labour in 1981 for the SDP. The combination of Mitchell as a strong SDP-Liberal Alliance candidate in both 1983 and 1987, together with Conservative landslides, made Southampton Itchen highly competitive.
Labour candidate John Denham, defeated Chope by 551 votes in 1992 and held the seat with low-to-average majorities until 2010 when he won by 192 votes. From 2010 to 2017, the three general election results in the seat presented themselves as two-party ultra-marginal (finely-balanced) contests.
Royston Smith gained the seat as a Conservative in 2015. He had led his party's group on the city council and first contested the seat in 2010. He retained the seat in the 2019 general election with a majority of over 4000 votes.
1950–1955: The County Borough of Southampton wards of Bevois, Bitterne and Peartree, Bitterne and Sholing, Newtown, Northam, Portswood, St Denys, St Mary's, Trinity, and Woolston. [2]
1955–1983: The County Borough of Southampton wards of Bitterne, Harefield, Peartree and Bitterne Manor, St Denys and Bitterne Park, St Luke's, St Mary's, Sholing, Swaythling, and Woolston. [3]
1983–1997: The City of Southampton wards of Bargate, Bitterne, Bitterne Park, Harefield, Peartree, St Luke's, and Sholing.
1997–present: The City of Southampton wards of Bargate, Bitterne, Bitterne Park, Harefield, Peartree, Sholing, and Woolston.
The seat covers the eastern part of the City of Southampton, in southern England, specifically the city centre, the eastern port areas (the Port of Southampton is one of the principal ports of the UK), the exclusive Ocean Village quarter, the inner city council estates and the economically deprived Thornhill estate on its eastern boundary. It is seen as the more working class of the two constituencies in the city.[ citation needed ] The other is Southampton Test – named after the River Test.
The constituency is bounded to the west by Southampton Test (Labour), to the north and east by Eastleigh (Conservative) and in the far north by Romsey and Southampton North (Conservative).
Further to the 2023 Periodic Review of Westminster constituencies, enacted by the Parliamentary Constituencies Order 2023, the composition of the constituency from the 2024 United Kingdom general election will be unchanged. [4]
Following a review of local authority ward boundaries, which became effective in May 2023, [5] [6] the constituency now comprises the following:
Workless claimants, registered jobseekers, were in November 2012 close to but slightly below than the national average of 3.8%, at 3.5% of the population based on a statistical compilation by The Guardian , above the average for the South East seats of 2.5% but below, for example, five seats in East Kent. [8]
Election | Member [9] | Party | |
---|---|---|---|
1950 | Ralph Morley | Labour | |
1955 | Horace King | Labour | |
1965 | Speaker | ||
1971 by-election | Bob Mitchell | Labour | |
1981 | SDP | ||
1983 | Christopher Chope | Conservative | |
1992 | John Denham | Labour | |
2015 | Royston Smith | Conservative |
Party | Candidate | Votes | % | ±% | |
---|---|---|---|---|---|
Labour | Darren Paffey [10] | ||||
Conservative | Sidney Yankson [11] | ||||
Majority | |||||
Turnout | |||||
Registered electors | |||||
Swing | |||||
Party | Candidate | Votes | % | ±% | |
---|---|---|---|---|---|
Conservative | Royston Smith | 23,952 | 50.5 | +4.0 | |
Labour | Simon Letts | 19,454 | 41.0 | -5.5 | |
Liberal Democrats | Liz Jarvis | 2,503 | 5.3 | +2.3 | |
Green | Osman Sen-Chadun | 1,040 | 2.2 | +0.6 | |
UKIP | Kim Rose | 472 | 1.0 | -1.4 | |
Majority | 4,498 | 9.5 | +9.4 | ||
Turnout | 47,421 | 65.6 | +0.4 | ||
Conservative hold | Swing | +4.8 | |||
Party | Candidate | Votes | % | ±% | |
---|---|---|---|---|---|
Conservative | Royston Smith | 21,773 | 46.54 | +4.8 | |
Labour | Simon Letts | 21,742 | 46.47 | +10.0 | |
Liberal Democrats | Eleanor Bell | 1,421 | 3.0 | -0.6 | |
UKIP | Kim Rose | 1,122 | 2.4 | -11.0 | |
Green | Rosie Pearce | 725 | 1.6 | -2.6 | |
Majority | 31 | 0.07 | -5.1 | ||
Turnout | 46,783 | 65.2 | +3.4 | ||
Conservative hold | Swing | -2.6 | |||
Party | Candidate | Votes | % | ±% | |
---|---|---|---|---|---|
Conservative | Royston Smith | 18,656 | 41.7 | +5.4 | |
Labour | Rowenna Davis | 16,340 | 36.5 | -0.3 | |
UKIP | Kim Rose | 6,010 | 13.4 | +9.1 | |
Green | John Spottiswoode | 1,876 | 4.2 | +2.8 | |
Liberal Democrats | Eleanor Bell | 1,595 | 3.6 | -17.2 | |
TUSC | Sue Atkins | 233 | 0.5 | +0.1 | |
Majority | 2,316 | 5.2 | N/A | ||
Turnout | 44,710 | 61.8 | +2.2 | ||
Conservative gain from Labour | Swing | +2.8 | |||
Party | Candidate | Votes | % | ±% | |
---|---|---|---|---|---|
Labour | John Denham | 16,326 | 36.8 | −11.5 | |
Conservative | Royston Smith | 16,134 | 36.3 | +8.5 | |
Liberal Democrats | David Goodall | 9,256 | 20.8 | -0.3 | |
UKIP | Alan Kebbell | 1,928 | 4.3 | +0.5 | |
Green | John Spottiswoode | 600 | 1.4 | New | |
TUSC | Tim Cutter | 168 | 0.4 | New | |
Majority | 192 | 0.5 | -21.0 | ||
Turnout | 44,412 | 59.6 | +4.1 | ||
Labour hold | Swing | −10.3 | |||
Party | Candidate | Votes | % | ±% | |
---|---|---|---|---|---|
Labour | John Denham | 20,871 | 48.3 | −6.2 | |
Conservative | Flick Drummond | 11,569 | 26.8 | −0.6 | |
Liberal Democrats | David Goodall | 9,162 | 21.2 | +6.2 | |
UKIP | Kim Rose | 1,623 | 3.8 | +1.8 | |
Majority | 9,302 | 21.5 | -5.6 | ||
Turnout | 43,225 | 55.5 | +1.5 | ||
Labour hold | Swing | −2.8 | |||
Party | Candidate | Votes | % | ±% | |
---|---|---|---|---|---|
Labour | John Denham | 22,553 | 54.5 | −0.3 | |
Conservative | Caroline Nokes | 11,330 | 27.4 | −1.0 | |
Liberal Democrats | Mark Cooper | 6,195 | 15.0 | +3.3 | |
UKIP | Kim Rose | 829 | 2.0 | +1.7 | |
Socialist Alliance | Gavin Marsh | 241 | 0.6 | New | |
Socialist Labour | Michael Holmes | 225 | 0.5 | ||
Majority | 11,223 | 27.1 | +0.7 | ||
Turnout | 41,373 | 54.0 | -16.0 | ||
Labour hold | Swing | +0.4 | |||
Electorate: 76,603
Party | Candidate | Votes | % | ±% | |
---|---|---|---|---|---|
Labour | John Denham | 29,498 | 54.8 | +10.8 | |
Conservative | Peter Fleet | 15,269 | 28.4 | −13.7 | |
Liberal Democrats | David Harrison | 6,289 | 11.7 | −2.2 | |
Referendum | John Clegg | 1,660 | 3.1 | New | |
Socialist Labour | Kim Rose | 628 | 1.2 | New | |
UKIP | Clive Hoar | 172 | 0.3 | New | |
Socialist Alternative | Gavin Marsh | 113 | 0.2 | New | |
Natural Law | Rosemary Barry | 110 | 0.2 | New | |
ProLife Alliance | Ferdi McDermott | 99 | 0.2 | New | |
Majority | 14,220 | 26.4 | +21.4 | ||
Turnout | 53,838 | 70.0 | -5.1 | ||
Labour hold | Swing | +12.3 | |||
Electorate: 76,869
Party | Candidate | Votes | % | ±% | |
---|---|---|---|---|---|
Labour | John Denham | 24,402 | 44.0 | +11.9 | |
Conservative | Christopher Chope | 23,851 | 43.0 | −1.3 | |
Liberal Democrats | James R.T. Hodgson | 7,221 | 13.0 | −10.6 | |
Majority | 551 | 1.0 | N/A | ||
Turnout | 55,474 | 76.9 | +1.0 | ||
Labour gain from Conservative | Swing | +6.6 | |||
Party | Candidate | Votes | % | ±% | |
---|---|---|---|---|---|
Conservative | Christopher Chope | 24,419 | 44.3 | +2.8 | |
Labour | John Denham | 17,703 | 32.1 | +5.0 | |
SDP | Bob Mitchell | 13,006 | 23.6 | -7.9 | |
Majority | 6,716 | 12.2 | +2.2 | ||
Turnout | 55,128 | 75.9 | +2.6 | ||
Conservative hold | Swing | ||||
Party | Candidate | Votes | % | ±% | |
---|---|---|---|---|---|
Conservative | Christopher Chope | 21,937 | 41.5 | ||
SDP | Bob Mitchell | 16,647 | 31.5 | ||
Labour | John Denham | 14,324 | 27.1 | ||
Majority | 5,290 | 10.0 | N/A | ||
Turnout | 52,908 | 73.3 | |||
Conservative gain from SDP | Swing | ||||
Party | Candidate | Votes | % | ±% | |
---|---|---|---|---|---|
Labour | Bob Mitchell | 28,036 | 46.3 | -2.6 | |
Conservative | Andrew Hunter | 26,434 | 43.6 | +8.2 | |
Liberal | John Pindar | 6,132 | 10.1 | -5.6 | |
Majority | 1,602 | 2.7 | -10.8 | ||
Turnout | 60,602 | 74.7 | +4.4 | ||
Labour hold | Swing | ||||
Party | Candidate | Votes | % | ±% | |
---|---|---|---|---|---|
Labour | Bob Mitchell | 28,168 | 48.9 | +4.9 | |
Conservative | P. T. James | 20,373 | 35.4 | +0.4 | |
Liberal | Joseph Cherryson | 9,071 | 15.7 | -5.3 | |
Majority | 7,795 | 13.5 | +4.5 | ||
Turnout | 57,612 | 70.3 | -6.9 | ||
Labour hold | Swing | ||||
Party | Candidate | Votes | % | ±% | |
---|---|---|---|---|---|
Labour | Bob Mitchell | 27,557 | 44.0 | N/A | |
Conservative | P. T. James | 21,967 | 35.0 | N/A | |
Liberal | Joseph Cherryson | 13,173 | 21.0 | N/A | |
Majority | 5,590 | 9.0 | N/A | ||
Turnout | 62,697 | 77.2 | +23.1 | ||
Labour gain from Speaker | Swing | ||||
Party | Candidate | Votes | % | ±% | |
---|---|---|---|---|---|
Labour | Bob Mitchell | 22,575 | 55.36 | New | |
Conservative | James Spicer | 12,900 | 31.63 | New | |
National Democratic | Edwin Bray | 3,090 | 7.58 | ||
Liberal | Joseph Cherryson | 2,214 | 5.43 | New | |
Majority | 9,675 | 23.73 | N/A | ||
Turnout | 40,779 | ||||
Labour gain from Speaker | Swing | ||||
Party | Candidate | Votes | % | ±% | |
---|---|---|---|---|---|
Speaker | Horace King | 29,417 | 67.2 | -18.2 | |
National Democratic | Edwin Bray | 9,581 | 21.9 | New | |
Independent | Brian Henry Phillips | 4,794 | 11.0 | New | |
Majority | 19,836 | 45.3 | -25.5 | ||
Turnout | 43,792 | 54.1 | +5.1 | ||
Speaker hold | Swing | ||||
Party | Candidate | Votes | % | ±% | |
---|---|---|---|---|---|
Speaker | Horace King | 30,463 | 85.4 | +32.7 | |
Democratic Non-party Nationalist | Kenneth Douglas Hunt | 5,217 | 14.6 | New | |
Majority | 25,246 | 70.8 | +52.6 | ||
Turnout | 35,680 | 49.0 | -27.1 | ||
Speaker gain from Labour | Swing | ||||
Party | Candidate | Votes | % | ±% | |
---|---|---|---|---|---|
Labour | Horace King | 28,949 | 52.7 | -0.7 | |
Conservative | Godfrey Olson | 18,974 | 34.5 | -12.1 | |
Liberal | Joseph Cherryson | 7,007 | 12.8 | New | |
Majority | 9,975 | 18.2 | +9.4 | ||
Turnout | 54,930 | 76.1 | -1.9 | ||
Labour hold | Swing | ||||
Party | Candidate | Votes | % | ±% | |
---|---|---|---|---|---|
Labour | Horace King | 29,123 | 53.42 | ||
Conservative | Evelyn King | 25,390 | 46.58 | ||
Majority | 3,733 | 6.84 | |||
Turnout | 54,513 | 78.00 | |||
Labour hold | Swing | ||||
Party | Candidate | Votes | % | ±% | |
---|---|---|---|---|---|
Labour | Horace King | 29,149 | 55.49 | ||
Conservative | Leslie Loader | 23,378 | 44.51 | ||
Majority | 5,771 | 10.98 | |||
Turnout | 52,527 | 78.28 | |||
Labour hold | Swing | ||||
Party | Candidate | Votes | % | ±% | |
---|---|---|---|---|---|
Labour | Ralph Morley | 30,330 | 54.12 | ||
National Liberal | Reginald Stranger | 25,708 | 45.88 | ||
Majority | 4,622 | 8.24 | |||
Turnout | 56,038 | 83.59 | |||
Labour hold | Swing | ||||
Party | Candidate | Votes | % | ±% | |
---|---|---|---|---|---|
Labour | Ralph Morley | 29,749 | 53.44 | ||
National Liberal | Robert Hobart | 24,536 | 44.08 | ||
Ind. Conservative | William Craven-Ellis | 1,380 | 2.48 | ||
Majority | 5,213 | 9.36 | |||
Turnout | 55,665 | 84.0 | |||
Labour win (new seat) |
Southampton Test is a constituency represented in the House of Commons of the UK Parliament since 1997 by Alan Whitehead, a member of the Labour Party.
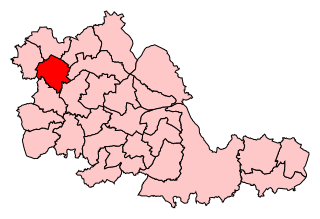
Birmingham Selly Oak is a constituency in the West Midlands, represented in the House of Commons of the UK Parliament since 2010 by Steve McCabe of the Labour Party.
Bolton North East is a constituency represented in the House of Commons of the UK Parliament since 2019 by Mark Logan, a Conservative.
St. Helens North is a constituency created in 1983 represented in the House of Commons of the UK Parliament since 2015 by the Labour Party's Conor McGinn, Shadow Minister without Portfolio from 4 December 2021. Between 1997 and 2015 the MP was Labour's David Watts.
Brighton Kemptown is a constituency represented in the House of Commons of the UK Parliament since 2017 by Lloyd Russell-Moyle, a Labour Co-op MP. The seat is often referred to as Brighton Kemptown and Peacehaven by local political parties, and will formally adopt that name following the next general election, thanks to the 2023 Periodic Review of Westminster constituencies.
New Forest East is a constituency in Hampshire represented in the House of Commons of the UK Parliament since its creation in 1997 by Julian Lewis of the Conservative Party.
Derby North is a constituency formed of part of the city of Derby, represented in the House of Commons of the UK Parliament since 2019 by Amanda Solloway, a Conservative.
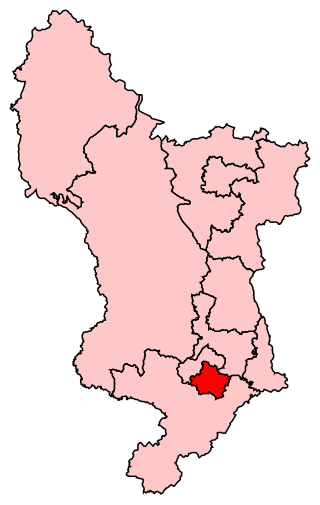
Derby South is a constituency formed of part of the city of Derby represented in the House of Commons of the UK Parliament since 1983 by veteran MP Margaret Beckett of the Labour Party. She has served under the Labour governments of Harold Wilson, James Callaghan, Tony Blair and Gordon Brown. She became interim Leader of the Labour Party in 1994 when John Smith suddenly died. She has also served under Neil Kinnock and Smith himself.
Stoke-on-Trent South is a constituency created in 1950, and represented in the House of Commons of the UK Parliament since 2017 by Jack Brereton, a Conservative. The local electorate returned a Labour MP in every election until 2017, when Brereton became its first Conservative MP. The seat is non-rural and in the upper valley of the Trent covering half of the main city of the Potteries, a major ceramics centre since the 17th century.
Telford is a constituency represented in the House of Commons of the UK Parliament since May 2015 by Lucy Allan, a Conservative, who defeated David Wright, the former Labour Party MP for the seat.
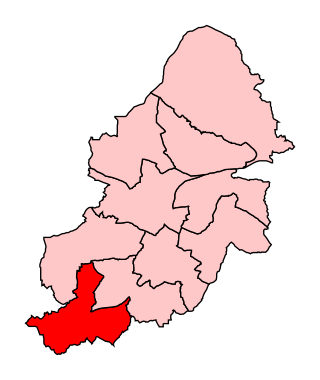
Birmingham Northfield is a constituency represented in the House of Commons of the UK Parliament since 2019 by Gary Sambrook, a Conservative. It represents the southernmost part of the city of Birmingham.
Wolverhampton South East is a borough constituency represented in the House of Commons of the Parliament of the United Kingdom. It elects one Member of Parliament (MP) by the first past the post system of election.
Stevenage is a constituency in Hertfordshire represented in the House of Commons of the UK Parliament since 2010 by Stephen McPartland, a member of the Conservative Party.
Greenwich and Woolwich is a constituency represented in the House of Commons of the UK Parliament since 2015 by Matthew Pennycook of the Labour Party.
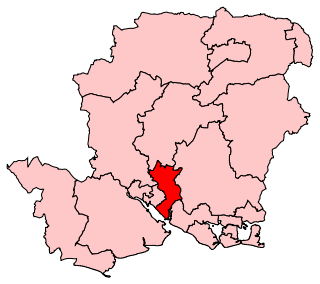
Eastleigh is a constituency represented in the House of Commons of the UK Parliament since 2019 by Paul Holmes, a Conservative.
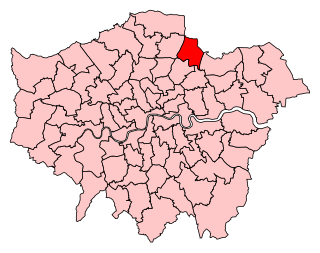
Chingford and Woodford Green is a constituency in North East London represented in the House of Commons of the UK Parliament by Sir Iain Duncan Smith of the Conservative Party since its creation in 1997.
Bargate is an electoral ward in Southampton, England. It covers Southampton City Centre, and stretches as far as Ocean Village and St Mary's to the east, and West Quay and The Polygon to the west. Bargate Ward had 18,762 residents in the 2011 Census, which had risen to an estimated 20,926 in mid 2015.
Peartree Ward is an Electoral Ward in the Unitary Authority of Southampton, England.
The 2008 Southampton Council election took place on 1 May 2008 to elect members of Southampton Unitary Council in Hampshire, England. One third of the council was up for election and the Conservative Party gained overall control of the council from no overall control.
Royston Matthew Smith is a British Conservative Party politician and has served as Member of Parliament (MP) for Southampton Itchen since the 2015 general election. Smith was previously a councillor on the Southampton City Council.