Burton | |
---|---|
County constituency for the House of Commons | |
County | Staffordshire |
Population | 102,731 (2011 census) [1] |
Electorate | 75,302 (December 2010) [2] |
Major settlements | Burton upon Trent and Uttoxeter |
Current constituency | |
Created | 1885 |
Member of Parliament | Kate Kniveton (Conservative) |
Seats | One |
Created from | East Staffordshire and North Staffordshire |
Burton is a constituency represented in the House of Commons of the Parliament of the United Kingdom. It elects one Member of Parliament (MP) by the first past the post system of election.
Further to the 2023 Periodic Review of Westminster constituencies, enacted by the Parliamentary Constituencies Order 2023, there will be no changes to the constituency boundaries, but it will be renamed Burton and Uttoxeter from the 2024 general election. [3] [4]
The constituency was created in 1885 replacing the previous East Staffordshire and North Staffordshire constituencies. Burton upon Trent is a centre of the brewing industry and for sixty years from 1885 to 1945, the MPs were from brewery-owning families. Despite the working class nature of Burton upon Trent from 1950 to 1997, the seat was held by the Conservative Party, albeit often with relatively small majorities. Traditionally the brewing industry has been a strong supporter of the Conservative Party. [5] However, like many traditionally Conservative seats, it was lost to the Labour Party at the 1997 general election, which they won in a landslide. Janet Dean retained the seat until 2010, when the Conservatives retook it.
This constituency covers most of the East Staffordshire district. The main town is Burton upon Trent, while it also includes Uttoxeter, Tutbury and Rocester. The remaining small part of East Staffordshire, the area around Abbots Bromley and Yoxall, and, from the 2010 general election (following a review by the Boundary Commission for England), the Needwood ward (containing the village of Barton-under-Needwood), is in the Lichfield constituency.
Following a local government boundary review in which came into effect in May 2023, [6] [7] the constituency currently comprises the following wards or part wards of the Borough of East Staffordshire:
Party | Candidate | Votes | % | ±% | |
---|---|---|---|---|---|
Labour | Jacob Collier [11] | ||||
Reform UK | James Bush [12] | ||||
Green | Anna Williams Westwood [13] | ||||
Majority | |||||
Turnout |
Party | Candidate | Votes | % | ±% | |
---|---|---|---|---|---|
Conservative | Kate Griffiths | 29,560 | 60.7 | 2.7 | |
Labour | Louise Walker | 15,064 | 30.9 | 6.9 | |
Liberal Democrats | Adam Wain | 2,681 | 5.5 | 3.0 | |
Green | Kate Copeland | 1,433 | 2.9 | 1.2 | |
Majority | 14,496 | 29.8 | 9.6 | ||
Turnout | 48,738 | 65.0 | 2.5 | ||
Conservative hold | Swing | 4.8 | |||
Party | Candidate | Votes | % | ±% | |
---|---|---|---|---|---|
Conservative | Andrew Griffiths | 28,936 | 58.0 | 8.2 | |
Labour | John McKiernan | 18,889 | 37.8 | 10.5 | |
Liberal Democrats | Dominic Hardwick | 1,262 | 2.5 | 0.0 | |
Green | Simon Hales | 824 | 1.7 | 0.8 | |
Majority | 10,047 | 20.2 | 2.3 | ||
Turnout | 49,911 | 67.5 | 2.0 | ||
Conservative hold | Swing | 1.3 | |||
Party | Candidate | Votes | % | ±% | |
---|---|---|---|---|---|
Conservative | Andrew Griffiths | 24,376 | 49.8 | 5.3 | |
Labour | Jon Wheale [17] | 13,484 | 27.3 | 4.4 | |
UKIP | Mike Green [17] | 8,658 | 17.5 | 14.6 | |
Liberal Democrats | David MacDonald [18] | 1,232 | 2.5 | 13.3 | |
Green | Samantha Patrone [19] | 1,224 | 2.5 | New | |
Majority | 11,252 | 22.5 | 10.9 | ||
Turnout | 49,334 | 65.5 | 1.0 | ||
Conservative hold | Swing | 4.9 | |||
Party | Candidate | Votes | % | ±% | |
---|---|---|---|---|---|
Conservative | Andrew Griffiths | 22,188 | 44.5 | 7.2 | |
Labour | Ruth Smeeth | 15,884 | 31.9 | 10.2 | |
Liberal Democrats | Michael Rodgers | 7,891 | 15.8 | 3.4 | |
BNP | Alan Hewitt | 2,409 | 4.8 | 1.0 | |
UKIP | Philip Lancaster | 1,451 | 2.9 | 1.0 | |
Majority | 6,304 | 12.6 | N/A | ||
Turnout | 49,823 | 66.5 | 6.1 | ||
Conservative gain from Labour | Swing | 8.7 | |||
Party | Candidate | Votes | % | ±% | |
---|---|---|---|---|---|
Labour | Janet Dean | 19,701 | 41.1 | 7.9 | |
Conservative | Adrian Pepper | 18,280 | 38.2 | 0.4 | |
Liberal Democrats | Sandra Johnson | 6,236 | 13.0 | 3.4 | |
BNP | Julie Russell | 1,840 | 3.8 | New | |
UKIP | Philip Lancaster | 913 | 1.9 | 0.2 | |
Veritas | Brian Buxton | 912 | 1.9 | New | |
Majority | 1,421 | 2.9 | 7.5 | ||
Turnout | 47,882 | 61.0 | 0.7 | ||
Labour hold | Swing | ||||
Party | Candidate | Votes | % | ±% | |
---|---|---|---|---|---|
Labour | Janet Dean | 22,783 | 49.0 | 2.0 | |
Conservative | Maggie A. Punyer | 17,934 | 38.6 | 0.8 | |
Liberal Democrats | David A. Fletcher | 4,468 | 9.6 | 1.1 | |
UKIP | Ian E. Crompton | 984 | 2.1 | New | |
ProLife Alliance | John D.W. Roberts | 288 | 0.6 | New | |
Majority | 4,849 | 10.4 | 1.2 | ||
Turnout | 46,457 | 61.7 | 13.3 | ||
Labour hold | Swing | ||||
Party | Candidate | Votes | % | ±% | |
---|---|---|---|---|---|
Labour | Janet Dean | 27,810 | 51.0 | 11.0 | |
Conservative | Ivan Lawrence | 21,480 | 39.4 | 10.3 | |
Liberal Democrats | David A. Fletcher | 4,617 | 8.5 | 1.8 | |
National Democrats | Keith Sharp | 604 | 1.1 | New | |
Majority | 6,330 | 11.6 | N/A | ||
Turnout | 54,514 | 75.1 | 7.4 | ||
Labour gain from Conservative | Swing | 10.6 | |||
Party | Candidate | Votes | % | ±% | |
---|---|---|---|---|---|
Conservative | Ivan Lawrence | 30,845 | 49.7 | 1.0 | |
Labour | Patricia K. Muddyman | 24,849 | 40.0 | 6.4 | |
Liberal Democrats | Rob C. Renold | 6,375 | 10.3 | 5.4 | |
Majority | 5,996 | 9.7 | 7.4 | ||
Turnout | 62,069 | 82.4 | 3.9 | ||
Conservative hold | Swing | 3.7 | |||
Party | Candidate | Votes | % | ±% | |
---|---|---|---|---|---|
Conservative | Ivan Lawrence | 29,160 | 50.7 | 0.4 | |
Labour | Dennis Heptonstall | 19,330 | 33.6 | 3.8 | |
Liberal | Kenneth Hemsley | 9,046 | 15.7 | 3.4 | |
Majority | 9,830 | 17.1 | 4.2 | ||
Turnout | 57,536 | 78.6 | 2.7 | ||
Conservative hold | Swing | 2.1 | |||
Party | Candidate | Votes | % | ±% | |
---|---|---|---|---|---|
Conservative | Ivan Lawrence | 27,874 | 51.1 | 2.9 | |
Labour | Robert Slater | 16,227 | 29.8 | 6.5 | |
Liberal | June Garner | 10,420 | 19.1 | 9.4 | |
Majority | 11,647 | 21.3 | 3.6 | ||
Turnout | 54,521 | 75.9 | 2.8 | ||
Conservative hold | Swing | 1.8 | |||
Party | Candidate | Votes | % | ±% | |
---|---|---|---|---|---|
Conservative | Ivan Lawrence | 29,821 | 54.00 | ||
Labour | GS Jones | 20,020 | 36.25 | ||
Liberal | K Stevens | 5,383 | 9.75 | ||
Majority | 9,801 | 17.75 | |||
Turnout | 55,224 | 78.75 | |||
Conservative hold | Swing | ||||
Party | Candidate | Votes | % | ±% | |
---|---|---|---|---|---|
Conservative | Ivan Lawrence | 23,496 | 44.45 | ||
Labour | David Hill | 21,398 | 40.48 | ||
Liberal | K Stevens | 7,969 | 15.07 | New | |
Majority | 2,098 | 3.97 | |||
Turnout | 52,863 | 77.97 | |||
Conservative hold | Swing | ||||
Party | Candidate | Votes | % | ±% | |
---|---|---|---|---|---|
Conservative | Ivan Lawrence | 28,343 | 53.09 | ||
Labour | David Hill | 25,040 | 46.91 | ||
Majority | 3,303 | 6.18 | |||
Turnout | 58,383 | 79.48 | |||
Conservative hold | Swing | ||||
Party | Candidate | Votes | % | ±% | |
---|---|---|---|---|---|
Conservative | John Jennings | 27,428 | 54.32 | ||
Labour | Ronald G Truman | 23,063 | 45.68 | ||
Majority | 4,365 | 8.64 | |||
Turnout | 50,491 | 75.60 | |||
Conservative hold | Swing | ||||
Party | Candidate | Votes | % | ±% | |
---|---|---|---|---|---|
Conservative | John Jennings | 23,773 | 50.29 | ||
Labour | Charles William Shepherd | 23,496 | 49.71 | ||
Majority | 277 | 0.58 | |||
Turnout | 47,269 | 78.74 | |||
Conservative hold | Swing | ||||
Party | Candidate | Votes | % | ±% | |
---|---|---|---|---|---|
Conservative | John Jennings | 25,236 | 53.24 | ||
Labour | Thomas S Pritchard | 22,161 | 46.76 | ||
Majority | 3,075 | 6.48 | |||
Turnout | 47,397 | 80.22 | |||
Conservative hold | Swing | ||||
Party | Candidate | Votes | % | ±% | |
---|---|---|---|---|---|
Conservative | John Jennings | 26,926 | 56.14 | ||
Labour | Edward McGarry | 21,032 | 43.86 | ||
Majority | 5,894 | 12.28 | |||
Turnout | 47,958 | 82.36 | |||
Conservative hold | Swing | ||||
Party | Candidate | Votes | % | ±% | |
---|---|---|---|---|---|
Conservative | John Jennings | 24,519 | 53.23 | ||
Labour Co-op | Ewart Taylor | 21,546 | 46.77 | ||
Majority | 2,973 | 6.46 | |||
Turnout | 46,065 | 80.78 | |||
Conservative hold | Swing | ||||
Party | Candidate | Votes | % | ±% | |
---|---|---|---|---|---|
Conservative | Arthur Colegate | 24,884 | 50.75 | ||
Labour | John Stonehouse | 24,151 | 49.25 | ||
Majority | 733 | 1.50 | |||
Turnout | 49,035 | 86.31 | |||
Conservative hold | Swing | ||||
Party | Candidate | Votes | % | ±% | |
---|---|---|---|---|---|
Conservative | Arthur Colegate | 24,903 | 51.54 | ||
Labour | Arthur W. Lyne | 23,418 | 48.46 | ||
Majority | 1,485 | 3.08 | N/A | ||
Turnout | 48,321 | 86.05 | |||
Conservative gain from Labour | Swing | ||||
Party | Candidate | Votes | % | ±% | |
---|---|---|---|---|---|
Labour | Arthur W. Lyne | 18,288 | 51.06 | ||
Conservative | John Gretton | 17,528 | 48.94 | ||
Majority | 760 | 2.12 | N/A | ||
Turnout | 35,816 | 66.84 | |||
Labour gain from Conservative | Swing | ||||
Party | Candidate | Votes | % | ±% | |
---|---|---|---|---|---|
Conservative | John Gretton | 23,539 | 74.54 | ||
Labour | Gladys Nellie Paling | 8,041 | 25.46 | ||
Majority | 15,498 | 49.08 | |||
Turnout | 31,580 | 65.64 | |||
Conservative hold | Swing | ||||
Party | Candidate | Votes | % | ±% | |
---|---|---|---|---|---|
Conservative | John Gretton | 26,117 | 74.73 | ||
Labour | William Paling | 8,832 | 25.27 | ||
Majority | 17,285 | 49.46 | |||
Turnout | 34,949 | 74.65 | |||
Conservative hold | Swing | ||||
Party | Candidate | Votes | % | ±% | |
---|---|---|---|---|---|
Unionist | John Gretton | 18,243 | 52.6 | −21.6 | |
Labour | William Paling | 10,511 | 30.3 | +4.5 | |
Liberal | Ifor Bowen Lloyd | 5,943 | 17.1 | New | |
Majority | 7,732 | 22.3 | −26.1 | ||
Turnout | 34,697 | 75.3 | −2.5 | ||
Registered electors | 46,099 | ||||
Unionist hold | Swing | −13.1 | |||
Party | Candidate | Votes | % | ±% | |
---|---|---|---|---|---|
Unionist | John Gretton | 20,550 | 74.2 | N/A | |
Labour | F. Thoresby | 7,141 | 25.8 | New | |
Majority | 13,409 | 48.4 | N/A | ||
Turnout | 27,691 | 77.8 | N/A | ||
Registered electors | 35,599 | ||||
Unionist hold | Swing | N/A | |||
Party | Candidate | Votes | % | ±% | |
---|---|---|---|---|---|
Unionist | John Gretton | Unopposed | |||
Unionist hold | |||||
Party | Candidate | Votes | % | ±% | |
---|---|---|---|---|---|
Unionist | John Gretton | Unopposed | |||
Unionist hold | |||||
Party | Candidate | Votes | % | ±% | |
---|---|---|---|---|---|
C | Unionist | John Gretton | Unopposed | ||
Unionist hold | |||||
Cindicates candidate endorsed by the coalition government. |
General Election 1914–15: Another General Election was required to take place before the end of 1915. The political parties had been making preparations for an election to take place and by July 1914, the following candidates had been selected;
Party | Candidate | Votes | % | ±% | |
---|---|---|---|---|---|
Liberal Unionist | Robert Ratcliff | 5,877 | 60.8 | N/A | |
Liberal | Harold Rylett | 3,784 | 39.2 | New | |
Majority | 2,093 | 21.6 | N/A | ||
Turnout | 9,661 | 81.3 | N/A | ||
Registered electors | 11,878 | ||||
Liberal Unionist hold | Swing | N/A | |||
Party | Candidate | Votes | % | ±% | |
---|---|---|---|---|---|
Liberal Unionist | Robert Ratcliff | Unopposed | |||
Liberal Unionist hold | |||||
Party | Candidate | Votes | % | ±% | |
---|---|---|---|---|---|
Liberal Unionist | Robert Ratcliff | 5,613 | 55.1 | −6.9 | |
Liberal | Francis Vane | 4,572 | 44.9 | +6.9 | |
Majority | 1,041 | 10.2 | −13.8 | ||
Turnout | 10,185 | 88.8 | +5.7 | ||
Registered electors | 11,465 | ||||
Liberal Unionist hold | Swing | −6.9 | |||
Party | Candidate | Votes | % | ±% | |
---|---|---|---|---|---|
Liberal Unionist | Robert Ratcliff | 5,592 | 62.0 | New | |
Liberal | Jabez Edward Johnson-Ferguson | 3,421 | 38.0 | N/A | |
Majority | 2,171 | 24.0 | N/A | ||
Turnout | 9,013 | 83.1 | N/A | ||
Registered electors | 10,852 | ||||
Liberal Unionist gain from Liberal | Swing | N/A | |||
Party | Candidate | Votes | % | ±% | |
---|---|---|---|---|---|
Liberal | Sydney Evershed | Unopposed | |||
Liberal hold | |||||
Party | Candidate | Votes | % | ±% | |
---|---|---|---|---|---|
Liberal | Sydney Evershed | Unopposed | |||
Liberal hold | |||||
Party | Candidate | Votes | % | ±% | |
---|---|---|---|---|---|
Liberal | Sydney Evershed | 4,792 | 67.4 | N/A | |
Conservative | Gerald Holbech Hardy | 2,319 | 32.6 | New | |
Majority | 2,473 | 34.8 | N/A | ||
Turnout | 7,111 | 75.1 | N/A | ||
Registered electors | 9,463 | ||||
Liberal hold | Swing | N/A | |||
Party | Candidate | Votes | % | ±% | |
---|---|---|---|---|---|
Liberal | Michael Bass | Unopposed | |||
Liberal hold | |||||
Party | Candidate | Votes | % | ±% | |
---|---|---|---|---|---|
Liberal | Michael Bass | 5,395 | 68.0 | ||
Conservative | Gerald Holbech Hardy | 2,543 | 32.0 | ||
Majority | 2,852 | 36.0 | |||
Turnout | 7,938 | 83.9 | |||
Registered electors | 9,463 | ||||
Liberal win (new seat) |
Romford is a constituency in Greater London represented in the House of Commons of the UK Parliament since 2001 by Andrew Rosindell, a Conservative.
Liverpool, West Derby is a constituency represented in the House of Commons of the UK Parliament since 2019 by Ian Byrne of the Labour Party.
Rushcliffe is a constituency in Nottinghamshire represented in the House of Commons of the UK Parliament from 2019 by Ruth Edwards, a Conservative.
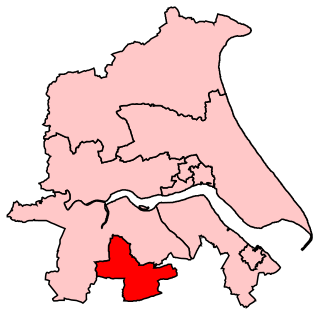
Scunthorpe is a constituency represented in the House of Commons of the UK Parliament since 2019 by Holly Mumby-Croft, a member of the Conservative Party, when she gained the seat from the Labour Party.
Birmingham Edgbaston is a constituency, represented in the House of Commons of the UK Parliament since 2017 by Preet Gill, a Labour Co-op MP.
Battersea is a constituency in the London Borough of Wandsworth. It has been represented since 2017 by Marsha de Cordova of the Labour Party.
Morecambe and Lunesdale is a constituency represented in the House of Commons of the UK Parliament since 2010 by David Morris, a Conservative.
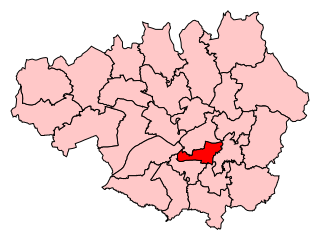
Manchester Gorton is a constituency represented in the House of Commons of the UK Parliament by Labour's Afzal Khan, who was elected at the 2017 general election. It is the safest Labour seat in Greater Manchester by numerical majority and one of the safest in the country.
Liverpool, Walton is a constituency represented in the House of Commons of the UK Parliament since 2017 by Dan Carden of the Labour Party. Carden won the highest percentage share of the vote in June 2017 of 650 constituencies, 85.7%. It is the safest Labour seat in the United Kingdom, and the safest seat in the country having been won by 85% of the vote in the most recent election in 2019.
Newark is a constituency in Nottinghamshire, England. It is currently represented by Robert Jenrick of the Conservative Party who won the seat in a by-election on 5 June 2014, following the resignation of Patrick Mercer in April 2014.
Lichfield is a constituency in Staffordshire represented in the House of Commons of the UK Parliament since its 1997 recreation by Michael Fabricant, a Conservative.
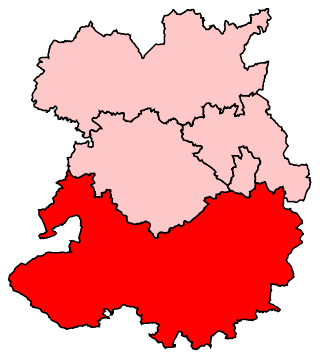
Ludlow is a constituency in Shropshire represented in the House of Commons of the UK Parliament since 2005 by Philip Dunne, a member of the Conservative Party.
Stoke-on-Trent Central is a constituency in Staffordshire. It has been represented by Jo Gideon of the Conservative Party since the general election of 2019.
Stoke-on-Trent North is a constituency represented in the House of Commons of the UK Parliament since 2019 by Jonathan Gullis, a member of the Conservative Party.
Stoke-on-Trent South is a constituency created in 1950, and represented in the House of Commons of the UK Parliament since 2017 by Jack Brereton, a Conservative. The local electorate returned a Labour MP in every election until 2017, when Brereton became its first Conservative MP. The seat is non-rural and in the upper valley of the Trent covering half of the main city of the Potteries, a major ceramics centre since the 17th century.
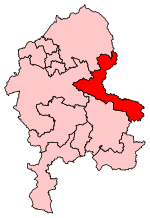
Stone is a constituency in Staffordshire, represented in the House of Commons of the UK Parliament since its 1997 recreation by Sir Bill Cash, a Conservative. On 9 June 2023, he announced his intention to stand down at the next general election.
Tamworth is a constituency represented in the House of Commons of the UK Parliament, based on the town of Tamworth in Staffordshire, England. The seat is currently represented by Sarah Edwards of the Labour Party, following a by-election in October 2023. It was previously held by Chris Pincher of the Conservative Party, who held the seat from 2010 to 2023, when he resigned. He had been suspended from the party since July 2022.
Stratford-on-Avon is a constituency represented in the House of Commons of the UK Parliament since 2010 by Nadhim Zahawi, a member of the Conservative Party, who briefly served as the Chancellor of the Exchequer in mid-2022. The constituency is in Warwickshire; as its name suggests, it is centred on the town of Stratford-upon-Avon, birthplace of William Shakespeare, but also takes in the surrounding areas around the town, including the towns of Alcester and Henley-in-Arden.
Fareham is a constituency in Hampshire represented in the House of Commons of the UK Parliament. Since 2015, it has been represented by Suella Braverman of the Conservative Party.
Mid Derbyshire is a constituency represented in the House of Commons of the UK Parliament since its 2010 creation by Pauline Latham, a Conservative.