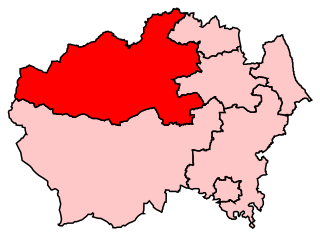
The seat comprises the two eponymous towns, with modest hills surrounding them, in the upper valley of the River Avon.
The towns of Warwick and Royal Leamington Spa are still distinct, however, and form, in the modern seat, a contiguous urban area. Both towns are relatively affluent, although there are pockets of deprivation in Leamington. Warwick, with its historic castle, is an internationally advertised tourist destination, while Leamington's economy is more dependent on storage, distribution, manufacturing, processing, engineering and industry. Leamington is also more ethnically diverse (e.g. five per cent of the constituency's population is of Asian ethnicity)[clarification needed] and is home to some students of the University of Warwick that lies close to Coventry.
Unemployment claimants who were registered jobseekers were in November 2012 significantly lower than the national average of 3.8%, at 2.2% of the population based on a statistical compilation by The Guardian.[3]
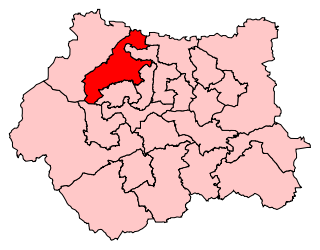
Boundaries
Map of current boundaries since the 2010 general election
2010–present: The District of Warwick wards of Bishop's Tachbrook, Brunswick, Budbrooke, Clarendon, Crown, Manor, Milverton, Warwick North, Warwick South, Warwick West, Whitnash, and Willes. The 2010 boundary changes reduced the constituency's area by removing outlying villages, reflecting population and housing growth.
1997–2010: The District of Warwick wards of Bishop's Tachbrook, Brunswick, Budbrooke, Clarendon, Crown, Cubbington, Lapworth, Leek Wootton, Manor, Milverton, Radford Semele, Warwick North, Warwick South, Warwick West, Whitnash, and Willes, and the District of Stratford-on-Avon wards of Henley, Tanworth, and Tanworth Earlswood.
1983–1997: The District of Warwick wards of Bishop's Tachbrook, Brunswick, Budbrooke, Clarendon, Crown, Cubbington, Lapworth, Leek Wootton, Manor, Milverton, Radford Semele, Warwick North, Warwick South, Warwick West, Whitnash, and Willes.
1974–1983: As 1950 but with redrawn boundaries.
1950–1974: The Boroughs of Warwick and Royal Leamington Spa, the Urban District of Kenilworth, and the Rural District of Warwick.
1918–1950: The Boroughs of Warwick, Royal Leamington Spa, and Stratford-on-Avon, the Urban District of Kenilworth, the Rural Districts of Warwick and Alcester, and parts of the Rural Districts of Stratford-on-Avon and Brailes.
1885-1918: The existing parliamentary borough of Warwick, the municipal borough of Royal Leamington Spa, and the local government districts of Milverton and Lillington.[4]
Represented solely by Members of Parliament from the Conservative Party for 87 years from 1910-97, the seat was for much of this time a safe seat; seeing frequent majorities of more than 10,000 votes, and the seat was uncontested at both the 1918 and 1922 general elections. The seat had not been expected to change hands at the 1997 general election: as such James Plaskitt's defeat of Dudley Smith was a Portillo moment, without the decapitation of a government frontbencher. Plaskitt increased his majority at the 2001 general election, but on a lower turnout. At the 2005 general election, Warwick and Leamington was 85th on the Conservative list of target seats, meaning that to gain it they would have required a somewhat greater swing than was seen nationally. With a greater swing from Labour to the Liberal Democrats, Plaskitt narrowly retained the seat with a majority slashed from nearly 6,000 votes to a mere 266.
However, minor boundary changes in Labour's favour took effect at the 2010 general election and the winner was variously predicted.[citation needed] In 2010, the seat was gained by a Conservative, Chris White, with a majority of 7% of the vote. On this occasion, the Conservative Party was the main beneficiary from swings away from the Labour Party and the Green Party. White held the seat in 2015 with an increased majority of 6,606 votes. The Labour candidate, Matthew Western gained the seat from the Conservatives on a swing of 7.6% at the 2017 snap general election, overturning a majority of 6,606 votes.[7] (this was the fourth-largest lead overturned by Labour at the 2017 general election). This made Matt Western the second MP for Warwick and Leamington from the Labour Party in the history of the constituency. At the 2019 general election, Western held the seat with a slightly reduced majority.
General Election 1939–40: Another General Election was required to take place before the end of 1940. The political parties had been making preparations for an election to take place from 1939 and by the end of this year, the following candidates had been selected;
↑ A borough constituency (for the purposes of election expenses and type of returning officer)
Related Research Articles
Sheffield Hallam is a constituency represented in the House of Commons of the UK Parliament since 2019 by Olivia Blake of the Labour Party.
Warwick is a local government district in Warwickshire, England. It is named after the historic county town of Warwick, which is the district's second largest town; the largest town is Royal Leamington Spa, where the council is based. The district also includes the towns of Kenilworth and Whitnash and surrounding villages and rural areas. Leamington Spa, Warwick and Whitnash form a conurbation which has about two thirds of the district's population.
Hexham is a constituency in Northumberland represented in the House of Commons of the UK Parliament since 2010 by Guy Opperman, a Conservative. As with all constituencies, the constituency elects one Member of Parliament (MP) by the first past the post system of election at least every five years.
Sedgefield is a constituency in County Durham represented in the House of Commons of the UK Parliament since 2019 by Paul Howell of the Conservative Party. It elects one Member of Parliament (MP) by the first past the post system of election.
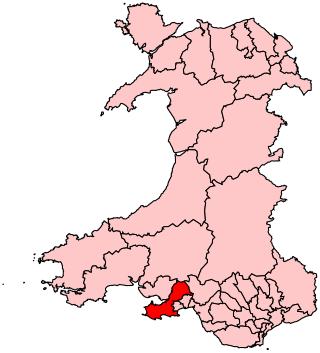
Gower is a constituency created in 1885 and represented in the House of Commons of the UK Parliament by one Member of Parliament (MP). Tonia Antoniazzi of the Labour Party became its MP after winning it from Conservative Byron Davies in the 2017 UK general election. Her party had previously represented the seat from 1909 until 2015.
Eddisbury is a constituency in Cheshire represented in the House of Commons of the UK Parliament since 2019 by Edward Timpson, a Conservative.
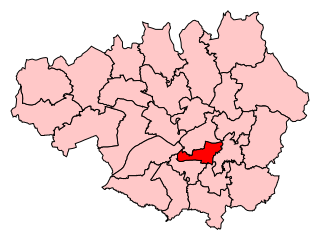
Manchester Gorton is a constituency represented in the House of Commons of the UK Parliament by Labour's Afzal Khan, who was elected at the 2017 general election. It is the safest Labour seat in Greater Manchester by numerical majority and one of the safest in the country.
Shipley is a constituency represented in the House of Commons of the UK Parliament since 2005 by Philip Davies, a Conservative.
Bristol West is a borough constituency represented in the House of Commons of the Parliament of the United Kingdom since 2015 by Thangam Debbonaire of the Labour Party. It mostly covers the central and western parts of Bristol.
North West Durham is a constituency represented in the House of Commons of the UK Parliament since 12 December 2019 by Richard Holden of the Conservative Party.
North East Derbyshire is a constituency created in 1885 represented in the House of Commons of the UK Parliament since 2017 by Lee Rowley of the Conservative Party. This was the first time a Conservative candidate had been elected since 1935.
Nottingham South is a constituency of the Parliament of the United Kingdom, represented since 2010 by Lilian Greenwood of the Labour Party.
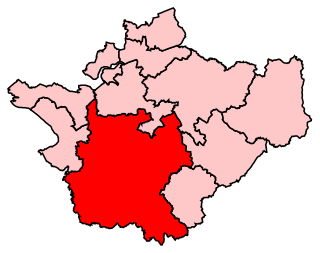
Stratford-on-Avon is a constituency represented in the House of Commons of the UK Parliament since 2010 by Nadhim Zahawi, a member of the Conservative Party, who briefly served as the Chancellor of the Exchequer in mid-2022. The constituency is in Warwickshire; as its name suggests, it is centred on the town of Stratford-upon-Avon, birthplace of William Shakespeare, but also takes in the surrounding areas around the town, including the towns of Alcester and Henley-in-Arden.
Bristol East is a constituency recreated in 1983 covering the eastern part of the City of Bristol, represented in the House of Commons of the UK Parliament since 2005 by Kerry McCarthy of the Labour Party.
Kenilworth and Southam is a constituency in Warwickshire, England represented in the House of Commons of the UK Parliament since 2010 by Jeremy Wright, a Conservative who served as Culture Secretary until 24 July 2019, having previously served as Attorney General for England and Wales from 2014 to 2018.
Rugby is a constituency represented in the House of Commons of the UK Parliament since its 2010 recreation by Mark Pawsey, a Conservative.
Elections to Warwick District Council took place on Thursday 7 May 2015, with votes counted and declared on Saturday 9 May 2015.
The Warwick Order 2014 is a statutory instrument of the Parliament of the United Kingdom. The order abolished the existing wards in the district of Warwick.
The 2023 Warwick District Council election took place on 4 May 2023 to elect members of Warwick District Council in Warwickshire, England. This took place on the same day as other local elections in England. The council remained without control of any party.
↑ "Chap. 23. Redistribution of Seats Act, 1885". The Public General Acts of the United Kingdom passed in the forty-eighth and forty-ninth years of the reign of Queen Victoria. London: Eyre and Spottiswoode. 1885. pp.111–198.
This page is based on this Wikipedia article Text is available under the CC BY-SA 4.0 license; additional terms may apply. Images, videos and audio are available under their respective licenses.