Ilford South | |
---|---|
Borough constituency for the House of Commons | |
County | Greater London |
Electorate | 86,401 (December 2010) [1] |
Major settlements | Ilford |
Current constituency | |
Created | 1945 |
Member of Parliament | Sam Tarry (Labour) |
Seats | One |
Created from | Ilford |
Ilford South is a constituency [n 1] created in 1945 represented in the House of Commons of the UK Parliament since 2019 by Sam Tarry of the Labour Party. [n 2]
The seat covers Ilford town centre and the surrounding suburbs, and the housing is predominantly semi-detached with little high-rise development. There is significant commuting to central London via the four stations on the Elizabeth line. The seat is ethnically diverse including white, black and Asian communities. [2]
Ilford South | |
---|---|
Racial makeup (2021) [3] | |
• Asian | 61.2% |
• White | 19.8% |
• Black | 9.9% |
• Other | 5.8% |
• Mixed | 3.3% |
This constituency was created in 1945. The previous MP since 1992, Mike Gapes, who before defecting to Change UK, was the fourth Labour Party MP, each of whose tenures was interspersed or preceded by one of a Conservative MP serving the area. Regarded as a key marginal seat for decades, under Gapes's tenure Ilford South became a very safe seat for the Labour Party; in every election since 1997 it has been won by a majority of over 20% by Labour, and in 2017 they secured over 75% of the vote in the constituency.
The 2015 result made the seat the 38th safest of Labour's 232 seats by percentage of majority. [4] The narrowest result since 1997 (inclusive) was in 2005 at a majority of 21.6%; the 2017 majority is the greatest ever achieved in the seat, at 54.9%.
1945–1950: The Borough of Ilford wards of Clementswood, Cranbrook, Goodmayes, Loxford, and Park.
1950–1974: The Borough of Ilford wards of Clementswood, Cranbrook, Goodmayes, Loxford, Mayfield, and Park.
1974–1983: The London Borough of Redbridge wards of Clementswood, Cranbrook, Goodmayes, Ilford, Mayfield, and Park.
1983–1997: As above substituting Ilford and Park with reshaped wards Loxford, Newbury, and Valentines.
1997–2017: As above plus Chadwell and Seven Kings wards.
2017–present: Following a review of ward boundaries which became effective in May 2017, [5] the constituency comprises the following wards of the London Borough of Redbridge:
Further to the 2023 Periodic Review of Westminster constituencies, enacted by the Parliamentary Constituencies Order 2023, the composition of the constituency from the 2024 United Kingdom general election will be (as they existed on 1st December 2020):
The Cranbrook and Valentines wards will be transferred to Ilford North, with the small part of Wanstead Park ward going to Leyton and Wanstead. To partly compensate, the Chadwell Heath ward will be transferred from Dagenham and Rainham.
Election | Member [7] | Party | |
---|---|---|---|
1945 | Jim Ranger | Labour | |
1950 | Albert Cooper | Conservative | |
1966 | Arnold Shaw | Labour | |
1970 | Albert Cooper | Conservative | |
February 1974 | Arnold Shaw | Labour | |
1979 | Neil Thorne | Conservative | |
1992 | Mike Gapes | Labour | |
February 2019 | The Independent Group for Change | ||
2019 | Sam Tarry | Labour |
Party | Candidate | Votes | % | ±% | |
---|---|---|---|---|---|
Labour | Jas Athwal [8] | ||||
Reform UK | Raj Forhad [9] | ||||
Green | Syed Siddiqi [10] | ||||
Workers Party | Golam Tipu [11] | ||||
Majority | |||||
Turnout |
Party | Candidate | Votes | % | ±% | |
---|---|---|---|---|---|
Labour | Sam Tarry | 35,085 | 65.6 | 10.2 | |
Conservative | Ali Azeem | 10,984 | 20.5 | 0.4 | |
The Independent Group for Change | Mike Gapes | 3,891 | 7.3 | N/A | |
Liberal Democrats | Ashburn Holder | 1,795 | 3.4 | 2.1 | |
Brexit Party | Munish Sharma | 1,008 | 1.9 | New | |
Green | Rosemary Warrington | 714 | 1.3 | 0.4 | |
Majority | 24,101 | 45.1 | 9.8 | ||
Turnout | 53,477 | 62.9 | 7.0 | ||
Labour hold | Swing | 4.9 | |||
Party | Candidate | Votes | % | ±% | |
---|---|---|---|---|---|
Labour Co-op | Mike Gapes | 43,724 | 75.8 | 11.8 | |
Conservative | Christopher Chapman | 12,077 | 20.9 | 5.0 | |
Liberal Democrats | Farid Ahmed | 772 | 1.3 | 0.7 | |
Green | Rosemary Warrington | 542 | 0.9 | 2.0 | |
UKIP | Tariq Saeed | 477 | 0.8 | 4.4 | |
Friends Party | Kane Khan | 65 | 0.1 | New | |
Majority | 31,647 | 54.9 | 16.8 | ||
Turnout | 57,657 | 69.9 | 13.5 | ||
Registered electors | 82,487 | ||||
Labour Co-op hold | Swing | 8.4 | |||
Party | Candidate | Votes | % | ±% | |
---|---|---|---|---|---|
Labour Co-op | Mike Gapes [17] | 33,232 | 64.0 | +14.6 | |
Conservative | Christopher Chapman | 13,455 | 25.9 | −1.5 | |
UKIP | Amjad Khan [18] | 2,705 | 5.2 | +3.0 | |
Green | Rosemary Warrington [19] | 1,506 | 2.9 | +0.3 | |
Liberal Democrats | Ashburn Holder | 1,014 | 2.0 | −15.0 | |
Majority | 19,777 | 38.1 | +16.1 | ||
Turnout | 51,912 | 56.4 | −1.6 | ||
Registered electors | 91,987 | ||||
Labour Co-op hold | Swing | +8.1 | |||
Party | Candidate | Votes | % | ±% | |
---|---|---|---|---|---|
Labour Co-op | Mike Gapes | 25,311 | 49.4 | +0.5 | |
Conservative | Toby Boutle | 14,014 | 27.4 | +0.2 | |
Liberal Democrats | Anood Al-Samerai | 8,679 | 17.0 | −3.5 | |
Green | Wilson Chowdhry | 1,319 | 2.6 | New | |
UKIP | Terry Murray | 1,132 | 2.2 | +0.6 | |
Save King George Hospital | John Jestico | 746 | 1.5 | New | |
Majority | 11,297 | 22.0 | +0.3 | ||
Turnout | 51,201 | 58.0 | +4.4 | ||
Registered electors | 86,220 | ||||
Labour Co-op hold | Swing | +0.2 | |||
Party | Candidate | Votes | % | ±% | |
---|---|---|---|---|---|
Labour Co-op | Mike Gapes | 20,856 | 48.9 | −10.7 | |
Conservative | Stephen Metcalfe | 11,628 | 27.2 | +1.5 | |
Liberal Democrats | Matthew E. Lake | 8,761 | 20.5 | +9.2 | |
British Public Party | Kashif Rana | 763 | 1.8 | New | |
UKIP | Colin H. Taylor | 685 | 1.6 | −1.8 | |
Majority | 9,228 | 21.7 | -12.2 | ||
Turnout | 42,693 | 53.6 | −0.7 | ||
Registered electors | 79,646 | ||||
Labour Co-op hold | Swing | −6.1 | |||
Party | Candidate | Votes | % | ±% | |
---|---|---|---|---|---|
Labour Co-op | Mike Gapes | 24,619 | 59.6 | +1.1 | |
Conservative | Suresh Kumar | 10,622 | 25.7 | −4.4 | |
Liberal Democrats | Ralph Scott | 4,647 | 11.3 | +5.0 | |
UKIP | Harun Khan | 1,407 | 3.4 | New | |
Majority | 13,997 | 33.9 | +5.5 | ||
Turnout | 41,295 | 54.3 | −15.9 | ||
Registered electors | 76,025 | ||||
Labour Co-op hold | Swing | +2.7 | |||
Party | Candidate | Votes | % | ±% | |
---|---|---|---|---|---|
Labour Co-op | Mike Gapes | 29,273 | 58.5 | +13.5 | |
Conservative | Neil Thorne | 15,073 | 30.1 | −14.3 | |
Liberal Democrats | Aina Khan | 3,152 | 6.3 | −3.3 | |
Referendum | David Hodges | 1,073 | 2.1 | New | |
Socialist Labour | Bruce G. Ramsey | 868 | 1.7 | New | |
BNP | Aron Owens | 580 | 1.2 | New | |
Majority | 14,200 | 28.4 | +27.4 | ||
Turnout | 50,019 | 70.2 | -6.5 | ||
Registered electors | 71,202 | ||||
Labour Co-op hold | Swing | +16.6 | |||
Party | Candidate | Votes | % | ±% | |
---|---|---|---|---|---|
Labour Co-op | Mike Gapes | 19,418 | 45.4 | +7.9 | |
Conservative | Neil Thorne | 19,016 | 44.4 | −4.0 | |
Liberal Democrats | George G. Hogarth | 4,126 | 9.6 | −4.5 | |
Natural Law | Nandkishore Bramachari | 269 | 0.6 | New | |
Majority | 402 | 1.0 | N/A | ||
Turnout | 42,829 | 76.7 | +4.9 | ||
Registered electors | 55,741 | ||||
Labour Co-op gain from Conservative | Swing | +6.0 | |||
Party | Candidate | Votes | % | ±% | |
---|---|---|---|---|---|
Conservative | Neil Thorne | 20,351 | 48.4 | +2.9 | |
Labour | Kenneth Jones | 15,779 | 37.5 | +3.1 | |
Liberal | Ralph Scott | 5,928 | 14.1 | −5.4 | |
Majority | 4,572 | 10.9 | -0.2 | ||
Turnout | 42,058 | 71.8 | +1.2 | ||
Registered electors | 58,572 | ||||
Conservative hold | Swing | ||||
Party | Candidate | Votes | % | ±% | |
---|---|---|---|---|---|
Conservative | Neil Thorne | 18,672 | 45.5 | -1.3 | |
Labour | John Hogben | 14,106 | 34.4 | -8.3 | |
Liberal | Ralph Scott | 7,999 | 19.5 | +10.6 | |
BNP | R.A. Martin | 235 | 0.6 | -0.9 | |
Majority | 4,566 | 11.1 | +7.0 | ||
Turnout | 41,012 | 70.6 | -5.3 | ||
Registered electors | 58,208 | ||||
Conservative hold | Swing | ||||
Party | Candidate | Votes | % | ±% | |
---|---|---|---|---|---|
Conservative | Neil Thorne | 19,290 | 46.8 | +6.6 | |
Labour | Arnold Shaw | 17,602 | 42.7 | -2.0 | |
Liberal | Ralph Scott | 3,664 | 8.9 | -5.72 | |
National Front | Terence Fitzgerald [22] | 636 | 1.5 | New | |
Majority | 1,688 | 4.1 | N/A | ||
Turnout | 39,230 | 75.9 | +6.17 | ||
Registered electors | 54,295 | ||||
Conservative gain from Labour | Swing | ||||
Party | Candidate | Votes | % | ±% | |
---|---|---|---|---|---|
Labour | Arnold Shaw | 17,538 | 44.71 | +4.64 | |
Conservative | Neil Thorne | 15,789 | 40.25 | +2.84 | |
Liberal | E. Yates | 5,734 | 14.62 | -7.90 | |
More Prosperous Britain | Tom Keen | 169 | 0.43 | New | |
Majority | 1,749 | 4.46 | +1.80 | ||
Turnout | 39,230 | 69.73 | -7.20 | ||
Registered electors | 56,257 | ||||
Labour hold | Swing | ||||
Party | Candidate | Votes | % | ±% | |
---|---|---|---|---|---|
Labour | Arnold Shaw | 17,201 | 40.07 | -2.96 | |
Conservative | Albert Cooper | 16,058 | 37.41 | -8.84 | |
Liberal | Gareth Wilson | 9,666 | 22.52 | +14.11 | |
Majority | 1,143 | 2.66 | N/A | ||
Turnout | 42,925 | 76.93 | +8.8 | ||
Registered electors | 55,799 | ||||
Labour gain from Conservative | Swing | ||||
Party | Candidate | Votes | % | ±% | |
---|---|---|---|---|---|
Conservative | Albert Cooper | 18,369 | 46.25 | +4.48 | |
Labour | Arnold Shaw | 17,087 | 43.03 | -4.56 | |
Liberal | Gerald Leslie Wilson | 3,341 | 8.41 | -2.22 | |
National Front | Malcolm Eric Leslie Skeggs | 727 | 1.83 | New | |
Independent | Michael Joseph Marks | 190 | 0.48 | New | |
Majority | 1,282 | 3.22 | N/A | ||
Turnout | 39,714 | 68.13 | -8.80 | ||
Registered electors | 58,292 | ||||
Conservative gain from Labour | Swing | ||||
Party | Candidate | Votes | % | ±% | |
---|---|---|---|---|---|
Labour | Arnold Shaw | 20,613 | 47.59 | +9.52 | |
Conservative | Albert Cooper | 18,093 | 41.77 | -0.36 | |
Liberal | Irene Watson | 4,606 | 10.63 | -8.99 | |
Majority | 2,520 | 5.82 | N/A | ||
Turnout | 43,312 | 76.93 | +1.92 | ||
Registered electors | 56,302 | ||||
Labour gain from Conservative | Swing | ||||
Party | Candidate | Votes | % | ±% | |
---|---|---|---|---|---|
Conservative | Albert Cooper | 18,352 | 42.13 | -8.37 | |
Labour | Arnold Shaw | 16,659 | 38.25 | +3.20 | |
Liberal | Peter McGregor | 8,547 | 19.62 | +5.17 | |
Majority | 1,693 | 3.88 | -11.57 | ||
Turnout | 43,558 | 75.01 | -2.90 | ||
Registered electors | 58,066 | ||||
Conservative hold | Swing | ||||
Party | Candidate | Votes | % | ±% | |
---|---|---|---|---|---|
Conservative | Albert Cooper | 23,876 | 50.50 | -6.23 | |
Labour | Gordon Borrie | 16,569 | 35.05 | -8.22 | |
Liberal | Raymond V Netherclift | 6,832 | 14.45 | New | |
Majority | 7,307 | 15.45 | +1.99 | ||
Turnout | 47,277 | 77.91 | +2.59 | ||
Registered electors | 60,678 | ||||
Conservative hold | Swing | ||||
Party | Candidate | Votes | % | ±% | |
---|---|---|---|---|---|
Conservative | Albert Cooper | 27,292 | 56.73 | +1.98 | |
Labour | James Ranger | 20,814 | 43.27 | -1.98 | |
Majority | 6,478 | 13.46 | +3.96 | ||
Turnout | 48,106 | 75.32 | -7.34 | ||
Registered electors | 63,866 | ||||
Conservative hold | Swing | ||||
Party | Candidate | Votes | % | ±% | |
---|---|---|---|---|---|
Conservative | Albert Cooper | 30,177 | 54.75 | +5.24 | |
Labour | James Ranger | 24,938 | 45.25 | +3.72 | |
Majority | 5,239 | 9.50 | +1.52 | ||
Turnout | 54,115 | 82.66 | -2.71 | ||
Registered electors | 66,678 | ||||
Conservative hold | Swing | ||||
Party | Candidate | Votes | % | ±% | |
---|---|---|---|---|---|
Conservative | Albert Cooper | 28,087 | 49.51 | +13.21 | |
Labour | James Ranger | 23,558 | 41.53 | -6.47 | |
Liberal | Ronald Acott Hall | 4,170 | 7.35 | -8.35 | |
Communist | Dave Kelly [23] | 913 | 1.61 | New | |
Majority | 4,529 | 7.98 | N/A | ||
Turnout | 56,728 | 85.37 | +14.27 | ||
Registered electors | 66,720 | ||||
Conservative gain from Labour | Swing | ||||
Party | Candidate | Votes | % | ±% | |
---|---|---|---|---|---|
Labour | James Ranger | 19,339 | 48.0 | ||
Conservative | Edward Boulton | 14,633 | 36.3 | ||
Liberal | Eric Arthur Holloway | 6,322 | 15.7 | ||
Majority | 4,706 | 11.7 | |||
Turnout | 40,294 | 71.1 | |||
Registered electors | 56,669 | ||||
Labour win (new seat) |
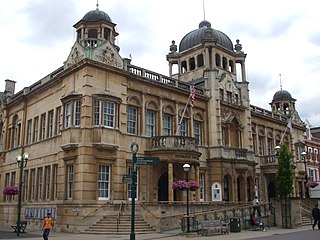
Ilford is a large town in east London, England, 9 miles (14 km) north-east of Charing Cross. Part of the London Borough of Redbridge, Ilford is within the ceremonial county of Greater London. It had a population of 168,168 in 2011, compared to 303,858 for the entire borough.
The London Borough of Redbridge is a London borough established in 1965.
Michael John Gapes is a British former politician who served as Member of Parliament (MP) for Ilford South from 1992 to 2019.
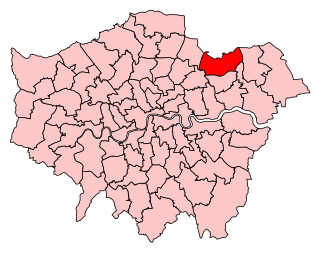
Ilford North is a constituency created in 1945 and represented in the House of Commons of the UK Parliament since 2015 by Wes Streeting of the Labour Party.
Southampton Test is a constituency represented in the House of Commons of the UK Parliament since 1997 by Alan Whitehead, a member of the Labour Party.
Romford is a constituency in Greater London represented in the House of Commons of the UK Parliament since 2001 by Andrew Rosindell, a Conservative.
Leyton and Wanstead is a constituency in Greater London created in 1997 and represented in the House of Commons of the UK Parliament since 2010 by John Cryer of the Labour Party.
East Ham is a constituency in the London Borough of Newham represented in the House of Commons of the UK Parliament since its creation in 1997 by Stephen Timms of the Labour Party.
Greenwich and Woolwich is a constituency represented in the House of Commons of the UK Parliament since 2015 by Matthew Pennycook of the Labour Party.
Chingford and Woodford Green is a constituency in North East London represented in the House of Commons of the UK Parliament by Sir Iain Duncan Smith of the Conservative Party since its creation in 1997.
Hackney South and Shoreditch is a constituency represented in the House of Commons of the UK Parliament since 2005 by Meg Hillier of Labour Co-op.
Walthamstow is a constituency in Greater London created in 1974 and represented in the House of Commons of the UK Parliament since 2010 by Stella Creasy, a member of the Labour and Co-operative Party, in political union with the Labour Party.
The region of Greater London, including the City of London, is divided into 73 parliamentary constituencies which are sub-classified as borough constituencies, affecting the type of electoral officer and level of expenses permitted.
Dagenham and Rainham is a constituency represented in the House of Commons of the UK Parliament by Jon Cruddas of the Labour Party since its 2010 creation.
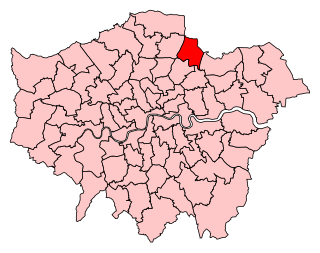
Wanstead and Woodford was a constituency in North East London represented in the House of Commons of the Parliament of the United Kingdom. It elected one Member of Parliament (MP) by the first past the post system of election. It existed between 1964 and 1997.
Elections for Redbridge London Borough Council were held on 6 May 2010. The 2010 General Election and other local elections took place on the same day.
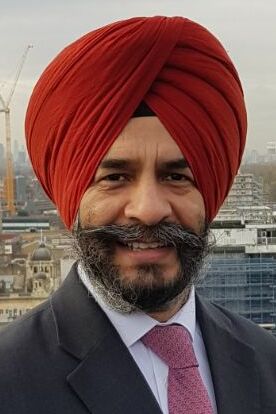
Jas Athwal is a British politician serving as Leader of Redbridge London Borough Council since 2014. A member of the Labour Party, he is their prospective parliamentary candidate for Ilford South.
Samuel Peter Tarry is a British politician who was the Member of Parliament (MP) for Ilford South until the dissolution of Parliament ahead of the 2024 United Kingdom general election. He was a member of the Socialist Campaign Group parliamentary caucus. On 10 October 2022 he was deselected by the Ilford South Constituency Labour Party as its candidate for the next election.
Elections for Redbridge Council in London were held on 2 May 2002. It was a part of the wider 2002 London local elections. The Conservatives won 43% of the vote in the district. The turnout was 34.26%, a decrease from the 36% seen in the 1998 London local elections.
{{cite web}}
: CS1 maint: archived copy as title (link)