January 2010 North American winter storms

Last updated

January 2010 North American winter storms
First Wave of January 2010 El Nino Storms, on Sunday, January 17.jpg
The first wave of the January 2010 El Niño storms to affect California (Storms #2–4), on January 17.
Type Superstorm
Bomb cyclone
Extratropical cyclone
Blizzard
Upper-level low
Tornado outbreak
FormedJanuary 14, 2010 (first storm formed)
DissipatedJanuary 28, 2010 (sixth storm dissipated)
Highest winds
  • 74 mph (119 km/h) [1]
Highest gust94 mph (151 km/h) [1]
Lowest pressure964 mbar (28.5 inHg) (Storm #3) [2]
Tornadoes
confirmed
6 confirmed
Max. rating1 EF1 tornado
Maximum snowfall
or ice accretion
90 inches (230 cm) of snow at Mammoth Lakes, California. [3]
Maximum rainfall20 inches (51 cm) of rain at the Sierra Nevada, California
FatalitiesAt least 10 [4]
Damage>$66.879 million (2010 USD) [5] [6]
Power outages>1.3 million [3] [4]
Areas affected

1Most severe tornado damage; see Enhanced Fujita scale

The January 2010 North American winter storms were a group of seven powerful winter storms that affected Canada and the Contiguous United States, particularly California. The storms developed from the combination of a strong El Niño episode, a powerful jet stream, [7] and an atmospheric river that opened from the West Pacific Ocean into the Western Seaboard. [8] [9] The storms shattered multiple records across the Western United States, with the sixth storm breaking records for the lowest recorded air pressure in multiple parts of California, [3] [10] which was also the most powerful winter storm to strike the Southwestern United States in 140 years. [1] The fourth, fifth, and sixth storms spawned several tornadoes across California, with at least 6 tornadoes confirmed in California (including two EF1 tornadoes); the storms also spawned multiple waterspouts off the coast of California. [4] [11] The storms dumped record amounts of rain and snow in the Western United States, and also brought hurricane-force winds to the U.S. West Coast, causing flooding and wind damage, [12] [1] as well as triggering blackouts across California that cut the power to more than 1.3 million customers. [3] [4] The storms killed at least 10 people, and caused more than $66.879 million (2010 USD) in damages. [5] [6] [13] [14] [4]

Contents

Meteorological History

From January 14 to 15, 2010, six extratropical disturbances developed over the north Pacific, within a large trough of low pressure, from the waters south of the Aleutian Islands to the east coast of Japan. Strengthened by an atmospheric river, a powerful jet stream with winds reaching 230 mph (370 km/h), [7] and the most powerful El Niño event (the fourth-strongest one on record) since 1997–98, [8] [15] [16] the storms quickly developed while accelerating eastward. On the afternoon of January 16, the first storm reached the Pacific Northwest. [17] On the same day, a seventh, small cyclone developed to the northwest of the first storm, which looped northwestward into the Gulf of Alaska for a few days, [18] before dissipating on January 19. [19] The first storm moved ashore British Columbia on the afternoon of January 17, impacting the Pacific Northwest, before dissipating early on the next day, ending the first wave of storms. [20] [21]

Satellite image of the third storm (the second storm to affect California) near peak intensity, on January 18 January 2010 California El Nino Superstorm 2, on January 18.jpg
Satellite image of the third storm (the second storm to affect California) near peak intensity, on January 18

On the afternoon of January 17, the second storm, the first of five powerful storms to impact California, reached the West Coast of the United States, [20] [9] beginning a week of heavy rainfall and powerful gale-force winds. [3] [22] The storm was steered northeastward by a blocking ridge of high pressure over the Central United States, and made landfall on British Columbia on January 18, before dissipating late that day. [23] [24] As the second storm moved inland, the third storm arrived at the U.S. West Coast on January 18, [25] bombing out and reaching a peak intensity of 964 millibars (28.5 inHg) at 18:00 UTC (10:00 a.m. PST) that day. [2] Afterward, the third storm weakened and stalled of the coast of the Pacific Northwest while the fourth storm approached, which reached the U.S. West Coast on January 19. [26] [27] The fourth storm began a small tornado outbreak in California on January 19, which would last until January 21, [28] [29] and the fourth storm also spawned four waterspouts off the coast of Southern California. [12] On the afternoon of January 19, the National Weather Service issued two tornado warnings for San Diego County within hours of each other. [30] The third storm absorbed the fourth storm on January 20, restrengthening somewhat in the process. [31] [32] The third storm then moved into the Gulf of Alaska for another few days, before dissipating on January 23. [33] [34]

On January 20, the fifth storm, the fourth storm to affect California, reached the West Coast of the U.S., beginning the third and final wave of storms. [35] [36] The storm intensified as it neared the coast of Oregon, reaching a peak intensity of 970 millibars (29 inHg) as it approached the coast of Northern California. [37] The fifth storm then moved northward and weakened, [38] stalling over the northeast Pacific for another several days, before being absorbed into another approaching extratropical cyclone late on January 24. [39] [40]

Satellite image of the sixth storm (the fifth storm to affect California) at peak intensity on January 21, shortly before landfall January 2010 California El Nino Superstorm 5, on January 21.jpg
Satellite image of the sixth storm (the fifth storm to affect California) at peak intensity on January 21, shortly before landfall

On January 21, the sixth storm (the fifth and final storm to affect California) reached the West Coast of the U.S. [22] [41] The storm rapidly intensified as it approached California, reaching a peak intensity of 973 millibars (28.7 inHg) that afternoon, just prior to making landfall on California near San Francisco. [42] [43] This made the storm the most powerful winter storm to strike the Southwestern United States in 140 years. [1] The storm also tapped into the Pineapple Express, boosting the amount of moisture in the storm. [22] The storm broke low pressure records across California and Oregon as it moved inland, with a minimum pressure of 978 millibars (28.9 inHg) recorded in Eureka, California, and a minimum pressure of 987 millibars (29.1 inHg) recorded in San Diego County. [10] The storm also produced an EF0 tornado in Ventura, California, as well as numerous waterspouts across Southern California. [22] [29] The powerful winter storm weakened as it moved inland, but continued to affect California until January 23. The ridge of high pressure previously stationed over the Central U.S. had broken down by then, allowing the powerful storm to move eastward across the mainland United States, with the storm expanding in size as it moved eastward. [44] [45] The sixth storm reached the Eastern United States on January 24, bringing rain and snow to the region. [46] [42] Over the next couple of days, the storm moved northeastward into Eastern Canada, becoming elongated during that time, with the southern part of the storm splitting off into a new winter storm. [47] On January 27, the storm moved into the northern Hudson Bay and stalled, while gradually weakening. [48] On January 28, the sixth storm was absorbed into another frontal storm approaching from the southwest. [49]

Impact

California

From Sunday, January 17 to Saturday, January 23, 2010, a series of five very powerful winter storms bore down on Southern California, before moving eastward on January 22. [3] On January 18, 23,000 customers in Southern California lost power for a short time, due to the flooding caused by one of the storms. [3] On January 19, a woman was killed by a tree that fell on her home. [50] On January 19, the fourth storm impacted Southern California, bringing flooding and powerful winds to Santee in San Diego County. [51] On the afternoon of January 19, the National Weather Service issued two tornado warnings for San Diego County within hours of each other, as potentially tornadic thunderstorms crossed the area. [30]

As the fifth and second-strongest of the week's storms (impact-wise) slammed into California on January 20, officials predicted as much as four feet (1.2 meters) of snow would fall in Northern California. [52] [53] On the morning of January 20, more than 500 homes were evacuated as floods struck multiple regions in California, as up to 6 inches (15 centimeters) of rain fell in the storms that had impacted the state by that point. [12] [3] [42] Rescue and flood prevention services soon brought the situation under control, but one man was killed when a tree fell onto his house. [12] By then, flooding up to a feet deep had occurred in multiple areas, with Flash Flood Warnings remaining in effect for much of California. [54] A sinkhole also opened up at an intersection in Ventura, which was expected to take days to fill in. [55] Two horses also died after being hit by lighting in a Santa Barbara field. Rare tornado warnings were issued in parts of Southern California, including southern Los Angeles, Long Beach, San Diego County, and Anaheim. Flash flood watches covered Los Angeles, Santa Barbara, and Ventura Counties. [42] On January 20, an EF0 tornado was reported in Southeastern San Diego County, which lasted for 1 minute, 30 seconds. On the same day, residents in Siskiyou County in Northern California lost power for 30 hours, due to wet, heavy snow taking down power lines. [3] Jim Rouiller, the senior energy meteorologist at Planalytics Inc., said that the storms (particularly the sixth storm) were the worst series of storms the state had experienced since 1997 (when a series of powerful storms caused the New Year's Day 1997 Northern California Flood). [42] On January 21, the sixth storm broke the record of the lowest pressure recorded in parts of California, as the sixth storm registered a minimum barometric pressure of 978 millibars (28.9 inHg) in Eureka, California, breaking the previous record set in 1891; [3] the storm also registered a reading of 987 millibars (29.1 inHg) in San Diego County (the storm had a minimum central pressure of 973 millibars (28.7 inHg) while it was in the Pacific, at about this time). [10] [42] Rouiller expected that evening's storm to bring from 4 to 12 inches of rain, severe mudslides, a few tornadoes, and heavy mountain snow ranging from 6 to 15 feet across the Sierra Nevada mountain range. [42]

California state water officials warned on January 21 that one week of heavy rain and snow was not enough to end the drought, [52] [53] which was entering its fourth year by 2010, [52] [53] though the precipitation from the storms had significantly reduced the severity of the drought. [56] According to measurements on Thursday, January 21, the average water content of state's mountain ranges' snowpacks, considered the state's biggest de facto 'reservoir', was at 107% percent of normal capacity. [52] [53]

On January 22, the sixth storm caused heavy rainfall in parts of Los Angeles, leading to additional flooding. [57] [58] 500 people were evacuated from a small village in La Paz County, Arizona due to a flash flood. [57] Freshly-fallen snow blanketed the north side of the San Gabriel Mountains on the morning of January 23, 2010, northwest of Wrightwood, California, after the sixth storm had left. [57] [58] Snow was also reported in many parts of California. [57] During that week, the storms dropped 8 in (20 cm) to 10 in (25 cm) of rain in Los Angeles. [16] By the end of that week, the storms had cut the power to more than 1.3 million customers in Southern California, due to the powerful winds downing power lines. [4] The storms also left a mess of trash and debris on the beaches of Southern California. [59] On January 25, Mayor Liz Harris of the City of Big Bear Lake issued a state of emergency, due to the damage caused by the storm. [60]

In California, the storms dropped a maximum total of 20 inches (51 cm) of rain in the higher elevations of the Sierra Nevada, while a maximum total of 90 inches (230 cm) of snow was recorded at Mammoth Lakes. [3] The sixth storm brought sustained winds of 74 mph (119 km/h) to the Western U.S., equivalent to a low-end Category 1 hurricane, with wind gusts up to 94 mph (151 km/h) recorded in Ajo, Arizona. [1]

Elsewhere

In Arizona, the storms dropped a maximum total of 50.7 inches (129 cm) of snow at Flagstaff. In Yavapai County, floodwaters swept a child to his death. [3] Near Wikieup, the Big Sandy River crested at 17.9 feet (5.5 m), breaking the previous record of 16.4 feet (5.0 m) previously set in Match 1978. [3]

The sixth storm brought snow across the Great Plains, and even as far east as parts of both Pennsylvania and New Jersey. [42]

Overall, the storms killed at least 10 people across the United States, and caused more than $66.879 million in damages, including $3.2 million in agricultural losses. [4] [5] [6]

Tornadoes

EFUEF0EF1EF2EF3EF4EF5
0420000

The storm systems triggered an outbreak of weak tornadoes between Santa Barbara and San Diego Counties in Southern California on January 19, which continued into January 21. EF1 damage was reported in the Huntington Beach harbor area in Orange County, [11] and in Santa Barbara County, a local radio station reported that a sheriff's deputy had sighted a possible tornado, with roof damage near the Ocean Meadow Golf Course. [28] A third tornado was reported by the public in Orange County, with cars overturned on the Pacific Coast Highway and roof damage in the area. [61] Additional tornadoes and waterspouts were reported from another storm system on January 21, with damage reported in Blythe, California and Santa Barbara, California. [29] Overall, six tornadoes were confirmed, which caused at least $3.52 million in damage. [4] [11]

List of confirmed tornadoes – Monday, January 18, 2010 [note 1]
EF# LocationCounty / ParishStateStart Coord.Time (UTC)Path lengthMax widthDamage [note 2] SummaryRefs
EF0 West Fresno Fresno CA 36°44′N119°52′W / 36.73°N 119.86°W / 36.73; -119.86 (West Fresno (Jan. 18, EF0)) 2324 – 23300.53 mi (0.85 km)15 yd (14 m)$0A trained storm spotter observed a tornado north of California State Route 180; no damage was reported. [62]
EF0 Isla Vista Santa Barbara CA 34°25′29″N119°52′37″W / 34.4248°N 119.877°W / 34.4248; -119.877 (Isla Vista (Jan. 19, EF0)) 1832 – 18360.14 mi (0.23 km)10 yd (9.1 m)$0Law enforcement reported a small tornado; only minor damage was observed. [63]
EF1S of Seal Beach Orange CA 33°42′58″N118°07′30″W / 33.716°N 118.125°W / 33.716; -118.125 (Seal Beach (Jan. 19, EF1)) 2055 – 20594.62 mi (7.44 km)25 yd (23 m)$500,000A parked Ford Explorer was flipped on its side. Two catamarans were lifted out of the water; one was tossed 50 ft (15 m) into the air, subsequently landing on another vessel and dock piling, and the second was flipped over, landing 30 ft (9.1 m) from its original position. A window to a residential building was blown in and multiple reports of roof damage were relayed. A mesonet station on the Huntington Beach Pier recorded a 92 mph (148 km/h) wind gust. [64]
EF0 Ventura Ventura CA 34°15′06″N119°11′42″W / 34.2518°N 119.1949°W / 34.2518; -119.1949 (Ventura (Jan. 21, EF0)) 2025 – 20281.51 mi (2.43 km)67 yd (61 m)$0Several homes, a car, and an outbuilding were damaged. [65]
EF0WSW of Ripley to NNE of Blythe Riverside CA 33°30′38″N114°44′43″W / 33.5105°N 114.7453°W / 33.5105; -114.7453 (Ripley (Jan. 21, EF0)) 2310 – 234014.26 mi (22.95 km)100 yd (91 m)$3,000,000Two semi-trucks were blown over, numerous power poles were downed, and several structures sustained considerable damage, including some houses that had their roofs blown off. [66]
EF1SW of Brentwood Contra Costa CA 37°54′48″N121°45′57″W / 37.9132°N 121.7658°W / 37.9132; -121.7658 (Brentwood (Jan. 23, EF1)) 2054 – 20551.64 mi (2.64 km)2 yd (1.8 m)$25,000A utility pole was twisted, with the top portion of the pole splintered. [67]

See also

Notes

  1. All dates are based on the local time zone where the tornado touched down; however, all times are in Coordinated Universal Time for consistency.
  2. All damage totals are in 2010 USD unless otherwise stated.

Related Research Articles

<span class="mw-page-title-main">Weather Prediction Center</span> United States weather agency

The Weather Prediction Center (WPC), located in College Park, Maryland, is one of nine service centers under the umbrella of the National Centers for Environmental Prediction (NCEP), a part of the National Weather Service (NWS), which in turn is part of the National Oceanic and Atmospheric Administration (NOAA) of the U.S. Government. Until March 5, 2013 the Weather Prediction Center was known as the Hydrometeorological Prediction Center (HPC). The Weather Prediction Center serves as a center for quantitative precipitation forecasting, medium range forecasting, and the interpretation of numerical weather prediction computer models.

<span class="mw-page-title-main">January 2008 North American storm complex</span>

The January 2008 North American storm complex was a powerful Pacific extratropical cyclone that affected a large portion of North America, primarily stretching from western British Columbia to near the Tijuana, Mexico area, starting on January 3, 2008. The system was responsible for flooding rains across many areas in California along with very strong winds locally exceeding hurricane force strength as well as heavy mountain snows across the Cascade and Sierra Nevada mountain chains as well as those in Idaho, Utah and Colorado. The storms were responsible for the death of at least 12 people across three states, and extensive damage to utility services as well, as damage to some other structures. The storm was also responsible for most of the January 2008 tornado outbreak from January 7–8.

<span class="mw-page-title-main">October 2009 North American storm complex</span>

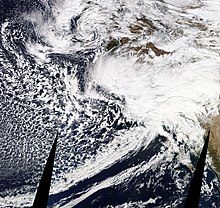
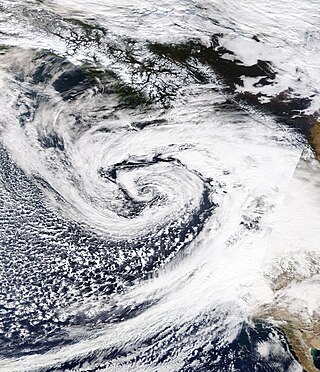
The October 2009 North American storm complex was a powerful extratropical cyclone that was associated with the remnants of Typhoon Melor, which brought extreme amounts of rainfall to California. The system started out as a weak area of low pressure, that formed in the northern Gulf of Alaska on October 7. Late on October 11, the system quickly absorbed Melor's remnant moisture, which resulted in the system strengthening significantly offshore, before moving southeastward to impact the West Coast of the United States, beginning very early on October 13. Around the same time, an atmospheric river opened up, channeling large amounts of moisture into the storm, resulting in heavy rainfall across California and other parts of the Western United States. The storm caused at least $8.861 million in damages across the West Coast of the United States.

<span class="mw-page-title-main">March 2014 North American winter storm</span> Winter storm in 2014

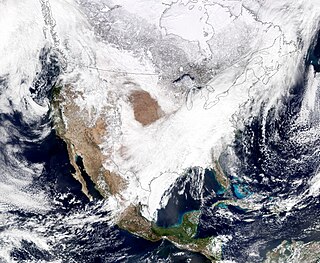
The March 2014 North American winter storm, also unofficially referred to as Winter Storm Titan, was an extremely powerful winter storm that affected much of the United States and portions of Canada. It was one of the most severe winter storms of the 2013–14 North American winter storm season, storm affecting most of the Western Seaboard, and various parts of the Eastern United States, bringing damaging winds, flash floods, and blizzard and icy conditions.

<span class="mw-page-title-main">2013–14 North American winter</span>

The 2013–14 North American winter was one of the most significant for the United States, due in part to the breakdown of the polar vortex in November 2013, which allowed very cold air to travel down into the United States, leading to an extended period of very cold temperatures. The pattern continued mostly uninterrupted throughout the winter and numerous significant winter storms affected the Eastern United States, with the most notable one being a powerful winter storm that dumped ice and snow in the Southeastern United States and the Northeastern United States in mid-February. Most of the cold weather abated by the end of March, though a few winter storms did affect the Western United States towards the end of the winter.

<span class="mw-page-title-main">December 2014 North American storm complex</span> Winter storm

The December 2014 North American storm complex was a powerful winter storm that impacted the West Coast of the United States, beginning on the night of December 10, 2014, resulting in snow, wind, and flood watches. Fueled by the Pineapple Express, an atmospheric river originating in the tropical waters of the Pacific Ocean adjacent to the Hawaiian Islands, the storm was the strongest to affect California since January 2010. The system was also the single most intense storm to impact the West Coast, in terms of minimum low pressure, since a powerful winter storm in January 2008. The National Weather Service classified the storm as a significant threat, and issued 15 warnings and advisories, including a Blizzard Warning for the Northern Sierra Nevada.

<span class="mw-page-title-main">2011–12 North American winter</span>

The 2011–12 North American winter by and large saw above normal average temperatures across North America, with the Contiguous United States encountering its fourth-warmest winter on record, along with an unusually low number of significant winter precipitation events. The primary outlier was Alaska, parts of which experienced their coldest January on record.

<span class="mw-page-title-main">2010–11 North American winter</span>

The 2010–11 North American winter was influenced by an ongoing La Niña, seeing winter storms and very cold temperatures affect a large portion of the Continental United States, even as far south as the Texas Panhandle. Notable events included a major blizzard that struck the Northeastern United States in late December with up to 2 feet (24 in) of snowfall and a significant tornado outbreak on New Year's Eve in the Southern United States. By far the most notable event was a historic blizzard that impacted areas from Oklahoma to Michigan in early February. The blizzard broke numerous snowfall records, and was one of the few winter storms to rank as a Category 5 on the Regional Snowfall Index. In addition, Oklahoma set a statewide low temperature record in February.

<span class="mw-page-title-main">2016–17 North American winter</span>

The 2016–17 North American winter was quite warm across North America in general, due in part to a weak La Niña that was expected to influence weather conditions across the continent. Several notable events occurred during the season, including a potent winter storm that affected the East Coast of the United States in early January, the second-largest winter tornado outbreak on record later that month, and an unusually warm February. In addition, towards the end of the season, a large cyclonic storm system that caused a large tornado outbreak, flooding, and a potent blizzard occurred in the Heartland of the country. However, the most notable event of the winter was a powerful blizzard that impacted the Northeast and New England in mid-March, towards the end of the season.

<span class="mw-page-title-main">January 2017 North American ice storm</span>

The January 2017 North American ice storm was a major ice storm that impacted the Great Plains, Pacific Northwest, and American Midwest. During the storm, multiple U.S. states declared states of emergency, and icy road conditions caused traffic incidents and fatalities. It was Named Winter Storm Jupiter by the weather channel. An outbreak of 11 tornadoes also struck Texas, injuring two.

<span class="mw-page-title-main">Hurricane Genevieve (2020)</span> Category 4 Pacific hurricane in 2020

Hurricane Genevieve was a strong tropical cyclone that almost made landfall on the Baja California Peninsula in August 2020. Genevieve was the twelfth tropical cyclone, eighth named storm, third hurricane, and second major hurricane of the 2020 Pacific hurricane season. The cyclone formed from a tropical wave that the National Hurricane Center (NHC) first started monitoring on August 10. The wave merged with a trough of low pressure on August 13, and favorable conditions allowed the wave to intensify into Tropical Depression Twelve-E at 15:00 UTC. Just six hours later, the depression became a tropical storm and was given the name Genevieve. Genevieve quickly became a hurricane by August 17, and Genevieve began explosive intensification the next day. By 12:00 UTC on August 18, Genevieve reached its peak intensity as a Category 4 hurricane, with maximum 1-minute sustained winds of 130 mph and a minimum central pressure of 950 millibars (28 inHg). Genevieve began to weaken on the next day, possibly due to cooler waters caused by Hurricane Elida earlier that month. Genevieve weakened below tropical storm status around 18:00 UTC on August 20, as it passed close to Baja California Sur. Soon afterward, Genevieve began to lose its deep convection and became a post-tropical cyclone by 21:00 UTC on August 21, eventually dissipating off the coast of Southern California late on August 24.

<span class="mw-page-title-main">November 2020 North American storm complex</span>

The November 2020 North American storm complex was a major early-season snowstorm that impacted most of the Ohio Valley from November 30–December 2 with heavy snow, gusty winds, and near-whiteout conditions. The system originated from a weak gulf low off the coast of Texas on November 29, which began to move northeastward onto land the next day. It then began to strengthen, as well as slowing its movement down, resulting in heavy, wind-driven snow for prolonged periods of time in the Ohio Valley. It also triggered a major lake-effect snow event from December 1–2 as the system stalled over Lake Ontario, resulting in additional heavy snowfall. The storm system was also responsible for a severe thunderstorm outbreak in the Southeast and Mid-Atlantic regions, causing 22 severe thunderstorms and 5 tornadoes. In total, the system is estimated to have caused at least $100 million in damages. It was unofficially named Winter Storm Dane by The Weather Channel.

<span class="mw-page-title-main">December 5–6, 2020 nor'easter</span> North American noreaster in 2020

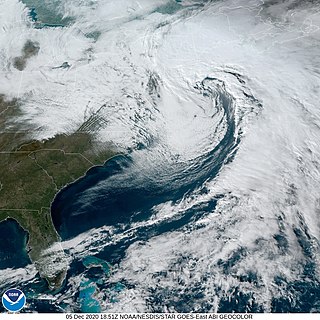
The December 5–6, 2020 nor'easter brought heavy snowfall, hurricane-force wind gusts, blizzard conditions, and coastal flooding to much of New England in the first few days of December 2020. The system originated on the Mid-Atlantic coast late on December 4. It then moved up the East Coast of the United States from December 5–6, bombing out and bringing heavy wet snow to the New England states. It brought up to 18 inches (46 cm) of snow in northern New England, with widespread totals of 6–12 inches (15–30 cm) farther south.

<span class="mw-page-title-main">January 31 – February 3, 2021 nor'easter</span>

The January 31 – February 3, 2021 nor'easter, also known as the 2021 Groundhog Day nor'easter, was a powerful, severe, and erratic nor'easter that impacted much of the Northeastern United States and Eastern Canada from February 1–3 with heavy snowfall, blizzard conditions, strong gusty winds, storm surge, and coastal flooding. The storm first developed as an extratropical cyclone off the West Coast of the United States on January 25, with the storm sending a powerful atmospheric river into West Coast states such as California, where very heavy rainfall, snowfall, and strong wind gusts were recorded, causing several hundred thousand power outages and numerous mudslides. The system moved ashore several days later, moving into the Midwest and dropping several inches of snow across the region. On February 1, the system developed into a nor'easter off the coast of the Northeastern U.S., bringing prolific amounts of snowfall to the region. Large metropolitan areas such as Boston and New York City saw as much as 18–24 inches (46–61 cm) of snow accumulations from January 31 to February 2, making it the worst snowstorm to affect the megalopolis since the January 2016 blizzard. It was given the unofficial name Winter Storm Orlena by The Weather Channel.

<span class="mw-page-title-main">February 13–17, 2021 North American winter storm</span> Category 3 winter storm and ice storm in the United States

The February 13–17, 2021 North American winter storm was a crippling, large and major winter and ice storm that had widespread impacts across the United States, Northern Mexico, and parts of Canada from February 13 to 17, 2021. The storm, unofficially referred to as Winter Storm Uri by the Weather Channel, started out in the Pacific Northwest and quickly moved into the Southern United States, before moving on to the Midwestern and Northeastern United States a couple of days later.

<span class="mw-page-title-main">February 15–20, 2021 North American winter storm</span> Category 3 winter storm and ice storm in the United States

The February 15–20, 2021 North American winter storm, also unofficially referred to as Winter Storm Viola, was a significant and widespread snow and ice storm across much of the United States, Northern Mexico, and Southern Canada. The system started out as a winter storm on the West Coast of the United States on February 15, later moving southeast into the Southern Plains and Deep South from February 16–17. It then moved into the Appalachian Mountains and Northeastern United States, before finally moving out to sea on February 20. The storm subsequently became a powerful low pressure system over the North Atlantic, before eventually dissipating on February 26.

<span class="mw-page-title-main">March 2021 North American blizzard</span> Winter storm and tornado outbreak in 2021

The March 2021 North American blizzard was a record-breaking blizzard in the Rocky Mountains and a significant snowstorm in the Upper Midwest that occurred in mid-March 2021. It brought Cheyenne, Wyoming their largest two-day snowfall on record, and Denver, Colorado their second-largest March snowfall on record. The storm originated from an extratropical cyclone in the northern Pacific Ocean in early March, arriving on the west coast of the United States by March 10. The storm moved into the Rocky Mountains on Saturday, March 13, dumping up to 2–3 feet (24–36 in) of snow in some areas. It was unofficially given the name Winter Storm Xylia.

<span class="mw-page-title-main">April 2021 nor'easter</span> Slow-moving noreaster in April 2021

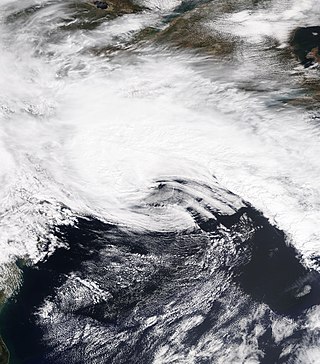
The April 2021 nor'easter, also referred to as the 2021 Spring nor'easter, was a significant late-season nor'easter that impacted much of New England with heavy snowfall, gusty winds, thundersnow, and near-whiteout conditions from April 15–17, 2021. The system originated from a weak frontal system late on April 14 over North Carolina, which moved into the ocean the next day and began to strengthen. The low-pressure steadily deepened as it moved up the East Coast, and developed an eye-like feature just prior to peak intensity. It prompted a fairly large area of Winter Storm Warnings across interior sections of New England, with Winter Weather Advisories being issued closer to the coast. Over 20,000 customers lost power at the height of the storm on April 16 due to heavy wet snow, and near-whiteout conditions were reported in many areas. Several injuries, some serious, occurred as well, mostly due to traffic incidents on poorly-treated roadways during the storm. Damage estimates from the system are currently not calculated.

<span class="mw-page-title-main">2021–22 North American winter</span> Winter season in North America

The 2021–22 North American winter was not as significant and record-breaking as the previous winter season. Despite this, several notable and significant events still occurred, including two separate record-breaking tornado outbreaks in mid-December, a significant winter storm in the South in mid-January, a powerful blizzard that impacted the Northeast coast at the end of January and a wide-ranging, significant winter storm that affected most of the eastern half of the country in early February. Additional significant events included a late-season winter storm in March that affected the Appalachian Mountains, and a major blizzard that affected North and South Dakota in mid-April. Additionally, a very late out-of-season snowstorm struck the Rocky Mountains in late May. During the season, four storms have been ranked on the Regional Snowfall Index (RSI), although none attained the “Major” category. Similar to the previous winter, a developing La Niña was expected to influence weather patterns across the continent.

<span class="mw-page-title-main">October 2021 Northeast Pacific bomb cyclone</span> North American bomb cyclone in 2021

An extremely powerful extratropical bomb cyclone began in late October 2021 in the Northeast Pacific and struck the Western United States and Western Canada. The storm was the third and the most powerful cyclone in a series of powerful storms that struck the region within a week. The cyclone tapped into a large atmospheric river and underwent explosive intensification, becoming a bomb cyclone on October 24. The bomb cyclone had a minimum central pressure of 942 millibars (27.8 inHg) at its peak, making it the most powerful cyclone recorded in the Northeast Pacific. The system had severe impacts across Western North America, before dissipating on October 26. The storm shattered multiple pressure records across parts of the Pacific Northwest. Additionally, the bomb cyclone was the most powerful storm on record to strike the region, in terms of minimum central pressure. The bomb cyclone brought powerful gale-force winds and flooding to portions of Western North America. At its height, the storm cut the power to over 370,500 customers across the Western U.S. and British Columbia. The storm killed at least two people; damage from the storm was estimated at several hundred million dollars. The bomb cyclone was compared to the Columbus Day Storm of 1962, in terms of ferocity.

References

  1. 1 2 3 4 5 6 Jeff Masters (January 22, 2010). "Strongest winter storm in at least 140 years whallops Southwest U.S." Weather Underground. Retrieved June 11, 2019.
  2. 1 2 "WPC surface analysis valid for 01/18/2010 at 18 UTC". NOAA's National Weather Service. January 18, 2010. Retrieved June 11, 2019.
  3. 1 2 3 4 5 6 7 8 9 10 11 12 13 "National Climate Report - January 2010". NOAA. February 2010. Retrieved June 11, 2019.
  4. 1 2 3 4 5 6 7 8 "January 2010 Monthly Cat Recap - Impact Forecasting" (PDF). Aon Benfield. February 10, 2010. p. 2. Retrieved June 11, 2019.
  5. 1 2 3 Storm Events Database: California: 201 events were reported between 01/17/2010 and 01/24/2010 (8 days). ncdc.noaa.gov (Report). NCEI. January 2010. Retrieved October 27, 2021.
  6. 1 2 3 Storm Events Database: 84 events were reported between 01/17/2010 and 01/24/2010 (8 days). ncdc.noaa.gov (Report). NCEI. January 2010. Retrieved October 28, 2021.
  7. 1 2 Nils (January 15, 2010). "Storms are coming..." owcnblog.wordpress.com. Oiled Wildlife Care Network. Archived from the original on June 20, 2020. Retrieved January 18, 2021.
  8. 1 2 Ed Joyce (January 20, 2010). "It's Official: El Niño For California In 2010". KPBS. Retrieved June 11, 2019.
  9. 1 2 "Four Storm Systems in Place to Soak Region This Week". WeatherCurrents. January 17, 2010. Retrieved June 12, 2019.
  10. 1 2 3 Steve Scolnik (January 21, 2010). "Strong Pacific Coast Storm Breaks Rainfall, Low Pressure Records". CapitalClimate. Retrieved June 11, 2019.
  11. 1 2 3 Jordan Root (January 20, 2010). "Rare Mesocyclone/Tornado Hits Southern California" . Retrieved June 11, 2019.
  12. 1 2 3 4 "Latest storm brings traffic nightmare, more flooding to L.A. [Updated]". Los Angeles Times. January 20, 2010. Retrieved June 11, 2019.
  13. Storm Events Database: Oregon: 17 events were reported between 01/17/2010 and 01/24/2010 (8 days). ncdc.noaa.gov (Report). NCEI. January 2010. Retrieved October 27, 2021.
  14. Storm Events Database: Washington: 13 events were reported between 01/17/2010 and 01/24/2010 (8 days). ncdc.noaa.gov (Report). NCEI. January 2010. Retrieved October 27, 2021.
  15. Christopher Joyce (February 5, 2010). "Behind The Weather: Strongest El Nino In A Decade". Npr. Retrieved June 11, 2019.
  16. 1 2 Peter N. Spotts (January 22, 2010). "El Nino packs a punch far beyond soggy California". The Christian Science Monitor. Retrieved June 11, 2019.
  17. "WPC surface analysis valid for 01/16/2010 at 21 UTC". NOAA's National Weather Service. January 16, 2010. Retrieved June 11, 2019.
  18. "WPC surface analysis valid for 01/17/2010 at 09 UTC". NOAA's National Weather Service. January 17, 2010. Retrieved June 11, 2019.
  19. "WPC surface analysis valid for 01/19/2010 at 21 UTC". NOAA's National Weather Service. January 19, 2010. Retrieved June 11, 2019.
  20. 1 2 "WPC surface analysis valid for 01/17/2010 at 21 UTC". NOAA's National Weather Service. January 17, 2010. Retrieved June 11, 2019.
  21. "WPC surface analysis valid for 01/18/2010 at 03 UTC". NOAA's National Weather Service. January 18, 2010. Retrieved June 11, 2019.
  22. 1 2 3 4 "Thunderstorms, Damaging Winds, Record Low Pressure, Heavy Rain and Snow Accompany Final System of Series". sierraphotography.com. Southern California Weather Notes. January 29, 2010. Retrieved June 11, 2019.
  23. "WPC surface analysis valid for 01/18/2010 at 12 UTC". NOAA's National Weather Service. January 18, 2010. Retrieved June 11, 2019.
  24. "WPC surface analysis valid for 01/19/2010 at 00 UTC". NOAA's National Weather Service. January 19, 2010. Retrieved June 11, 2019.
  25. "First Storm of Series in the Books. Second Storm Forecast to Slam Southland Today". sierraphotography.com. Southern California Weather Notes. January 18, 2010. Retrieved June 12, 2019.
  26. "WPC surface analysis valid for 01/19/2010 at 09 UTC". NOAA's National Weather Service. January 19, 2010. Retrieved June 11, 2019.
  27. "Too Many Southern California Storms to Count?". sierraphotography.com. Southern California Weather Notes. January 19, 2010. Retrieved June 12, 2019.
  28. 1 2 Storm Prediction Center (January 19, 2010). "Storm Reports". Storm Prediction Center. Retrieved January 19, 2010.
  29. 1 2 3 Storm Prediction Center (January 21, 2010). "Storm Reports 100121". Storm Prediction Center. Retrieved January 22, 2010.
  30. 1 2 R. Stickney (January 22, 2010). "Tornado Warnings Expire". NBC 7 San Diego. Retrieved June 11, 2019.
  31. "WPC surface analysis valid for 01/19/2010 at 21 UTC". NOAA's National Weather Service. January 19, 2010. Retrieved June 11, 2019.
  32. "WPC surface analysis valid for 01/20/2010 at 06 UTC". NOAA's National Weather Service. January 20, 2010. Retrieved June 11, 2019.
  33. "WPC surface analysis valid for 01/21/2010 at 06 UTC". NOAA's National Weather Service. January 21, 2010. Retrieved June 11, 2019.
  34. "WPC surface analysis valid for 01/23/2010 at 15 UTC". NOAA's National Weather Service. January 23, 2010. Retrieved June 11, 2019.
  35. "One-Two Punch the Finale for an Extraordinary Series of Storms". sierraphotography.com. Southern California Weather Notes. January 20, 2010. Retrieved June 12, 2019.
  36. "WPC surface analysis valid for 01/20/2010 at 12 UTC". NOAA's National Weather Service. January 20, 2010. Retrieved June 11, 2019.
  37. "WPC surface analysis valid for 01/20/2010 at 15 UTC". NOAA's National Weather Service. January 20, 2010. Retrieved June 11, 2019.
  38. "WPC surface analysis valid for 01/21/2010 at 18 UTC". NOAA's National Weather Service. January 21, 2010. Retrieved June 11, 2019.
  39. "WPC surface analysis valid for 01/24/2010 at 09 UTC". NOAA's National Weather Service. January 24, 2010. Retrieved June 11, 2019.
  40. "WPC surface analysis valid for 01/25/2010 at 00 UTC". NOAA's National Weather Service. January 25, 2010. Retrieved June 11, 2019.
  41. "WPC surface analysis valid for 01/21/2010 at 12 UTC". NOAA's National Weather Service. January 21, 2010. Retrieved June 11, 2019.
  42. 1 2 3 4 5 6 7 8 "California Storms to Head East, Bringing Rain, Snow (Update2)". BusinessWeek. January 19, 2010. Archived from the original on January 23, 2010. Retrieved February 26, 2010.
  43. "WPC surface analysis valid for 01/21/2010 at 21 UTC". NOAA's National Weather Service. January 21, 2010. Retrieved June 11, 2019.
  44. "WPC surface analysis valid for 01/22/2010 at 06 UTC". NOAA's National Weather Service. January 22, 2010. Retrieved June 11, 2019.
  45. "WPC surface analysis valid for 01/23/2010 at 09 UTC". NOAA's National Weather Service. January 23, 2010. Retrieved June 11, 2019.
  46. "WPC surface analysis valid for 01/24/2010 at 21 UTC". NOAA's National Weather Service. January 24, 2010. Retrieved June 11, 2019.
  47. "WPC surface analysis valid for 01/26/2010 at 09 UTC". NOAA's National Weather Service. January 26, 2010. Retrieved June 11, 2019.
  48. "WPC surface analysis valid for 01/27/2010 at 09 UTC". NOAA's National Weather Service. January 27, 2010. Retrieved June 11, 2019.
  49. "WPC surface analysis valid for 01/28/2010 at 06 UTC". NOAA's National Weather Service. January 28, 2010. Retrieved June 11, 2019.
  50. R. Stickney (January 22, 2010). "Woman Crushed by Falling Tree". NBC 7 San Diego. Retrieved June 11, 2019.
  51. "Santee, California Rainstorm 1/19/2010 - AOL Video". Video.aol.co.uk. January 19, 2010. Retrieved February 26, 2010.
  52. 1 2 3 4 Whitcomb, Dan (January 21, 2010). "Storms bring badly needed snow, rain to California". Reuters. Retrieved February 26, 2010.
  53. 1 2 3 4 Storms bring badly-needed rain [ dead link ]
  54. Jonathan Lloyd (January 21, 2010). "City-By-City Storm Roundup". NBC Los Angeles. Retrieved June 11, 2019.
  55. Gordon Tokumatsu (January 20, 2010). "Ventura Sinkhole Could Take Days to Repair". NBC Los Angeles. Retrieved June 11, 2019.
  56. D. Miskus (February 3, 2010). "California Monthly Climate Summary - January 2010" (PDF). U.S. Drought Monitor. Retrieved June 11, 2019.
  57. 1 2 3 4 "Storms trash California beaches, bring snow". En.apa.az. January 24, 2010. Archived from the original on March 11, 2012. Retrieved January 18, 2021.
  58. 1 2 "January 24, 2010 gallery - Severe Rain Storms Continue To Threaten The Los Angeles Area". Talktalk.co.uk. Retrieved February 26, 2010.
  59. "Storms leave California beaches a mess". NBC News. January 24, 2010. Retrieved June 11, 2019.
  60. Catherine Sandstrom (January 26, 2010). ""We Got Mail!" Roads Re-Opened and Food, Fuel, Mail Arrive in the Big Bear Valley; Schools on Fourth Snow Day". kbhr933.com. Big Bear News. Retrieved June 11, 2019.
  61. Iowa Environmental Mesonet (January 19, 2010). "Local Storm Reports". Iowa Environmental Mesonet Local Storm Reports. Retrieved January 19, 2010.
  62. National Weather Service Weather Forecast Office in Hanford, California (2010). California Event Report: EF0 Tornado (Report). National Climatic Data Center. Retrieved May 1, 2015.
  63. National Weather Service Weather Forecast Office in Los Angeles, California (2010). California Event Report: EF0 Tornado (Report). National Climatic Data Center. Retrieved May 1, 2015.
  64. National Weather Service Weather Forecast Office in San Diego, California (2010). California Event Report: EF1 Tornado (Report). National Climatic Data Center. Retrieved May 1, 2015.
  65. National Weather Service Weather Forecast Office in Los Angeles, California (2010). California Event Report: EF0 Tornado (Report). National Climatic Data Center. Retrieved May 3, 2015.
  66. National Weather Service Weather Forecast Office in Phoenix, Arizona (2010). California Event Report: EF0 Tornado (Report). National Climatic Data Center. Retrieved May 3, 2015.
  67. National Weather Service Weather Forecast Office in San Francisco, California (2010). California Event Report: EF1 Tornado (Report). National Climatic Data Center. Retrieved May 1, 2015.