| ||||||||||||||||||||||||||
| ||||||||||||||||||||||||||
All 8 Washington votes to the Electoral College | ||||||||||||||||||||||||||
---|---|---|---|---|---|---|---|---|---|---|---|---|---|---|---|---|---|---|---|---|---|---|---|---|---|---|
| ||||||||||||||||||||||||||
County Results Roosevelt 40-50% 50-60% 60-70% 70-80% 80-90% | ||||||||||||||||||||||||||
|
Elections in Washington |
---|
The 1936 United States presidential election in Washington took place on November 3, 1936, as part of the 1936 United States presidential election. Voters chose eight [2] representatives, or electors, to the Electoral College, who voted for president and vice president.
Washington was won by incumbent President Franklin D. Roosevelt (D–New York), running with Vice President John Nance Garner, with 66.38% of the popular vote, against Governor Alf Landon (R–Kansas), running with Frank Knox, with 29.88% of the popular vote. [3] [4]
Roosevelt's 66.38 percent result is the best ever achieved by a Democratic presidential candidate in Washington state. As of the 2020 presidential election [update] , this is the last election in which Adams County voted for a Democratic presidential candidate. [5] This would also prove the last time Whitman County voted for a Democratic presidential candidate until Bill Clinton in 1992, as well as the last time a presidential candidate won every single county in the state.
Party | Candidate | Votes | % | |
---|---|---|---|---|
Democratic | Franklin D. Roosevelt (inc.) | 459,579 | 66.38% | |
Republican | Alf Landon | 206,892 | 29.88% | |
Union | William Lemke | 17,463 | 2.52% | |
Socialist | Norman Thomas | 3,496 | 0.50% | |
Communist | Earl Browder | 1,907 | 0.28% | |
Christian | William Pelley | 1,598 | 0.23% | |
Prohibition | D. Leigh Colvin | 1,041 | 0.15% | |
Socialist Labor | John Aiken | 362 | 0.05% | |
Total votes | 692,338 | 100% |
County | Franklin Delano Roosevelt Democratic | Alfred Mossman Landon Republican | William Frederick Lemke Union | Various candidates Other parties | Margin | Total votes cast [6] | |||||
---|---|---|---|---|---|---|---|---|---|---|---|
# | % | # | % | # | % | # | % | # | % | ||
Adams | 1,944 | 73.06% | 657 | 24.69% | 54 | 2.03% | 6 | 0.23% | 1,287 | 48.37% | 2,661 |
Asotin | 2,261 | 65.67% | 916 | 26.60% | 235 | 6.83% | 31 | 0.90% | 1,345 | 39.06% | 3,443 |
Benton | 2,402 | 53.06% | 1,610 | 35.56% | 497 | 10.98% | 18 | 0.40% | 792 | 17.50% | 4,527 |
Chelan | 8,030 | 59.54% | 4,975 | 36.89% | 401 | 2.97% | 80 | 0.59% | 3,055 | 22.65% | 13,486 |
Clallam | 5,586 | 66.36% | 2,404 | 28.56% | 360 | 4.28% | 68 | 0.81% | 3,182 | 37.80% | 8,418 |
Clark | 12,714 | 68.52% | 4,868 | 26.24% | 795 | 4.28% | 177 | 0.95% | 7,846 | 42.29% | 18,554 |
Columbia | 1,391 | 57.67% | 807 | 33.46% | 193 | 8.00% | 21 | 0.87% | 584 | 24.21% | 2,412 |
Cowlitz | 10,147 | 71.00% | 3,617 | 25.31% | 463 | 3.24% | 65 | 0.45% | 6,530 | 45.69% | 14,292 |
Douglas | 2,290 | 66.47% | 1,025 | 29.75% | 101 | 2.93% | 29 | 0.84% | 1,265 | 36.72% | 3,445 |
Ferry | 1,130 | 74.54% | 320 | 21.11% | 59 | 3.89% | 7 | 0.46% | 810 | 53.43% | 1,516 |
Franklin | 1,784 | 68.77% | 622 | 23.98% | 158 | 6.09% | 30 | 1.16% | 1,162 | 44.80% | 2,594 |
Garfield | 983 | 58.55% | 652 | 38.83% | 28 | 1.67% | 16 | 0.95% | 331 | 19.71% | 1,679 |
Grant | 4,560 | 85.59% | 694 | 13.03% | 57 | 1.07% | 17 | 0.32% | 3,866 | 72.56% | 5,328 |
Grays Harbor | 15,851 | 73.31% | 5,053 | 23.37% | 576 | 2.66% | 142 | 0.66% | 10,798 | 49.94% | 21,622 |
Island | 1,687 | 59.97% | 921 | 32.74% | 129 | 4.59% | 76 | 2.70% | 766 | 27.23% | 2,813 |
Jefferson | 2,279 | 66.54% | 1,063 | 31.04% | 59 | 1.72% | 24 | 0.70% | 1,216 | 35.50% | 3,425 |
King | 138,597 | 65.98% | 66,544 | 31.68% | 1,857 | 0.88% | 3,047 | 1.45% | 72,053 | 34.30% | 210,045 |
Kitsap | 12,414 | 75.94% | 3,440 | 21.04% | 242 | 1.48% | 251 | 1.54% | 8,974 | 54.90% | 16,347 |
Kittitas | 5,044 | 69.88% | 1,941 | 26.89% | 195 | 2.70% | 38 | 0.53% | 3,103 | 42.99% | 7,218 |
Klickitat | 2,545 | 65.29% | 1,190 | 30.53% | 136 | 3.49% | 27 | 0.69% | 1,355 | 34.76% | 3,898 |
Lewis | 9,619 | 57.58% | 5,885 | 35.23% | 932 | 5.58% | 269 | 1.61% | 3,734 | 22.35% | 16,705 |
Lincoln | 3,627 | 71.55% | 1,325 | 26.14% | 107 | 2.11% | 10 | 0.20% | 2,302 | 45.41% | 5,069 |
Mason | 3,087 | 70.19% | 1,015 | 23.08% | 250 | 5.68% | 46 | 1.05% | 2,072 | 47.11% | 4,398 |
Okanogan | 5,622 | 64.87% | 2,367 | 27.31% | 639 | 7.37% | 39 | 0.45% | 3,255 | 37.56% | 8,667 |
Pacific | 4,395 | 68.17% | 1,732 | 26.87% | 264 | 4.09% | 56 | 0.87% | 2,663 | 41.31% | 6,447 |
Pend Oreille | 1,903 | 66.19% | 813 | 28.28% | 133 | 4.63% | 26 | 0.90% | 1,090 | 37.91% | 2,875 |
Pierce | 48,988 | 70.09% | 18,331 | 26.23% | 1,433 | 2.05% | 1,139 | 1.63% | 30,657 | 43.86% | 69,891 |
San Juan | 775 | 48.59% | 690 | 43.26% | 117 | 7.34% | 13 | 0.82% | 85 | 5.33% | 1,595 |
Skagit | 9,639 | 61.73% | 5,222 | 33.44% | 538 | 3.45% | 216 | 1.38% | 4,417 | 28.29% | 15,615 |
Skamania | 1,863 | 80.65% | 406 | 17.58% | 26 | 1.13% | 15 | 0.65% | 1,457 | 63.07% | 2,310 |
Snohomish | 25,081 | 70.51% | 8,882 | 24.97% | 1,041 | 2.93% | 565 | 1.59% | 16,199 | 45.54% | 35,569 |
Spokane | 48,117 | 68.62% | 19,951 | 28.45% | 1,310 | 1.87% | 747 | 1.07% | 28,166 | 40.17% | 70,125 |
Stevens | 4,536 | 65.41% | 1,981 | 28.57% | 352 | 5.08% | 66 | 0.95% | 2,555 | 36.84% | 6,935 |
Thurston | 10,647 | 67.49% | 4,425 | 28.05% | 539 | 3.42% | 164 | 1.04% | 6,222 | 39.44% | 15,775 |
Wahkiakum | 1,098 | 69.36% | 419 | 26.47% | 52 | 3.28% | 14 | 0.88% | 679 | 42.89% | 1,583 |
Walla Walla | 6,562 | 56.23% | 4,584 | 39.28% | 487 | 4.17% | 37 | 0.32% | 1,978 | 16.95% | 11,670 |
Whatcom | 15,428 | 59.90% | 9,035 | 35.08% | 796 | 3.09% | 497 | 1.93% | 6,393 | 24.82% | 25,756 |
Whitman | 7,753 | 64.75% | 3,955 | 33.03% | 182 | 1.52% | 83 | 0.69% | 3,798 | 31.72% | 11,973 |
Yakima | 17,200 | 54.33% | 12,555 | 39.66% | 1,670 | 5.28% | 232 | 0.73% | 4,645 | 14.67% | 31,657 |
Totals | 459,579 | 66.38% | 206,892 | 29.88% | 17,463 | 2.52% | 8,404 | 1.21% | 252,687 | 36.50% | 692,338 |
The 1936 United States presidential election in Pennsylvania took place on November 3, 1936 as part of the 1936 United States presidential election. Voters chose 36 representatives, or electors to the Electoral College, who voted for president and vice president.
The 1996 United States presidential election in Iowa took place on November 5, 1996, as part of the 1996 United States presidential election. Voters chose seven representatives, or electors to the Electoral College, who voted for president and vice president.
The 1912 United States presidential election in Maine took place on November 5, 1912, as part of the 1912 United States presidential election which was held throughout all contemporary 48 states. Voters chose six representatives, or electors to the Electoral College, who voted for president and vice president. Maine was won by the Democratic nominees, New Jersey Governor Woodrow Wilson and Indiana Governor Thomas R. Marshall. Wilson and Marshall defeated incumbent President William Howard Taft, and his running mate Vice President James S. Sherman and Progressive Party candidates, former President Theodore Roosevelt and his running mate California Governor Hiram Johnson.
The 1936 United States presidential election in Maine was held on November 3, 1936 as part of the 1936 United States presidential election. The state voters chose five electors to the Electoral College, who voted for president and vice president.
The 1964 United States presidential election in Nebraska took place on November 3, 1964, as part of the 1964 United States presidential election. Voters chose five representatives, or electors, to the Electoral College, who voted for president and vice president.
The 1912 United States presidential election in Maryland took place on November 5, 1912, as part of the 1912 United States presidential election. State voters chose eight representatives, or electors, to the Electoral College, who voted for president and vice president.
The 1936 United States presidential election in Wyoming took place on November 3, 1936, as part of the 1936 United States presidential election. State voters chose three representatives, or electors, to the Electoral College, who voted for president and vice president.
The 1940 United States presidential election in Wyoming took place on November 5, 1940, as part of the 1940 United States presidential election. State voters chose three representatives, or electors, to the Electoral College, who voted for president and vice president.
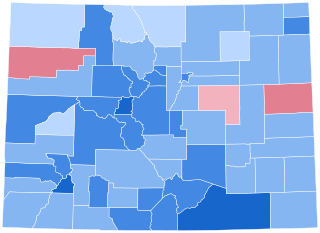
The 1936 United States presidential election in Colorado took place on November 3, 1936, as part of the 1936 United States presidential election. Voters chose six representatives, or electors to the Electoral College, who voted for president and vice president.
The 1936 United States presidential election in West Virginia took place on November 3, 1936, as part of the 1936 United States presidential election. West Virginia voters chose eight representatives, or electors, to the Electoral College, who voted for president and vice president.
The 1936 United States presidential election in Oregon took place on November 3, 1936, as part of the 1936 United States presidential election. Voters chose five representatives, or electors, to the Electoral College, who voted for president and vice president.
The 1936 United States presidential election in Oklahoma took place on November 3, 1936, as part of the 1936 United States presidential election. Voters chose 11 representatives, or electors, to the Electoral College, who voted for president and vice president.
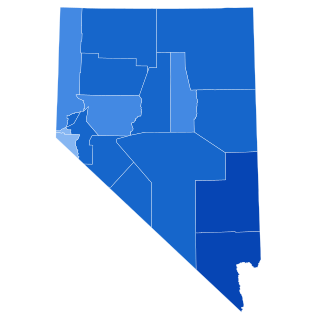
The 1936 United States presidential election in Nevada took place on November 3, 1936, as part of the 1936 United States presidential election. State voters chose three representatives, or electors, to the Electoral College, who voted for president and vice president.
The 1936 United States presidential election in Nebraska took place on November 3, 1936, as part of the 1936 United States presidential election. Voters chose seven representatives, or electors, to the Electoral College, who voted for president and vice president.
The 1936 United States presidential election in Illinois took place on November 3, 1936, as part of the 1936 United States presidential election. State voters chose 29 representatives, or electors, to the Electoral College, who voted for president and vice president.
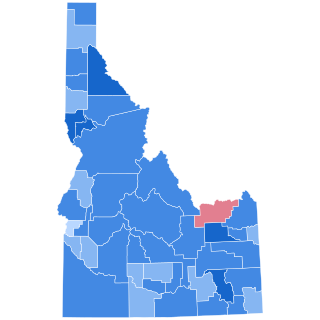
The 1936 United States presidential election in Idaho took place on November 3, 1936, as part of the 1936 United States presidential election. State voters chose four representatives, or electors, to the Electoral College, who voted for president and vice president.
The 1936 United States presidential election in Iowa took place on November 3, 1936, as part of the 1936 United States presidential election. Iowa voters chose 11 representatives, or electors, to the Electoral College, who voted for president and vice president.
The 1936 United States presidential election in Indiana took place on November 3, 1936, as part of the 1936 United States presidential election. State voters chose 14 representatives, or electors, to the Electoral College, who voted for president and vice president.
The 1932 United States presidential election in Idaho took place on November 8, 1932, as part of the 1932 United States presidential election. State voters chose four representatives, or electors, to the Electoral College, who voted for president and vice president.
The 1932 United States presidential election in Illinois took place on November 8, 1932, as part of the 1932 United States presidential election. State voters chose 29 representatives, or electors, to the Electoral College, who voted for president and vice president.