2008 United States presidential election in Indiana

Last updated

2008 United States presidential election in Indiana
Flag of Indiana.svg
  2004 November 4, 2008 2012  
  Obama portrait crop.jpg John McCain 2009 Official.jpg
Nominee Barack Obama John McCain
Party Democratic Republican
Home state Illinois Arizona
Running mate Joe Biden Sarah Palin
Electoral vote110
Popular vote1,374,0391,345,648
Percentage49.85%48.82%

Indiana Presidential Election Results 2008.svg
2008 US Presidential election in Indiana by congressional district.svg
2008 Presidential Election in Indiana by Precinct.svg

President before election

George W. Bush
Republican

Elected President

Barack Obama
Democratic

The 2008 United States presidential election in Indiana took place on November 4, 2008, and was part of the 2008 United States presidential election. Voters chose 11 representatives, or electors to the Electoral College, who voted for president and vice president.

Contents

Indiana was won by Democratic nominee Barack Obama by 28,391 votes, a 1.03% margin of victory. Prior to the election, major news organizations considered the state as leaning toward Republican nominee John McCain or as a toss-up. On election day, Obama narrowly carried Indiana, which marked what is to date the only time a Democratic presidential nominee won Indiana since Lyndon B. Johnson in 1964.

As of the 2020 presidential election , this is the last time that the Democratic nominee won any of the following counties: Madison, Spencer, Starke, Vanderburgh, and Vermillion, and the last time the state was decided by a single digit margin. Obama's 1,374,039 votes is the most received by a Democratic presidential candidate in the state's history. Despite both states going to the Democratic nominee, Indiana voted more democratic in this election than North Carolina, a modern day swing state whereas Indiana would return to its Republican roots just four years later. This is also the last election where Indiana voted to the left of Arizona and Georgia.

Primaries

On May 6, 2008, Indiana held its presidential primaries:

Campaign

Predictions

There were 16 news organizations who made state-by-state predictions of the election. Their last predictions before election day were:

SourceRanking
D.C. Political Report [1] Likely R
Cook Political Report [2] Toss-up
The Takeaway [3] Lean R
Electoral-vote.com [4] Lean R
Washington Post [5] Lean R
Politico [6] Lean R
RealClearPolitics [7] Toss-up
FiveThirtyEight [5] Lean R
CQ Politics [8] Toss-up
The New York Times [9] Toss-up
CNN [10] Toss-up
NPR [5] Lean R
MSNBC [5] Toss-up
Fox News [11] Toss-up
Associated Press [12] Toss-up
Rasmussen Reports [13] Toss-up

Polling

Pre-election polling was always tight, although McCain generally had a slight lead in 3 poll averages throughout the entire general election, including the final weeks of the election. Rasmussen Reports never had Obama winning a state poll. In the last opinion polling before the election, conducted by Public Policy Polling (October 31-November 2, 2008), Barack Obama led John McCain 49% to 48%. The final 3 poll average gave McCain the lead 49% to 46%, with undecided voters deciding the election. [14]

Fundraising

John McCain raised a total of $1,758,471 in the state. Barack Obama raised $3,400,475. [15]

Advertising and visits

Obama massively outspent McCain in this state. Obama and his interest groups spent $17,796,704. McCain and his interest groups spent $3,160,264. [16] The Democratic ticket visited this state 8 times. The Republican ticket visited 5 times. [17]

Analysis

Historically, Indiana has been the most Republican state in the Great Lakes region. However, polling in September and October showed that Indiana was possibly turning into a swing state in 2008. George W. Bush easily captured Indiana's 11 electoral votes in 2004, defeating Democrat John Kerry by more than 20%. In contrast, most polls from the summer of 2008 onward showed only single-digit margins.

The race was as close as expected. Indiana's polls closed at 6 p.m. local time. The state has often been among the first to be called for the Republican candidate; in 2004, for instance, the state was called for Bush almost as soon as the polls in the Central Time Zone portion of the state closed. [18] However, the race for the state was too close to call at 6pm, sending an early signal of potential upset to voters throughout the rest of the country. Indiana still had not been decided when most media outlets declared Obama president-elect at 11 p.m. Eastern time. Indiana was finally called for Senator Obama at around 6 a.m. Eastern on November 5. Ultimately, Obama ended up carrying Indiana with 1,374,039 votes to John McCain's 1,345,648 votes, a difference of 28,391 votes (approximately 1.03% of the total votes cast). The Libertarian candidate polled 29,257 votes - more than the margin of Obama's win. The result was widely seen as an upset considering Indiana's status as a traditionally Republican state. Obama won the contest with a mixture of excellent ground game and internet-powered outreach to potential voters. The efficient use of social media on a scale never seen before in presidential politics also played a role.

At the same time as Obama captured Indiana's 11 electoral votes, incumbent Republican Governor Mitch Daniels was reelected to a second term with 57.84% of the vote over Democrat Jill Long Thompson who received 40.04%. Libertarian Andy Horning received 2.12%. At the state level, Democrats picked up one seat in the Indiana House of Representatives.

After 2008, Indiana quickly returned to being a solidly red state, voting Republican by double-digit margins in every presidential election since. This set it apart from Virginia and North Carolina, the other two states that Obama was the first Democrat to win in several decades. Virginia continued to vote Democratic in presidential elections and to become increasingly Democratic at the state level as well. North Carolina returned to supporting Republican candidates in subsequent elections, but only by relatively narrow margins, with it being considered a key battleground in every presidential election thereafter.

Obama won only 15 of Indiana's counties compared to 77 for McCain. [19] However those 15 counties make up 44% of the state's population. Obama carried the state largely by trouncing McCain in Marion County, home to increasingly Democratic Indianapolis, by over 106,000 votes. Kerry narrowly won Marion County in 2004; prior to that it last supported a Democrat in 1964. Obama also won in Vigo County, home to Terre Haute and a noted bellwether; it had voted for the winner of every presidential election all but twice since 1892 (the streak ended in 2020). [20] Not a single county in Indiana voted more Republican in the 2008 election than in 2004. Although Obama lost Allen County, home to Indiana's second largest city, Fort Wayne, by four points, he won in Fort Wayne city proper by 6 points.

Obama also dominated Gary and northwestern Indiana, traditionally the most Democratic region of the state. Many of the voters in this area already knew Obama, as this region makes up most of the Indiana side of the Chicago metropolitan area and the Chicago media market; Obama is from Chicago and has aired ads here for over a decade (dating to his tenure in the Illinois Senate). He also did very well in counties where colleges and universities are located, including St. Joseph (home to South Bend and Notre Dame), Vigo (home to Terre Haute and Indiana State University, Rose–Hulman Institute of Technology, and Saint Mary-of-the-Woods College) Monroe (home to Bloomington and IU), Delaware (home to Muncie and Ball State), Tippecanoe (home to West Lafayette and Purdue), and Porter (home to Valparaiso and Valparaiso University). [21] Obama was the first Democrat to carry Tippecanoe County since 1964.

McCain dominated Indianapolis's traditionally heavily Republican suburbs, although Obama reduced the Republican margin from past presidential elections. [22] McCain also did well in traditionally Democratic Southern Indiana. Obama only managed to win three counties in this region, one of which was Vanderburgh County, where the city of Evansville is located.

Results

2008 United States presidential election in Indiana [23]
PartyCandidateVotes%±%
Democratic Barack H. Obama and Joseph R. Biden Jr. 1,374,03949.85%+10.59%
Republican John S. McCain and Sarah Palin 1,345,64848.82%-11.13%
Libertarian Bob Barr 29,2571.06%+0.36%
No partyOthers7,3960.27%
Plurality28,3911.03%
Turnout 2,756,34058.8%

By county

CountyBarack Obama
Democratic
John McCain
Republican
Various candidates
Other parties
MarginTotal
#%#%#%#%
Adams 4,92836.40%8,40462.07%2071.53%-3,476-25.67%13,539
Allen 71,26347.34%77,79351.67%1,4910.99%-6,530-4.33%150,547
Bartholomew 13,56743.64%17,06754.90%4551.46%-3,500-11.26%31,089
Benton 1,56340.95%2,18357.19%711.86%-620-16.24%3,817
Blackford 2,67749.12%2,69049.36%831.53%-13-0.24%5,450
Boone 9,75236.54%16,62262.27%3181.19%-6,870-25.73%26,692
Brown 3,85447.85%4,06050.40%1411.75%-206-2.55%8,055
Carroll 3,73642.77%4,85855.61%1421.62%-1,122-12.84%8,736
Cass 7,01144.79%8,34653.32%2961.89%-1,335-8.53%15,653
Clark 21,95345.85%25,32652.89%6051.27%-3,373-7.04%47,884
Clay 4,95443.48%6,26755.00%1741.52%-1,313-11.52%11,395
Clinton 5,30742.79%6,91955.79%1751.41%-1,612-13.00%12,401
Crawford 2,28648.19%2,39350.44%651.37%-107-2.25%4,744
Daviess 3,37031.83%7,09867.05%1181.12%-3,728-35.22%10,586
Dearborn 7,12332.06%14,88667.00%2080.94%-7,763-34.94%22,217
Decatur 3,89237.06%6,44961.40%1621.54%-2,557-24.34%10,503
DeKalb 7,17541.78%9,78056.95%2191.26%-2,605-15.17%17,174
Delaware 28,38456.80%20,91641.85%6761.36%7,46814.95%49,976
Dubois 8,74847.05%9,52651.23%3191.72%-778-4.18%18,593
Elkhart 31,39843.83%39,39655.00%8401.17%-7,998-11.17%71,634
Fayette 4,38946.30%4,91751.87%1731.82%-528-5.57%9,479
Floyd 16,26344.35%19,95754.43%4471.21%-3,694-10.08%36,667
Fountain 3,09441.66%4,15855.99%1742.35%-1,064-14.33%7,426
Franklin 3,40431.99%7,01865.95%2202.06%-3,614-33.96%10,642
Fulton 3,70241.11%5,14757.15%1571.74%-1,445-16.04%9,006
Gibson 6,45542.57%8,44955.72%2601.72%-1,994-13.15%15,164
Grant 11,29342.87%14,73455.93%3171.20%-3,441-13.06%26,344
Greene 5,70941.82%7,69156.34%2501.83%-1,982-14.52%13,650
Hamilton 49,70438.45%78,40160.64%1,1740.91%-28,697-22.19%129,279
Hancock 11,87434.67%22,00864.25%3711.08%-10,134-29.58%34,253
Harrison 7,28840.10%10,55158.06%3351.84%-3,263-17.96%18,174
Hendricks 24,54837.73%39,72861.07%7781.20%-15,180-23.34%65,054
Henry 10,05947.18%10,89651.11%3641.70%-837-3.93%21,319
Howard 17,87146.02%20,24852.14%7141.84%-2,377-6.12%38,833
Huntington 5,84335.72%10,29162.91%2231.36%-4,448-27.19%16,357
Jackson 7,35442.17%9,72655.77%3602.07%-2,372-13.60%17,440
Jasper 5,04439.06%7,66959.39%2001.54%-2,625-20.33%12,913
Jay 3,74845.03%4,40152.88%1742.09%-653-7.85%8,323
Jefferson 6,25546.30%7,05352.21%2021.50%-798-5.91%13,510
Jennings 5,31244.87%6,26152.88%2662.24%-949-8.01%11,839
Johnson 21,55336.66%36,48762.07%7461.26%-14,934-25.41%58,786
Knox 7,56946.08%8,63952.60%2161.31%-1,070-6.52%16,424
Kosciusko 9,23630.60%20,48867.87%4611.53%-11,252-37.27%30,185
LaGrange 3,66338.42%5,70259.80%1701.78%-2,039-21.38%9,535
Lake 139,30166.64%67,74232.41%1,9960.95%71,55934.23%209,039
LaPorte 28,25860.10%17,91838.11%8421.79%10,34021.99%47,018
Lawrence 7,20838.89%11,01859.45%3081.66%-3,810-20.56%18,534
Madison 30,15252.49%26,40345.96%8891.55%3,7496.53%57,444
Marion 241,98763.67%134,31335.34%3,7901.00%107,67428.33%380,090
Marshall 7,88942.48%10,40656.03%2761.48%-2,517-13.55%18,571
Martin 1,70634.80%3,12263.68%751.53%-1,416-28.88%4,903
Miami 5,56439.30%8,31258.72%2801.98%-2,748-19.42%14,156
Monroe 41,45065.39%21,11833.32%8191.29%20,33232.07%63,387
Montgomery 6,01339.34%9,06059.27%2121.39%-3,047-19.93%15,285
Morgan 10,33035.85%18,12962.92%3521.22%-7,799-27.07%28,811
Newton 2,62543.36%3,30154.53%1282.12%-676-11.17%6,054
Noble 7,06441.54%9,67356.88%2701.58%-2,609-15.34%17,007
Ohio 1,15839.68%1,71358.70%471.61%-555-19.02%2,918
Orange 3,39041.81%4,53655.94%1822.24%-1,146-14.13%8,108
Owen 3,57043.70%4,41554.04%1852.26%-845-10.34%8,170
Parke 2,92441.83%3,90955.92%1572.25%-985-14.09%6,990
Perry 5,14160.55%3,20237.71%1471.73%1,93922.84%8,490
Pike 2,70044.79%3,22153.43%1071.78%-521-8.64%6,028
Porter 39,17852.77%33,85745.60%1,2111.63%5,3217.17%74,246
Posey 5,82845.63%6,80453.28%1391.09%-976-7.65%12,771
Pulaski 2,46641.35%3,38856.81%1101.84%-922-15.46%5,964
Putnam 6,33443.16%8,08655.10%2551.74%-1,752-11.94%14,675
Randolph 4,83944.71%5,78853.48%1951.81%-949-8.77%10,822
Ripley 4,18734.22%7,79463.71%2532.08%-3,607-29.49%12,234
Rush 3,22942.33%4,27155.98%1291.69%-1,042-13.65%7,629
Scott 4,27147.80%4,44549.75%2192.45%-174-1.95%8,935
Shelby 6,98739.69%10,33358.70%2821.60%-3,346-19.01%17,602
Spencer 5,03949.42%5,00149.05%1561.53%380.37%10,196
St. Joseph 68,71057.87%48,51040.85%1,5191.28%20,20017.02%118,739
Starke 4,77850.41%4,47347.19%2282.41%3053.22%9,479
Steuben 6,28444.29%7,67454.09%2301.62%-1,390-9.80%14,188
Sullivan 4,28448.78%4,34349.45%1551.76%-59-0.67%8,782
Switzerland 1,63845.00%1,94053.30%621.70%-302-8.30%3,640
Tippecanoe 37,78155.05%29,82243.45%1,0331.50%7,95911.60%68,636
Tipton 3,25041.46%4,45256.80%1361.73%-1,202-15.34%7,838
Union 1,22436.48%2,06161.43%702.09%-837-24.95%3,355
Vanderburgh 39,42350.60%37,51248.15%9781.26%1,9112.45%77,913
Vermillion 4,00356.10%3,01042.19%1221.71%99313.91%7,135
Vigo 25,04057.06%18,12141.29%7231.65%6,91915.77%43,884
Wabash 5,45639.27%8,23859.30%1981.43%-2,782-20.03%13,892
Warren 1,75543.90%2,16654.18%771.93%-411-10.28%3,998
Warrick 12,32942.93%16,01355.75%3791.32%-3,684-12.82%28,721
Washington 4,56240.19%6,51957.43%2712.38%-1,957-17.24%11,352
Wayne 13,45946.99%14,55850.83%6242.18%-1,099-3.84%28,641
Wells 4,40333.64%8,50464.98%1811.38%-4,101-31.34%13,088
White 4,83944.78%5,73153.04%2352.17%-892-8.26%10,805
Whitley 5,86238.55%9,12459.99%2221.46%-3,262-21.44%15,208
Totals1,374,03949.84%1,345,64848.81%36,9711.34%28,3911.03%2,756,658
County Flips:
Democratic
Hold
Gain from Republican
Republican
Hold Indiana County Flips 2008.svg
County Flips:

Counties that flipped from Republican to Democratic

By congressional district

Although Barack Obama narrowly won the state and its 11 electoral votes, John McCain carried 6 out of 9 congressional districts in Indiana, including two held by Democrats.

DistrictMcCainObamaRepresentative
1st 37.38%61.76% Pete Visclosky
2nd 44.72%54.10% Joe Donnelly
3rd 56.22%42.84% Mark Souder
4th 55.90%43.03% Steve Buyer
5th 58.90%39.79% Dan Burton
6th 52.46%46.18% Mike Pence
7th 28.35%70.89% André Carson
8th 51.30%47.41% Brad Ellsworth
9th 49.70%49.06% Baron Hill

Electors

Technically the voters of Indiana cast their ballots for electors: representatives to the Electoral College. Indiana is allocated 11 electors because it has 9 congressional districts and 2 senators. All candidates who appear on the ballot or qualify to receive write-in votes must submit a list of 11 electors, who pledge to vote for their candidate and his or her running mate. Whoever wins a plurality of votes in the state is awarded all 11 electoral votes. Their chosen electors then vote for president and vice president. Although electors are pledged to their candidate and running mate, they are not obligated to vote for them. [24] An elector who votes for someone other than his or her candidate is known as a faithless elector.

The electors of each state and the District of Columbia met on December 15, 2008, to cast their votes for president and vice president. The Electoral College itself never meets as one body. Instead the electors from each state and the District of Columbia met in their respective capitols.

The following were the members of the Electoral College from the state. All 11 were pledged to Barack Obama and Joe Biden: [25]

  1. Jeffrey L. Chidester
  2. Butch Morgan
  3. Michelle Boxell
  4. Charlotte Martin
  5. Jerry J. Lux
  6. Connie Southworth
  7. Alan P. Hogan
  8. Myrna E. Brown
  9. Clarence Benjamin Leatherbury
  10. Daniel J. Parker
  11. Cordelia Lewis Burks

See also

Related Research Articles

<span class="mw-page-title-main">2008 United States presidential election in Colorado</span> Election in Colorado

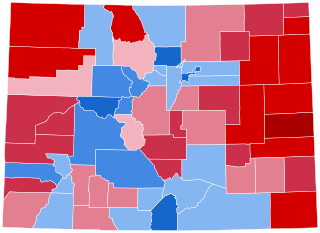
The 2008 United States presidential election in Colorado took place on November 4, 2008, as a part of the 2008 United States presidential election throughout all 50 states and the District of Columbia. Voters chose nine representatives, or electors to the Electoral College, who voted for president and vice president.

<span class="mw-page-title-main">2008 United States presidential election in Wisconsin</span> Election in Wisconsin

The 2008 United States presidential election in Wisconsin took place on November 4, 2008, as part of the 2008 United States presidential election in which all 50 states plus the District of Columbia participated. State voters chose 10 electors to represent them in the Electoral College via a popular vote pitting Democratic U.S. Senator from Illinois Barack Obama, and his running mate U.S. Senator from Delaware Joe Biden, against Republican challenger and U.S. Senator from Arizona John McCain and his running mate, Alaska Governor Sarah Palin.

<span class="mw-page-title-main">2008 United States presidential election in Oregon</span> Election in Oregon

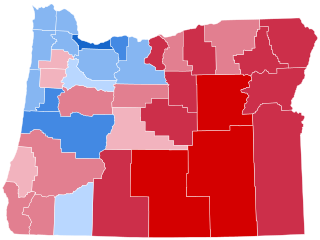
The 2008 United States presidential election in Oregon took place on November 4, 2008, and was part of the 2008 United States presidential election. Voters chose seven representatives, or electors to the Electoral College, who voted for president and vice president.

<span class="mw-page-title-main">2008 United States presidential election in New Jersey</span> Election in New Jersey

The 2008 United States presidential election in New Jersey took place on November 4, 2008, and was part of the 2008 United States presidential election. Voters chose 15 representatives, or electors to the Electoral College, who voted for president and vice president.

<span class="mw-page-title-main">2008 United States presidential election in Wyoming</span> Election in Wyoming

The 2008 United States presidential election in Wyoming took place on November 4, 2008, and was part of the 2008 United States presidential election. Voters chose three representatives, or electors to the Electoral College, who voted for president and vice president.

<span class="mw-page-title-main">2008 United States presidential election in North Dakota</span> Election in North Dakota

The 2008 United States presidential election in North Dakota took place on November 4, 2008, and was part of the 2008 United States presidential election. Voters chose three representatives, or electors to the Electoral College, who voted for president and vice president.

<span class="mw-page-title-main">2008 United States presidential election in North Carolina</span>

The 2008 United States presidential election in North Carolina was part of the national event on November 4, 2008, throughout all 50 states and D.C. In North Carolina, voters chose 15 representatives, or electors, to the Electoral College, who voted for president and vice president.

<span class="mw-page-title-main">2008 United States presidential election in Nebraska</span> Election in Nebraska

The 2008 United States presidential election in Nebraska took place on November 4, 2008, as part of the 2008 United States presidential election. Voters chose five electors to the Electoral College, who voted for president and vice president. However, Nebraska is one of the two states of the U.S. that, instead of giving all of its electors to the winner based on its statewide results, allocates just two electoral votes to the winner of the statewide popular vote. The other three electors vote based on their individual congressional district results.

<span class="mw-page-title-main">2008 United States presidential election in Montana</span> Election in Montana

The 2008 United States presidential election in Montana took place on November 4, 2008, and was part of the 2008 United States presidential election. Voters chose three representatives, or electors to the Electoral College, who voted for president and vice president.

<span class="mw-page-title-main">2008 United States presidential election in Nevada</span> Election in Nevada

The 2008 United States presidential election in Nevada was part of the 2008 United States presidential election, which took place on November 4, 2008, throughout all 50 states and D.C. Voters chose five representatives, or electors to the Electoral College, who voted for president and vice president.

<span class="mw-page-title-main">2008 United States presidential election in Ohio</span> Election in Ohio

The 2008 United States presidential election in Ohio took place on November 4, 2008, which was part of the 2008 United States presidential election. Voters chose 20 representatives, or electors to the Electoral College, who voted for president and vice president.

<span class="mw-page-title-main">2008 United States presidential election in Illinois</span>

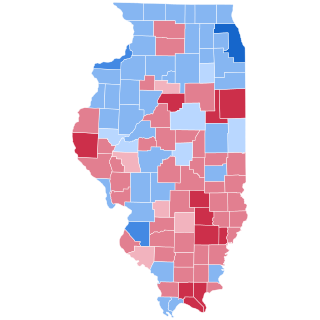
The 2008 United States presidential election in Illinois took place on November 4, 2008, and was part of the 2008 United States presidential election. Voters chose 21 representatives, or electors to the Electoral College, who voted for president and vice president.

<span class="mw-page-title-main">2008 United States presidential election in Virginia</span> Election in Virginia

The 2008 United States presidential election in Virginia took place on November 4, 2008, which was part of the 2008 United States presidential election. Voters chose 13 representatives, or electors to the Electoral College, who voted for president and vice president.

<span class="mw-page-title-main">2008 United States presidential election in Texas</span> Election in Texas

The 2008 United States presidential election in Texas took place on November 4, 2008, and was part of the 2008 United States presidential election. Voters chose 34 representatives, or electors to the Electoral College, who voted for president and vice president.

<span class="mw-page-title-main">2008 United States presidential election in Idaho</span> Election in Idaho

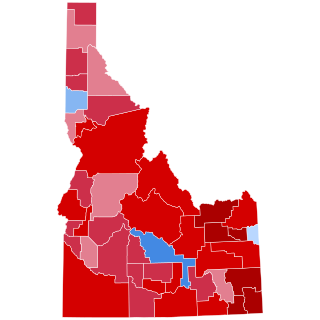
The 2008 United States presidential election in Idaho took place on November 4, 2008, and was part of the 2008 United States presidential election. Voters chose four representatives, or electors to the Electoral College, who voted for president and vice president.

<span class="mw-page-title-main">2008 United States presidential election in Florida</span> Election in Florida

The 2008 United States presidential election in Florida took place on November 4, 2008, and was part of the 2008 United States presidential election. Voters chose 27 representatives, or electors to the Electoral College, who voted for president and vice president.

<span class="mw-page-title-main">2008 United States presidential election in Georgia</span> Election in Georgia

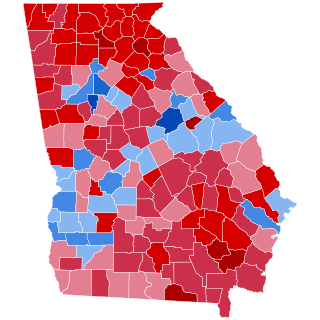
The 2008 United States presidential election in Georgia took place on November 4, 2008. Voters chose 15 representatives, or electors to the Electoral College, who voted for president and vice president.

<span class="mw-page-title-main">2008 United States presidential election in Kentucky</span> Election in Kentucky

The 2008 United States presidential election in Kentucky took place on November 4, 2008, and was part of the 2008 United States presidential election. Voters chose eight representatives, or electors to the Electoral College, who voted for president and vice president.

<span class="mw-page-title-main">2008 United States presidential election in Maryland</span> U.S. presidential election in Maryland

The 2008 United States presidential election in Maryland took place on November 4, 2008, and was part of the 2008 United States presidential election. Voters chose 10 representatives, or electors to the Electoral College, who voted for president and vice president.

<span class="mw-page-title-main">2008 United States presidential election in Michigan</span> Election in Michigan

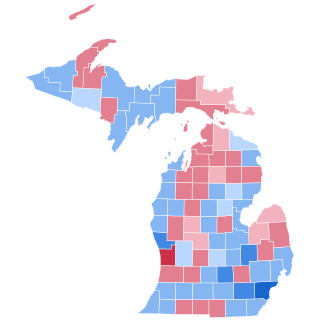
The 2008 United States presidential election in Michigan took place on November 4, 2008. It was part of the 2008 United States presidential election which happened throughout all 50 states and D.C. Voters chose 17 representatives, or electors to the Electoral College, who voted for president and vice president.

References

  1. "D.C.'s Political Report: The complete source for campaign summaries". January 1, 2009. Archived from the original on January 1, 2009. Retrieved August 23, 2021.
  2. "Presidential". May 5, 2015. Archived from the original on May 5, 2015. Retrieved August 23, 2021.
  3. "Vote 2008 - The Takeaway - Track the Electoral College vote predictions". April 22, 2009. Archived from the original on April 22, 2009. Retrieved August 23, 2021.
  4. "Electoral-vote.com: President, Senate, House Updated Daily". electoral-vote.com. Retrieved August 23, 2021.
  5. 1 2 3 4 Based on Takeaway
  6. "POLITICO's 2008 Swing State Map - POLITICO.com". www.politico.com. Retrieved September 22, 2016.
  7. "RealClearPolitics - Electoral Map". Archived from the original on June 5, 2008.
  8. "CQ Presidential Election Maps, 2008". CQ Politics. Archived from the original on June 14, 2009. Retrieved December 20, 2009.
  9. Nagourney, Adam; Zeleny, Jeff; Carter, Shan (November 4, 2008). "The Electoral Map: Key States". The New York Times. Retrieved May 26, 2010.
  10. "October 2008 CNN Political Ticker - CNN.com Blogs". CNN. October 31, 2008. Archived from the original on June 19, 2010. Retrieved May 26, 2010.
  11. "Winning The Electoral College". Fox News. April 27, 2010.
  12. "roadto270". hosted.ap.org. Retrieved September 22, 2016.
  13. "Election 2008: Electoral College Update - Rasmussen Reports". www.rasmussenreports.com. Retrieved September 22, 2016.
  14. Election 2008 Polls - Dave Leip's Atlas of U.S. Presidential Elections
  15. "Presidential Campaign Finance". Archived from the original on March 24, 2009. Retrieved August 20, 2009.
  16. "Map: Campaign Ad Spending - Election Center 2008 from CNN.com". CNN. Retrieved May 26, 2010.
  17. "Map: Campaign Candidate Visits - Election Center 2008 from CNN.com". CNN. Retrieved May 26, 2010.
  18. 2004 election night timeline from Dave Leip's presidential election atlas
  19. "Indiana General Election November 4, 2008, by County". Indiana Secretary of State. November 4, 2008. Retrieved November 7, 2008.
  20. "Obama leads in bellwether Vigo Co". Indianapolis Star. November 4, 2008. Archived from the original on January 26, 2013. Retrieved November 12, 2008.
  21. "'At this defining moment, change has come to America'". Indianapolis Star. November 5, 2008. Archived from the original on November 8, 2008. Retrieved November 5, 2008.
  22. "Obama gains in fast-growing counties". Politico. November 9, 2008. Retrieved November 10, 2008.
  23. "Indiana General Election November 4, 2008, Statewide". Indiana Secretary of State. November 4, 2008. Retrieved November 7, 2008.
  24. "Electoral College". California Secretary of State. Archived from the original on October 30, 2008. Retrieved November 1, 2008.
  25. "Electoral College Information". Indiana Secretary of State Todd Rokita. Archived from the original on July 30, 2008. Retrieved December 15, 2008.