2015 Reading Borough Council election

Last updated

Map of the results of the 2015 Reading Borough Council election. Labour in red, Liberal Democrats in yellow, Conservatives in blue and the Greens in green. Reading Borough Council Electoral Make-up 2011.gif
Map of the results of the 2015 Reading Borough Council election. Labour in red, Liberal Democrats in yellow, Conservatives in blue and the Greens in green.

Elections to Reading Borough Council took place on 7 May 2015 to elect approximately one third of the members of Reading Borough Council in England to coincide with other local elections, an election which was held simultaneously with the 2015 General Election, resulting in higher turnout than the previous election. [1] The election resulted in no change in terms of the political make-up of the Council will each political party holding their respective seats.

Contents

After the election, the composition of the council was:

PartySeats  +/-  
Labour 310
Conservative 100
Green Party 30
Liberal Democrats 20
Labour hold

Election result

Reading Borough Council Election, 2015
PartySeatsGainsLossesNet gain/lossSeats %Votes %Votes+/−
  Labour 900060%37.5%25,803-1.5%
  Conservative 500033.3%35.3%24,260+9.8%
  Green 10006.6%11.1%7,624-2.5%
  UKIP 00000%7.9%5,467-1.0%
  Liberal Democrats 00000%7.8%5,361-1.1%
  Independent 00000%0.0%57-3.9%
  Liberal 00000%0.0%47N/C
  The Roman Party Ave! 00000%0.0%34-0.1%
  TUSC 00000%0.0%13-0.1%

Ward results

Abbey Ward [2]
PartyCandidateVotes%±%
Labour Mohammed Ayub1,95042.3%-6.7%
Conservative Chris Ashworth1,45431.6%+12.2%
Green Richard Black53511.6%-1.3%
Liberal Democrats James Moore3938.5%-0.4%
UKIP William MacPhee2695.8%-3.2%
Majority49610.7%-18.8%
Turnout 4.60153.7%+28.7%
Labour hold Swing -9.4%
Battle Ward [2]
PartyCandidateVotes%±%
Labour Chris Maskell2,21953.1%-3.9%
Conservative Michael Hey97923.4%+3.4%
Green Alan Edward Lockey3899.3%-4.0%
UKIP Jack McLeod2766.6%+6.6%
Liberal Democrats Glenn Goodall2756.5%-1.0%
The Roman Party Ave! Jean-Louis Pascual340.8%-1.1%
Majority1,24027.5%-9.4%
Turnout 4,17256%+28%
Labour hold Swing -3.6%
Caversham Ward [3]
PartyCandidateVotes%±%
Conservative Claire McDonald1,92138.8%+8.2%
Labour Mary Waite1,74035.1%-1.9%
Green David Foster50710.2%-2.1%
Liberal Democrats Chris Burden4158.3%-1.1%
UKIP Matthew Plunkett3647.3%-4.6%
Majority1810.3%+6.7%
Turnout 4,94768.2%+29.2%
Conservative hold Swing +5%
Church Ward [4] [5]
PartyCandidateVotes%±%
Labour Paul Richard Woodward1,55539.2%-2.1%
Conservative Paul Carnell1,31833.2%+7.3%
UKIP Bob Curtis46411.7%-5.4%
Green Neil Andrews3759.4%-1.3%
Liberal Democrats Kirsten Bayes2536.3%+1.5%
Majority2375.9%-9.4%
Turnout 3,96558.9%+30.9%
Labour hold Swing -4.7%
Katesgrove Ward [5] [6]
PartyCandidateVotes%±%
Labour Matt Rodda 1,71345.6%-2.9%
Conservative Syed Abbas95225.3%+9.0%
Green Louise Keane51613.7%+0.1%
Liberal Democrats Janel Blatter3358.9%-0.4%
UKIP Karin Cheetham2376.3%-5.8%
Majority76120.2%-12.0%
Turnout 3,75356.2%+28.2%
Labour hold Swing -5.9%
Kentwood Ward [7]
PartyCandidateVotes%±%
Conservative Tom Steele2,03743.5%+12.7%
Labour Gurvinder Kaur1,53832.8%-3.1%
UKIP Howard Thomas58212.4%-9.4%
Green Ruth Shaffrey2886.1%-0.3%
Liberal Democrats Jonathan Walls2345.0%+0.1%
Majority49910.6%+15.7%
Turnout 4,67965%+28%
Conservative hold Swing +7.9%
Minster Ward [8]
PartyCandidateVotes%±%
Labour Paul Stephen Gittings2,08246.0%+1.7%
Conservative Alanzo Nesta Seville1,56034.5%+7.5%
Green Keith Johnson45810.1%-0.7%
UKIP Patrick Dillon4199.2%-5.0%
Majority52211.5%-5.8%
Turnout 4,51961.7%+29.7%
Labour hold Swing -2.9%

Note: The Liberal Democrats did not stand in this ward.

Norcot Ward [9]
PartyCandidateVotes%±%
Labour Graeme William Hoskin2,18148.0%-9.0%
Conservative Rob Masterson1,33129.3%+5.4%
UKIP Philip Giles52011.4%+11.4%
Green Brent Smith2485.4%-6.6%
Liberal Democrats Annette Hendry2104.6%-2.4%
Liberal Stephen Graham470.1%+0.1%
Majority85018.7%-14.4%
Turnout 4,53761.8%+29.8%
Labour hold Swing -7.0%
Park Ward [10]
PartyCandidateVotes%±%
Green Josh Williams1,98743.3%-10.0%
Labour Dave Dymond1,65236.0%+6.1%
Conservative Sarah Parkington77616.9%+6.7%
Liberal Democrats Rebecca Rye1723.7%+1.1%
Majority3357.3%-16.1%
Turnout 4,58769.2%+26.2%
Green hold Swing -8.0%
Peppard Ward [11]
PartyCandidateVotes%±%
Conservative Clare Grashoff3,26058.0%+26.2%
Labour Leighton Yeo1,15520.5%+4.7%
Liberal Democrats Madeleine Elizabeth Adams70612.5%+7.8%
Green Kate Day4988.8%+3.1%
Majority2,10537.4%+33.1%
Turnout 5,61974.9%+32.9%
Conservative hold Swing +10.7%
Redlands Ward [12]
PartyCandidateVotes%±%
Labour Jan Gavin1,68242.5%-2.4%
Conservative Helen Hopper95524.1%+5.7%
Green Kizzi Murtagh80420.3%+5.9%
Liberal Democrats Francis Jakeman3378.5%-6.1%
UKIP Robert Allan1754.4%-3.0%
Majority72718.3%-8.2%
Turnout 3,95365.5%+34.5%
Labour hold Swing -4.0%
Southcote Ward [13]
PartyCandidateVotes%±%
Labour Matt Lawrence1,80242.7%-14.8%
Conservative Russell Martin1,47634.9%+6.9%
UKIP John Combes57613.6%+13.6%
Green Doug Cresswell1874.4%-5.1%
Liberal Democrats Rodney Pinchen1794.2%-0.7%
Majority3267.7%-21.8%
Turnout 4,22064.8%+30.8%
Labour hold Swing -10.8%
Thames Ward [14]
PartyCandidateVotes%±%
Conservative Jeanette Mavis Skeats3,03752.2%+6.7%
Labour Richard Stainthorp1,25821.6%-1.8%
Liberal Democrats Guy Penman60910.4%+1.5%
Green Sarah McNamara4958.5%-3.3%
UKIP Cecilia Kelly4107.0%+7.0%
Majority1,77930.6%+8.6%
Turnout 5,80978.8%+34.8%
Conservative hold Swing +4.2%
Tilehurst Ward
PartyCandidateVotes%±%
Conservative Sandra Doreen Vickers1,94439.9%+16.3%
Labour Matt Harrison1,11422.9%+7.2%
Liberal Democrats Jon Fanti1,09622.5%-14.7%
UKIP Ann Zebedee53210.9%-8.5%
Green Miriam Kennet1763.6%-0.3%
Majority83017.0%+30.5%
Turnout 4,86268.6%
Conservative hold Swing +15.5%
Whitley Ward [15]
PartyCandidateVotes%±%
Labour Kelly Liza Edwards2,16248.6%-4.6%
Conservative Nick Brown1,26028.3%+6.0%
UKIP Linda Giles64314.4%+14.4%
Green Stacey Hames1613.6%-4.1%
Liberal Democrats Margaret McNeill1473.3%-0.9%
Independent Jamie Wake571.2%-11.1%
TUSC Fredrik Tillett130.2%+0.2%
Majority90220.3%-10.6%
Turnout 4,44354.3%+28.3%
Labour hold Swing -5.3%

Related Research Articles

<span class="mw-page-title-main">Reading East (UK Parliament constituency)</span> Parliamentary constituency in the United Kingdom, 1983 onwards

Reading East is a constituency represented in the House of Commons of the UK Parliament since 2017 by Matt Rodda, of the Labour Party. The seat is one of two Labour seats from a total of eight seats in Berkshire.

<span class="mw-page-title-main">Reading West (UK Parliament constituency)</span> Parliamentary constituency in the United Kingdom, 1983 onwards

Reading West is a constituency represented in the House of Commons of the UK Parliament since 2010 by Alok Sharma, a Conservative.

<span class="mw-page-title-main">Henley (UK Parliament constituency)</span> Parliamentary constituency in the United Kingdom, 1885 onwards

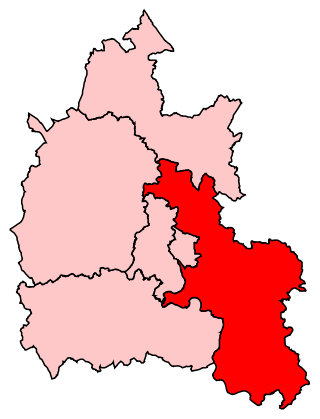
Henley is a constituency in Oxfordshire represented in the House of Commons of the UK Parliament since 2008 by John Howell, a Member of Parliament from the Conservative Party.

<span class="mw-page-title-main">Barking and Dagenham London Borough Council elections</span> Class of election in England

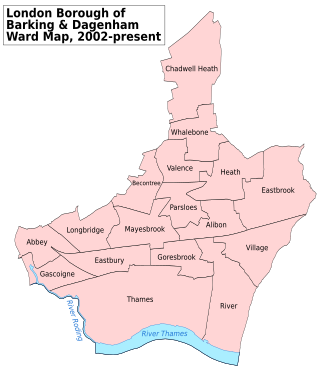
Barking and Dagenham London Borough Council in London, England is elected every four years. Since the last boundary changes in 2002, 51 councillors have been elected from 17 wards.

Boston Borough Council in Lincolnshire, England is elected every four years. Since the last boundary changes in 2015, 30 councillors are elected from 15 wards.

Bracknell Forest Borough Council is the local authority for Bracknell Forest, a unitary authority in Berkshire, England. Until 1 April 1998 it was a non-metropolitan district.

<span class="mw-page-title-main">Christchurch Borough Council elections</span>

Christchurch Borough Council in Dorset, England, existed from 1974 to 2019, when it was abolished and subsumed into Bournemouth, Christchurch and Poole Council.

One third of Crawley Borough Council in West Sussex, England is elected each year, followed by one year without election. Since the last boundary changes in 2019, 36 councillors have been elected from 13 wards.

<span class="mw-page-title-main">Redbridge London Borough Council elections</span>

Redbridge London Borough Council in London, England is elected every four years.

<span class="mw-page-title-main">Enfield London Borough Council elections</span> UK local elections

Enfield London Borough Council in London, England is elected every four years. Since the last boundary changes in 2022, 63 councillors have been elected from 25 wards.

<span class="mw-page-title-main">Lewisham London Borough Council elections</span> London local authority, elections and history

Lewisham London Borough Council is the local authority for the London Borough of Lewisham, in London, United Kingdom. Elections are held every four years using a plurality bloc vote electoral system for the councillors and the supplementary vote electoral system for the elected mayor.

<span class="mw-page-title-main">Hounslow London Borough Council elections</span> Local elections held every four years

Hounslow Council in London, England is elected every four years. 60 councillors are elected from 20 wards, with by-elections held to fill any vacancies between elections.

<span class="mw-page-title-main">Hammersmith and Fulham London Borough Council elections</span> English local election

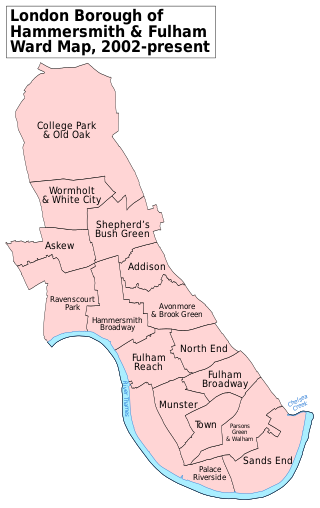
Hammersmith and Fulham London Borough Council is the local authority for the London Borough of Hammersmith and Fulham in London, England. The council is elected every four years.

<span class="mw-page-title-main">Merton London Borough Council elections</span> Political party in the United Kingdom

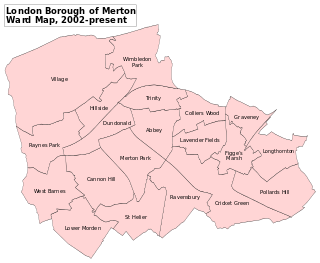
Merton London Borough Council in London, England is elected every four years; it has administrative control over the London Borough of Merton.

<span class="mw-page-title-main">Kensington and Chelsea London Borough Council elections</span> Local elections in London, England

Kensington and Chelsea London Borough Council in London, England, is elected every four years. Since the last boundary changes in 2014, 50 councillors have been elected from 18 wards.

<span class="mw-page-title-main">Westminster City Council elections</span> Class of UK elections

Westminster City Council, the local authority of the City of Westminster in London, England, is elected every four years. Since the last boundary changes in 2002, 60 councillors have been elected from 20 wards. New boundary changes will come into effect for the 2022 elections, when the borough will be represented by 54 councillors in 18 three-member wards.

<span class="mw-page-title-main">Islington London Borough Council elections</span> UK local government elections

Islington London Borough Council in London, England is elected every four years. Since the last boundary changes in 2002, 48 councillors have been elected from 16 wards.

<span class="mw-page-title-main">Greenwich London Borough Council elections</span> Class of UK elections

Greenwich London Borough Council is the local authority for the Royal Borough of Greenwich in London, England. The council is elected every four years. Since the last boundary changes in 2022, 55 councillors have been elected from 23 wards.

<span class="mw-page-title-main">2015 Wirral Metropolitan Borough Council election</span> 2015 local election in England

The 2015 Wirral Metropolitan Borough Council election took place on 7 May 2015 to elect members of Wirral Metropolitan Borough Council in England. This election was held on the same day as other local elections.

<span class="mw-page-title-main">2022 Reading Borough Council election</span> 2022 Reading Borough Council election

An election to Reading Borough Council took place as of 5 May 2022. Following boundary changes all the seats on the council were up for election.

References

  1. "Upcoming elections & referendums". The Electoral Commission. Archived from the original on 15 March 2015. Retrieved 3 April 2015.
  2. 1 2 "Local Election 7 May 2015". Reading Borough Council. 8 May 2015. Archived from the original on 10 July 2015. Retrieved 8 June 2015.
  3. "Local Election 7 May 2015". Reading Borough Council. 8 May 2015. Archived from the original on 10 July 2015. Retrieved 8 June 2015.
  4. "Local Election 7 May 2015". Reading Borough Council. 8 May 2015. Archived from the original on 10 July 2015. Retrieved 8 June 2015.
  5. 1 2 "Local Election 7 May 2015". Reading Borough Council. 8 May 2015. Archived from the original on 10 July 2015. Retrieved 8 June 2015.
  6. "Local Election 7 May 2015". Reading Borough Council. 8 May 2015. Archived from the original on 10 July 2015. Retrieved 8 June 2015.
  7. "Local Election 7 May 2015". Reading Borough Council. 8 May 2015. Archived from the original on 10 July 2015. Retrieved 8 June 2015.
  8. "Local Election 7 May 2015". Reading Borough Council. 8 May 2015. Archived from the original on 10 July 2015. Retrieved 8 June 2015.
  9. "Local Election 7 May 2015". Reading Borough Council. 8 May 2015. Archived from the original on 10 July 2015. Retrieved 8 June 2015.
  10. "Local Election 7 May 2015". Reading Borough Council. 8 May 2015. Archived from the original on 10 July 2015. Retrieved 8 June 2015.
  11. "Local Election 7 May 2015". Reading Borough Council. 8 May 2015. Archived from the original on 10 July 2015. Retrieved 8 June 2015.
  12. "Local Election 7 May 2015". Reading Borough Council. 8 May 2015. Archived from the original on 10 July 2015. Retrieved 8 June 2015.
  13. "Local Election 7 May 2015". Reading Borough Council. 8 May 2015. Archived from the original on 10 July 2015. Retrieved 8 June 2015.
  14. "Local Election 7 May 2015". Reading Borough Council. 8 May 2015. Archived from the original on 10 July 2015. Retrieved 8 June 2015.
  15. "Local Election 7 May 2015". Reading Borough Council. 8 May 2015. Archived from the original on 10 July 2015. Retrieved 8 June 2015.