| ||||||||||||||||||||||||||||
20 seats from odd-numbered districts in the California State Senate | ||||||||||||||||||||||||||||
---|---|---|---|---|---|---|---|---|---|---|---|---|---|---|---|---|---|---|---|---|---|---|---|---|---|---|---|---|
| ||||||||||||||||||||||||||||
Results: Democratic hold Democratic gain Republican hold | ||||||||||||||||||||||||||||
|
Elections in California |
---|
The 2016 California State Senate election were held on Tuesday, November 8, 2016, with the primary election on June 7, 2016. Voters in the 20 odd-numbered districts of the California State Senate elected their representatives. The elections coincided with the elections for other offices, including for U.S. President and the state assembly.
Only one seat changed hands: the 29th district, which belonged to outgoing former Republican Minority Leader Bob Huff. As a result of the pickup by Democrat Josh Newman, the California Democratic Party regained a two-thirds supermajority in the chamber that it had previously lost in 2014.
California State Senate elections, 2016 Primary election — June 7, 2016 | ||||||
---|---|---|---|---|---|---|
Party | Votes | Percentage | Candidates | Advancing to general | Seats contesting | |
Democratic | 2,724,063 | 66.59% | 42 | 25 | 20 | |
Republican | 1,353,572 | 33.09% | 25 | 14 | 14 | |
Libertarian | 13,065 | 0.32% | 2 | 1 | 1 | |
Totals | 4,090,700 | 100.00% | 69 | 40 | — |
California State Senate elections, 2016 General election — November 8, 2016 | ||||||||
---|---|---|---|---|---|---|---|---|
Party | Votes | Percentage | Not up | Contested | Before | After | +/– | |
Democratic | 4,769,557 | 67.48% | 11 | 15 | 26 | 27 | 1 | |
Republican | 2,250,103 | 31.84% | 9 | 5 | 14 | 13 | 1 | |
Libertarian | 48,316 | 0.68% | 0 | 0 | 0 | 0 | ||
Totals | 7,067,976 | 100.00% | 20 | 20 | 40 | 40 | — |
27 | 13 | ||
Democratic | Republican |
District 1 • District 3 • District 5 • District 7 • District 9 • District 11 • District 13 • District 15 • District 17 • District 19 • District 21 • District 23 • District 25 • District 27 • District 29 • District 31 • District 33 • District 35 • District 37 • District 39 |
Primary election | ||||
---|---|---|---|---|
Party | Candidate | Votes | % | |
Republican | Ted Gaines (incumbent) | 140,739 | 49.4 | |
Democratic | Rob Rowen | 104,262 | 36.6 | |
Republican | Steven Baird | 39,958 | 14.1 | |
Total votes | 284,959 | 100.0 | ||
General election | ||||
Republican | Ted Gaines (incumbent) | 287,314 | 64.0 | |
Democratic | Rob Rowen | 161,502 | 36.0 | |
Total votes | 448,816 | 100.0 | ||
Republican hold |
Primary election | ||||
---|---|---|---|---|
Party | Candidate | Votes | % | |
Democratic | Bill Dodd | 90,396 | 37.4 | |
Democratic | Mariko Yamada | 72,243 | 29.9 | |
Republican | Greg "Coach" Coppes | 54,525 | 22.6 | |
Democratic | Gabe Griess | 24,540 | 10.2 | |
Total votes | 241,704 | 100.0 | ||
General election | ||||
Democratic | Bill Dodd | 207,927 | 58.1 | |
Democratic | Mariko Yamada | 149,701 | 41.9 | |
Total votes | 357,628 | 100.0 | ||
Democratic hold |
Primary election | ||||
---|---|---|---|---|
Party | Candidate | Votes | % | |
Democratic | Cathleen Galgiani (incumbent) | 96,710 | 56.8 | |
Republican | Alan Nakanishi | 47,355 | 27.8 | |
Republican | Samuel Anderson | 26,343 | 15.5 | |
Total votes | 170,408 | 100.0 | ||
General election | ||||
Democratic | Cathleen Galgiani (incumbent) | 174,847 | 56.7 | |
Republican | Alan Nakanishi | 133,604 | 43.3 | |
Total votes | 308,451 | 100.0 | ||
Democratic hold |
Primary election | ||||
---|---|---|---|---|
Party | Candidate | Votes | % | |
Democratic | Steve Glazer (incumbent) | 122,186 | 54.3 | |
Republican | Joseph Alexander Rubay | 61,169 | 27.2 | |
Democratic | Guy Moore | 41,497 | 18.5 | |
Total votes | 224,852 | 100.0 | ||
General election | ||||
Democratic | Steve Glazer (incumbent) | 270,485 | 66.7 | |
Republican | Joseph Rubay | 135,122 | 33.3 | |
Total votes | 405,607 | 100.0 | ||
Democratic hold |
Primary election | ||||
---|---|---|---|---|
Party | Candidate | Votes | % | |
Democratic | Nancy Skinner | 116,710 | 47.8 | |
Democratic | Sandré Swanson | 74,365 | 30.5 | |
Democratic | Katherine Grace Welch | 32,698 | 13.4 | |
Republican | Rich Kinney | 20,287 | 8.3 | |
Total votes | 244,060 | 100.0 | ||
General election | ||||
Democratic | Nancy Skinner | 236,133 | 62.2 | |
Democratic | Sandré Swanson | 143,573 | 37.8 | |
Total votes | 379,706 | 100.0 | ||
Democratic hold |
Primary election | ||||
---|---|---|---|---|
Party | Candidate | Votes | % | |
Democratic | Jane Kim | 118,582 | 45.3 | |
Democratic | Scott Wiener | 117,913 | 45.1 | |
Republican | Ken Loo | 25,189 | 9.6 | |
Democratic | Michael A. Petrelis (write-in) | 4 | 0.0 | |
Total votes | 261,688 | 100.0 | ||
General election | ||||
Democratic | Scott Wiener | 209,462 | 51.0 | |
Democratic | Jane Kim | 201,316 | 49.0 | |
Total votes | 410,778 | 100.0 | ||
Democratic hold |
Primary election | ||||
---|---|---|---|---|
Party | Candidate | Votes | % | |
Democratic | Jerry Hill (incumbent) | 171,411 | 75.6 | |
Republican | Rick Ciardella | 42,185 | 18.6 | |
Libertarian | John H. Webster | 13,018 | 5.7 | |
Total votes | 226,614 | 100.0 | ||
General election | ||||
Democratic | Jerry Hill (incumbent) | 296,400 | 75.9 | |
Republican | Rick Ciardella | 94,269 | 24.1 | |
Total votes | 390,669 | 100.0 | ||
Democratic hold |
Primary election | ||||
---|---|---|---|---|
Party | Candidate | Votes | % | |
Democratic | Jim Beall (incumbent) | 97,948 | 49.4 | |
Democratic | Nora Campos | 53,250 | 26.9 | |
Republican | Chuck Page | 40,783 | 20.6 | |
Republican | Anthony Macias | 6,147 | 3.1 | |
Total votes | 198,128 | 100.0 | ||
General election | ||||
Democratic | Jim Beall (incumbent) | 196,089 | 62.5 | |
Democratic | Nora Campos | 117,442 | 37.5 | |
Total votes | 313,531 | 100.0 | ||
Democratic hold |
Primary election | ||||
---|---|---|---|---|
Party | Candidate | Votes | % | |
Democratic | Bill Monning (incumbent) | 185,586 | 68.8 | |
Republican | Palmer Kain | 84,142 | 31.2 | |
Total votes | 269,728 | 100.0 | ||
General election | ||||
Democratic | Bill Monning (incumbent) | 268,806 | 65.5 | |
Republican | Palmer Kain | 141,339 | 34.5 | |
Total votes | 410,145 | 100.0 | ||
Democratic hold |
Primary election | ||||
---|---|---|---|---|
Party | Candidate | Votes | % | |
Democratic | Hannah-Beth Jackson (incumbent) | 144,422 | 64.1 | |
Republican | Colin Patrick Walch | 80,765 | 35.9 | |
Total votes | 225,187 | 100.0 | ||
General election | ||||
Democratic | Hannah-Beth Jackson (incumbent) | 224,834 | 63.1 | |
Republican | Colin Patrick Walch | 131,598 | 37.3 | |
Total votes | 356,432 | 100.0 | ||
Democratic hold |
Primary election | ||||
---|---|---|---|---|
Party | Candidate | Votes | % | |
Republican | Scott Wilk | 69,403 | 46.7 | |
Democratic | Johnathon Levar Ervin | 50,078 | 33.7 | |
Democratic | Steve Hill | 17,735 | 11.9 | |
Republican | Star Moffatt | 11,439 | 7.7 | |
Total votes | 148,655 | 100.0 | ||
General election | ||||
Republican | Scott Wilk | 160,043 | 52.8 | |
Democratic | Johnathon Levar Ervin | 142,886 | 47.2 | |
Total votes | 302,929 | 100.0 | ||
Republican hold |
Primary election | ||||
---|---|---|---|---|
Party | Candidate | Votes | % | |
Republican | Mike Morrell (incumbent) | 93,484 | 54.8 | |
Democratic | Ronald J. O'Donnell | 50,850 | 29.8 | |
Democratic | Mark Westwood | 26,300 | 15.4 | |
Total votes | 170,634 | 100.0 | ||
General election | ||||
Republican | Mike Morrell (incumbent) | 184,470 | 56.6 | |
Democratic | Ronald J. O'Donnell | 141,533 | 43.4 | |
Total votes | 326,003 | 100.0 | ||
Republican hold |
Primary election | ||||
---|---|---|---|---|
Party | Candidate | Votes | % | |
Republican | Michael D. Antonovich | 85,663 | 39.5 | |
Democratic | Anthony Portantino | 58,154 | 26.8 | |
Democratic | Katherine Perez-Estolano | 31,166 | 14.4 | |
Democratic | Chris Chahinian | 14,849 | 6.8 | |
Democratic | Phlunte' Riddle | 14,563 | 6.7 | |
Democratic | Teddy Choi | 12,430 | 5.7 | |
Total votes | 216,825 | 100.0 | ||
General election | ||||
Democratic | Anthony Portantino | 218,655 | 57.8 | |
Republican | Michael D. Antonovich | 159,014 | 42.2 | |
Total votes | 377,256 | 100.0 | ||
Democratic hold |
Primary election | ||||
---|---|---|---|---|
Party | Candidate | Votes | % | |
Republican | Steve Fazio | 77,770 | 37.1 | |
Democratic | Henry Stern | 57,189 | 27.3 | |
Democratic | Janice Kamenir-Reznik | 40,250 | 19.2 | |
Democratic | David Pollock | 15,359 | 7.3 | |
Democratic | Shawn Bayliss | 12,757 | 6.1 | |
Democratic | George Christopher Thomas | 6,143 | 2.9 | |
Total votes | 209,468 | 100.0 | ||
General election | ||||
Democratic | Henry Stern | 218,655 | 55.9 | |
Republican | Steve Fazio | 172,827 | 44.1 | |
Total votes | 377,256 | 100.0 | ||
Democratic hold |
Primary election | ||||
---|---|---|---|---|
Party | Candidate | Votes | % | |
Republican | Ling Ling Chang | 73,514 | 44.0 | |
Democratic | Josh Newman | 48,754 | 29.2 | |
Democratic | Sukhee Kang | 44,766 | 26.8 | |
Total votes | 167,034 | 100.0 | ||
General election | ||||
Democratic | Josh Newman | 160,230 | 50.4 | |
Republican | Ling Ling Chang | 157,732 | 49.6 | |
Total votes | 317,962 | 100.0 | ||
Democratic gain from Republican | ||||
Primary election | ||||
---|---|---|---|---|
Party | Candidate | Votes | % | |
Democratic | Richard Roth (incumbent) | 81,504 | 61.2 | |
Republican | Richard Reed | 51,755 | 38.8 | |
Total votes | 133,259 | 100.0 | ||
General election | ||||
Democratic | Richard Roth (incumbent) | 167,574 | 60.5 | |
Republican | Richard Reed | 109,238 | 39.5 | |
Total votes | 276,812 | 100.0 | ||
Democratic hold |
Primary election | ||||
---|---|---|---|---|
Party | Candidate | Votes | % | |
Democratic | Ricardo Lara (incumbent) | 104,027 | 99.95 | |
Libertarian | Honor Mimi Robson (write-in) | 47 | 0.05 | |
Total votes | 104,074 | 100.00 | ||
General election | ||||
Democratic | Ricardo Lara (incumbent) | 177,971 | 78.6 | |
Libertarian | Honor Mimi Robson | 48,316 | 21.4 | |
Total votes | 226,287 | 100.0 | ||
Democratic hold |
Primary election | ||||
---|---|---|---|---|
Party | Candidate | Votes | % | |
Democratic | Steven Bradford | 50,998 | 35.6 | |
Democratic | Warren Furutani | 35,024 | 24.4 | |
Democratic | Isaac Galvan | 32,105 | 22.4 | |
Republican | Charlotte Ann Svolos | 25,197 | 17.6 | |
Total votes | 143,324 | 100.0 | ||
General election | ||||
Democratic | Steven Bradford | 135,353 | 53.5 | |
Democratic | Warren Furutani | 117,455 | 46.5 | |
Total votes | 252,808 | 100.0 | ||
Democratic hold |
Primary election | ||||
---|---|---|---|---|
Party | Candidate | Votes | % | |
Republican | John Moorlach (incumbent) | 114,540 | 54.8 | |
Democratic | Ari Grayson | 94,369 | 45.2 | |
Total votes | 208,909 | 100.0 | ||
General election | ||||
Republican | John Moorlach (incumbent) | 228,480 | 57.0 | |
Democratic | Ari Grayson | 172,455 | 43.0 | |
Total votes | 400,935 | 100.0 | ||
Republican hold |
Primary election | ||||
---|---|---|---|---|
Party | Candidate | Votes | % | |
Democratic | Toni Atkins | 159,970 | 66.3 | |
Republican | John Renison | 43,760 | 18.1 | |
Republican | J. Bribiesca | 26,565 | 11.0 | |
Republican | Richard M. Fago | 10,895 | 4.5 | |
Total votes | 241,190 | 100.0 | ||
General election | ||||
Democratic | Toni Atkins | 258,686 | 62.5 | |
Republican | John Renison | 155,053 | 37.5 | |
Total votes | 413,739 | 100.0 | ||
Democratic hold |
The California State Senate is the upper house of the California State Legislature, the lower house being the California State Assembly. The State Senate convenes, along with the State Assembly, at the California State Capitol in Sacramento.
Elections in California are held to fill various local, state and federal seats. In California, regular elections are held every even year ; however, some seats have terms of office that are longer than two years, so not every seat is on the ballot in every election. Special elections may be held to fill vacancies at other points in time. Recall elections can also be held. Additionally, statewide initiatives, legislative referrals and referenda may be on the ballot.
California's 28th congressional district is a congressional district in the U.S. state of California, in Los Angeles County. The district is regarded as a Democratic stronghold and has been held by the Democratic Party since 2003 and is currently represented by Democrat Adam Schiff.
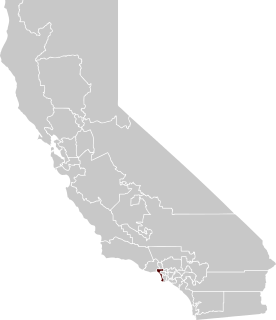
California's 52nd congressional district is a congressional district in the U.S. state of California. The district is currently represented by Democrat Scott Peters.
California's 1st State Senate District is one of 40 California State Senate districts. Republican Brian Dahle represents the district, having won the seat in a June 2019 special election after Republican Ted Gaines of El Dorado Hills resigned to become a member of the California Board of Equalization in January 2019.
California's 3rd State Senate district is one of 40 California State Senate districts. It is currently represented by Democrat Bill Dodd of Napa.
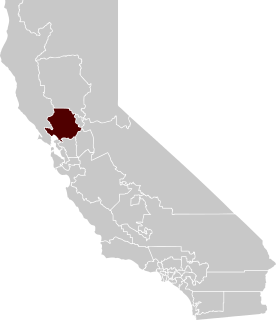
California's 5th State Senate district is one of 40 California State Senate districts. It is currently represented by Democrat Susan Eggman.
California's 11th State Senate district is one of 40 California State Senate districts. It is currently represented by Democrat Scott Wiener of San Francisco.
The 2004 California State Senate elections were held on November 2, 2004. Senate seats of odd-numbered districts were up for election. Senate terms are staggered so that half the membership is elected every two years. Senators serve four-year terms and are limited to two terms. As was expected, the Democratic Party held on to the majority of the seats.
The 2002 California State Senate elections were held on November 5, 2002. Senate seats of even-numbered districts were up for election. Senate terms are staggered so that half the membership is elected every two years. Senators serve four-year terms and are limited to two terms. As was expected, the Democratic Party held on to the majority of the seats, though they lost one.
The 2000 California State Senate elections were held on November 7, 2000. Senate seats of odd-numbered districts were up for election. Senate terms are staggered so that half the membership is elected every two years. Senators serve four-year terms and are limited to two terms. The Democratic Party held on to the majority of the seats, gaining one seat in the process.
California's 26th State Senate district is one of 40 California State Senate districts. It is currently represented by Democrat Ben Allen of Santa Monica.
California's 36th State Senate district is one of 40 California State Senate districts. It is currently represented by Republican Patricia Bates of Laguna Niguel.
The 1994 California State Senate elections were held on November 8, 1994. Senate seats of even-numbered districts were up for election. Senate terms are staggered so that half the membership is elected every two years. Senators serve four-year terms and are limited to two terms. The Democrats lost two seats to the Republicans, but maintained a majority in the Senate.
The 1998 California State Senate elections were held on November 3, 1998. Senate seats of even-numbered districts were up for election. Senate terms are staggered so that half the membership is elected every two years. Senators serve four-year terms and are limited to two terms. Democrats expanded their majority, winning a Republican-held seat and an Independent-held seat.
The California state elections, June 2010 were held on June 8, 2010 and included five propositions and two special elections, one for a State Senate seat and the other for a State Assembly seat. Primary elections for all statewide offices, a seat to the United States Senate, all Californian seats to the House of Representatives, all of the seats of the State Assembly, and all even-numbered seats of the State Senate, along with the first round election for the nonpartisan Superintendent of Public Instruction were also held.
The 2016 California State Assembly election was held on Tuesday, November 8, 2016, with the primary election held on June 7, 2016. Voters in the 80 districts of the California State Assembly elected their representatives. The elections coincided with the elections for other offices, including for U.S. President and the state senate.
The 2022 United States elections will be held on Tuesday, November 8, 2022. During this midterm election year, all 435 seats in the House of Representatives and 35 of the 100 seats in the Senate will be contested. Thirty-nine state and territorial gubernatorial and numerous other state and local elections will also be contested. This will be the first election affected by the redistricting that will follow the 2020 census.
The 2018 California State Senate elections were held on Tuesday, November 6, 2018, with the primary election being held on June 5, 2018. Voters in the 20 even-numbered districts of the California State Senate elected their representatives. The elections coincided with the elections of other offices, including for governor and the California State Assembly.
The 2020 California State Senate election was held on Tuesday, November 3, 2020, with the primary election scheduled for March 3, 2020. Voters in the 20 odd-numbered districts of the California State Senate elected their representatives. The elections coincided with the elections for other offices, including for U.S. President and the state assembly.