Cladogram

Last updated
A horizontal cladogram, with the root to the left Cladogram-example1.svg
A horizontal cladogram, with the root to the left
Two vertical cladograms, the root at the bottom Identical cladograms.svg
Two vertical cladograms, the root at the bottom

A cladogram (from Greek clados "branch" and gramma "character") is a diagram used in cladistics to show relations among organisms. A cladogram is not, however, an evolutionary tree because it does not show how ancestors are related to descendants, nor does it show how much they have changed, so many differing evolutionary trees can be consistent with the same cladogram. [1] [2] [3] [4] [5] A cladogram uses lines that branch off in different directions ending at a clade, a group of organisms with a last common ancestor. There are many shapes of cladograms but they all have lines that branch off from other lines. The lines can be traced back to where they branch off. These branching off points represent a hypothetical ancestor (not an actual entity) which can be inferred to exhibit the traits shared among the terminal taxa above it. [4] [6] This hypothetical ancestor might then provide clues about the order of evolution of various features, adaptation, and other evolutionary narratives about ancestors. Although traditionally such cladograms were generated largely on the basis of morphological characters, DNA and RNA sequencing data and computational phylogenetics are now very commonly used in the generation of cladograms, either on their own or in combination with morphology.

Contents

Generating a cladogram

Cladogram of birds Cladogram Amniota B.png
Cladogram of birds

Molecular versus morphological data

The characteristics used to create a cladogram can be roughly categorized as either morphological (synapsid skull, warm blooded, notochord, unicellular, etc.) or molecular (DNA, RNA, or other genetic information). [7] Prior to the advent of DNA sequencing, cladistic analysis primarily used morphological data. Behavioral data (for animals) may also be used. [8]

As DNA sequencing has become cheaper and easier, molecular systematics has become a more and more popular way to infer phylogenetic hypotheses. [9] Using a parsimony criterion is only one of several methods to infer a phylogeny from molecular data. Approaches such as maximum likelihood, which incorporate explicit models of sequence evolution, are non-Hennigian ways to evaluate sequence data. Another powerful method of reconstructing phylogenies is the use of genomic retrotransposon markers, which are thought to be less prone to the problem of reversion that plagues sequence data. They are also generally assumed to have a low incidence of homoplasies because it was once thought that their integration into the genome was entirely random; this seems at least sometimes not to be the case, however.

Apomorphy in cladistics. This diagram indicates "A" and "C" as ancestral states, and "B", "D" and "E" as states that are present in terminal taxa. Note that in practice, ancestral conditions are not known a priori (as shown in this heuristic example), but must be inferred from the pattern of shared states observed in the terminals. Given that each terminal in this example has a unique state, in reality we would not be able to infer anything conclusive about the ancestral states (other than the fact that the existence of unobserved states "A" and "C" would be unparsimonious inferences!) Cladistics-Apomorphy.png
Apomorphy in cladistics. This diagram indicates "A" and "C" as ancestral states, and "B", "D" and "E" as states that are present in terminal taxa. Note that in practice, ancestral conditions are not known a priori (as shown in this heuristic example), but must be inferred from the pattern of shared states observed in the terminals. Given that each terminal in this example has a unique state, in reality we would not be able to infer anything conclusive about the ancestral states (other than the fact that the existence of unobserved states "A" and "C" would be unparsimonious inferences!)

Plesiomorphies and synapomorphies

Researchers must decide which character states are "ancestral" ( plesiomorphies ) and which are derived ( synapomorphies ), because only synapomorphic character states provide evidence of grouping. [10] This determination is usually done by comparison to the character states of one or more outgroups. States shared between the outgroup and some members of the in-group are symplesiomorphies; states that are present only in a subset of the in-group are synapomorphies. Note that character states unique to a single terminal (autapomorphies) do not provide evidence of grouping. The choice of an outgroup is a crucial step in cladistic analysis because different outgroups can produce trees with profoundly different topologies.

Homoplasies

A homoplasy is a character state that is shared by two or more taxa due to some cause other than common ancestry. [11] The two main types of homoplasy are convergence (evolution of the "same" character in at least two distinct lineages) and reversion (the return to an ancestral character state). Characters that are obviously homoplastic, such as white fur in different lineages of Arctic mammals, should not be included as a character in a phylogenetic analysis as they do not contribute anything to our understanding of relationships. However, homoplasy is often not evident from inspection of the character itself (as in DNA sequence, for example), and is then detected by its incongruence (unparsimonious distribution) on a most-parsimonious cladogram. Note that characters that are homoplastic may still contain phylogenetic signal. [12]

A well-known example of homoplasy due to convergent evolution would be the character, "presence of wings". Although the wings of birds, bats, and insects serve the same function, each evolved independently, as can be seen by their anatomy. If a bird, bat, and a winged insect were scored for the character, "presence of wings", a homoplasy would be introduced into the dataset, and this could potentially confound the analysis, possibly resulting in a false hypothesis of relationships. Of course, the only reason a homoplasy is recognizable in the first place is because there are other characters that imply a pattern of relationships that reveal its homoplastic distribution.

What is not a cladogram

A cladogram is the diagrammatic result of an analysis, which groups taxa on the basis of synapomorphies alone. There are many other phylogenetic algorithms that treat data somewhat differently, and result in phylogenetic trees that look like cladograms but are not cladograms. For example, phenetic algorithms, such as UPGMA and Neighbor-Joining, group by overall similarity, and treat both synapomorphies and symplesiomorphies as evidence of grouping, The resulting diagrams are phenograms, not cladograms, Similarly, the results of model-based methods (Maximum Likelihood or Bayesian approaches) that take into account both branching order and "branch length," count both synapomorphies and autapomorphies as evidence for or against grouping, The diagrams resulting from those sorts of analysis are not cladograms, either. [13]

Cladogram selection

There are several algorithms available to identify the "best" cladogram. [14] Most algorithms use a metric to measure how consistent a candidate cladogram is with the data. Most cladogram algorithms use the mathematical techniques of optimization and minimization.

In general, cladogram generation algorithms must be implemented as computer programs, although some algorithms can be performed manually when the data sets are modest (for example, just a few species and a couple of characteristics).

Some algorithms are useful only when the characteristic data are molecular (DNA, RNA); other algorithms are useful only when the characteristic data are morphological. Other algorithms can be used when the characteristic data includes both molecular and morphological data.

Algorithms for cladograms or other types of phylogenetic trees include least squares, neighbor-joining, parsimony, maximum likelihood, and Bayesian inference.

Biologists sometimes use the term parsimony for a specific kind of cladogram generation algorithm and sometimes as an umbrella term for all phylogenetic algorithms. [15]

Algorithms that perform optimization tasks (such as building cladograms) can be sensitive to the order in which the input data (the list of species and their characteristics) is presented. Inputting the data in various orders can cause the same algorithm to produce different "best" cladograms. In these situations, the user should input the data in various orders and compare the results.

Using different algorithms on a single data set can sometimes yield different "best" cladograms, because each algorithm may have a unique definition of what is "best".

Because of the astronomical number of possible cladograms, algorithms cannot guarantee that the solution is the overall best solution. A nonoptimal cladogram will be selected if the program settles on a local minimum rather than the desired global minimum. [16] To help solve this problem, many cladogram algorithms use a simulated annealing approach to increase the likelihood that the selected cladogram is the optimal one. [17]

The basal position is the direction of the base (or root) of a rooted phylogenetic tree or cladogram. A basal clade is the earliest clade (of a given taxonomic rank[a]) to branch within a larger clade.

Statistics

Incongruence length difference test (or partition homogeneity test)

The incongruence length difference test (ILD) is a measurement of how the combination of different datasets (e.g. morphological and molecular, plastid and nuclear genes) contributes to a longer tree. It is measured by first calculating the total tree length of each partition and summing them. Then replicates are made by making randomly assembled partitions consisting of the original partitions. The lengths are summed. A p value of 0.01 is obtained for 100 replicates if 99 replicates have longer combined tree lengths.

Measuring homoplasy

Some measures attempt to measure the amount of homoplasy in a dataset with reference to a tree, [18] though it is not necessarily clear precisely what property these measures aim to quantify [19]

Consistency index

The consistency index (CI) measures the consistency of a tree to a set of data – a measure of the minimum amount of homoplasy implied by the tree. [20] It is calculated by counting the minimum number of changes in a dataset and dividing it by the actual number of changes needed for the cladogram. [20] A consistency index can also be calculated for an individual character i, denoted ci.

Besides reflecting the amount of homoplasy, the metric also reflects the number of taxa in the dataset, [21] (to a lesser extent) the number of characters in a dataset, [22] the degree to which each character carries phylogenetic information, [23] and the fashion in which additive characters are coded, rendering it unfit for purpose. [24]

ci occupies a range from 1 to 1/[n.taxa/2] in binary characters with an even state distribution; its minimum value is larger when states are not evenly spread. [23] [18] In general, for a binary or non-binary character with , ci occupies a range from 1 to . [23]

Retention index

The retention index (RI) was proposed as an improvement of the CI "for certain applications" [25] This metric also purports to measure of the amount of homoplasy, but also measures how well synapomorphies explain the tree. It is calculated taking the (maximum number of changes on a tree minus the number of changes on the tree), and dividing by the (maximum number of changes on the tree minus the minimum number of changes in the dataset).

The rescaled consistency index (RC) is obtained by multiplying the CI by the RI; in effect this stretches the range of the CI such that its minimum theoretically attainable value is rescaled to 0, with its maximum remaining at 1. [18] [25] The homoplasy index (HI) is simply 1 CI.

Homoplasy Excess Ratio

This measures the amount of homoplasy observed on a tree relative to the maximum amount of homoplasy that could theoretically be present – 1 (observed homoplasy excess) / (maximum homoplasy excess). [22] A value of 1 indicates no homoplasy; 0 represents as much homoplasy as there would be in a fully random dataset, and negative values indicate more homoplasy still (and tend only to occur in contrived examples). [22] The HER is presented as the best measure of homoplasy currently available. [18] [26]

See also

Related Research Articles

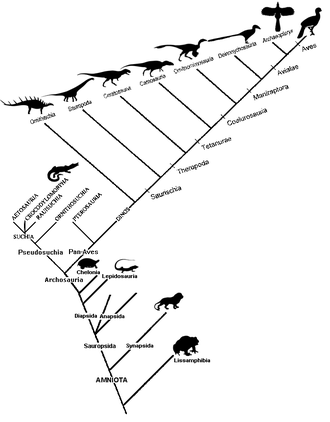
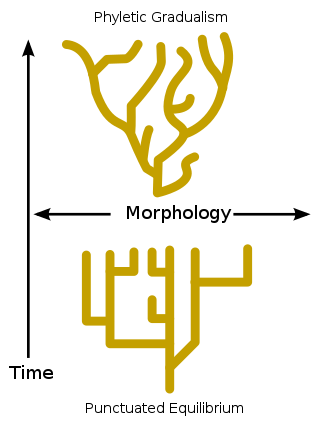
Cladistics is an approach to biological classification in which organisms are categorized in groups ("clades") based on hypotheses of most recent common ancestry. The evidence for hypothesized relationships is typically shared derived characteristics (synapomorphies) that are not present in more distant groups and ancestors. However, from an empirical perspective, common ancestors are inferences based on a cladistic hypothesis of relationships of taxa whose character states can be observed. Theoretically, a last common ancestor and all its descendants constitute a (minimal) clade. Importantly, all descendants stay in their overarching ancestral clade. For example, if the terms worms or fishes were used within a strict cladistic framework, these terms would include humans. Many of these terms are normally used paraphyletically, outside of cladistics, e.g. as a 'grade', which are fruitless to precisely delineate, especially when including extinct species. Radiation results in the generation of new subclades by bifurcation, but in practice sexual hybridization may blur very closely related groupings.

In biology, phylogenetics is the study of the evolutionary history and relationships among or within groups of organisms. These relationships are determined by phylogenetic inference, methods that focus on observed heritable traits, such as DNA sequences, protein amino acid sequences, or morphology. The result of such an analysis is a phylogenetic tree—a diagram containing a hypothesis of relationships that reflects the evolutionary history of a group of organisms.

A phylogenetic tree, phylogeny or evolutionary tree is a graphical representation which shows the evolutionary history between a set of species or taxa during a specific time. In other words, it is a branching diagram or a tree showing the evolutionary relationships among various biological species or other entities based upon similarities and differences in their physical or genetic characteristics. In evolutionary biology, all life on Earth is theoretically part of a single phylogenetic tree, indicating common ancestry. Phylogenetics is the study of phylogenetic trees. The main challenge is to find a phylogenetic tree representing optimal evolutionary ancestry between a set of species or taxa. Computational phylogenetics focuses on the algorithms involved in finding optimal phylogenetic tree in the phylogenetic landscape.

Molecular phylogenetics is the branch of phylogeny that analyzes genetic, hereditary molecular differences, predominantly in DNA sequences, to gain information on an organism's evolutionary relationships. From these analyses, it is possible to determine the processes by which diversity among species has been achieved. The result of a molecular phylogenetic analysis is expressed in a phylogenetic tree. Molecular phylogenetics is one aspect of molecular systematics, a broader term that also includes the use of molecular data in taxonomy and biogeography.

<span class="mw-page-title-main">Phylogenesis</span>

Phylogenesis is the biological process by which a taxon appears. The science that studies these processes is called phylogenetics.

Evolutionary taxonomy, evolutionary systematics or Darwinian classification is a branch of biological classification that seeks to classify organisms using a combination of phylogenetic relationship, progenitor-descendant relationship, and degree of evolutionary change. This type of taxonomy may consider whole taxa rather than single species, so that groups of species can be inferred as giving rise to new groups. The concept found its most well-known form in the modern evolutionary synthesis of the early 1940s.

<span class="mw-page-title-main">Outgroup (cladistics)</span>

In cladistics or phylogenetics, an outgroup is a more distantly related group of organisms that serves as a reference group when determining the evolutionary relationships of the ingroup, the set of organisms under study, and is distinct from sociological outgroups. The outgroup is used as a point of comparison for the ingroup and specifically allows for the phylogeny to be rooted. Because the polarity (direction) of character change can be determined only on a rooted phylogeny, the choice of outgroup is essential for understanding the evolution of traits along a phylogeny.

<span class="mw-page-title-main">Apomorphy and synapomorphy</span> Two concepts on heritable traits

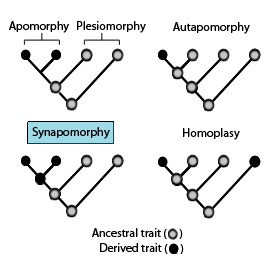
In phylogenetics, an apomorphy is a novel character or character state that has evolved from its ancestral form. A synapomorphy is an apomorphy shared by two or more taxa and is therefore hypothesized to have evolved in their most recent common ancestor. In cladistics, synapomorphy implies homology.

In phylogenetics and computational phylogenetics, maximum parsimony is an optimality criterion under which the phylogenetic tree that minimizes the total number of character-state changes. Under the maximum-parsimony criterion, the optimal tree will minimize the amount of homoplasy. In other words, under this criterion, the shortest possible tree that explains the data is considered best. Some of the basic ideas behind maximum parsimony were presented by James S. Farris in 1970 and Walter M. Fitch in 1971.

In phylogenetics, long branch attraction (LBA) is a form of systematic error whereby distantly related lineages are incorrectly inferred to be closely related. LBA arises when the amount of molecular or morphological change accumulated within a lineage is sufficient to cause that lineage to appear similar to another long-branched lineage, solely because they have both undergone a large amount of change, rather than because they are related by descent. Such bias is more common when the overall divergence of some taxa results in long branches within a phylogeny. Long branches are often attracted to the base of a phylogenetic tree, because the lineage included to represent an outgroup is often also long-branched. The frequency of true LBA is unclear and often debated, and some authors view it as untestable and therefore irrelevant to empirical phylogenetic inference. Although often viewed as a failing of parsimony-based methodology, LBA could in principle result from a variety of scenarios and be inferred under multiple analytical paradigms.

Computational phylogenetics, phylogeny inference, or phylogenetic inference focuses on computational and optimization algorithms, heuristics, and approaches involved in phylogenetic analyses. The goal is to find a phylogenetic tree representing optimal evolutionary ancestry between a set of genes, species, or taxa. Maximum likelihood, parsimony, Bayesian, and minimum evolution are typical optimality criteria used to assess how well a phylogenetic tree topology describes the sequence data. Nearest Neighbour Interchange (NNI), Subtree Prune and Regraft (SPR), and Tree Bisection and Reconnection (TBR), known as tree rearrangements, are deterministic algorithms to search for optimal or the best phylogenetic tree. The space and the landscape of searching for the optimal phylogenetic tree is known as phylogeny search space.

<span class="mw-page-title-main">Autapomorphy</span> Distinctive feature, known as a derived trait, that is unique to a given taxon

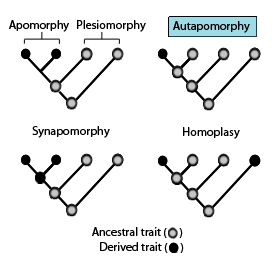
In phylogenetics, an autapomorphy is a distinctive feature, known as a derived trait, that is unique to a given taxon. That is, it is found only in one taxon, but not found in any others or outgroup taxa, not even those most closely related to the focal taxon. It can therefore be considered an apomorphy in relation to a single taxon. The word autapomorphy, introduced in 1950 by German entomologist Willi Hennig, is derived from the Greek words αὐτός, autos "self"; ἀπό, apo "away from"; and μορφή, morphḗ = "shape".

Ancestral reconstruction is the extrapolation back in time from measured characteristics of individuals, populations, or specie to their common ancestors. It is an important application of phylogenetics, the reconstruction and study of the evolutionary relationships among individuals, populations or species to their ancestors. In the context of evolutionary biology, ancestral reconstruction can be used to recover different kinds of ancestral character states of organisms that lived millions of years ago. These states include the genetic sequence, the amino acid sequence of a protein, the composition of a genome, a measurable characteristic of an organism (phenotype), and the geographic range of an ancestral population or species. This is desirable because it allows us to examine parts of phylogenetic trees corresponding to the distant past, clarifying the evolutionary history of the species in the tree. Since modern genetic sequences are essentially a variation of ancient ones, access to ancient sequences may identify other variations and organisms which could have arisen from those sequences. In addition to genetic sequences, one might attempt to track the changing of one character trait to another, such as fins turning to legs.

Bayesian inference of phylogeny combines the information in the prior and in the data likelihood to create the so-called posterior probability of trees, which is the probability that the tree is correct given the data, the prior and the likelihood model. Bayesian inference was introduced into molecular phylogenetics in the 1990s by three independent groups: Bruce Rannala and Ziheng Yang in Berkeley, Bob Mau in Madison, and Shuying Li in University of Iowa, the last two being PhD students at the time. The approach has become very popular since the release of the MrBayes software in 2001, and is now one of the most popular methods in molecular phylogenetics.

Distance matrices are used in phylogeny as non-parametric distance methods and were originally applied to phenetic data using a matrix of pairwise distances. These distances are then reconciled to produce a tree. The distance matrix can come from a number of different sources, including measured distance or morphometric analysis, various pairwise distance formulae applied to discrete morphological characters, or genetic distance from sequence, restriction fragment, or allozyme data. For phylogenetic character data, raw distance values can be calculated by simply counting the number of pairwise differences in character states.

Quantitative comparative linguistics is the use of quantitative analysis as applied to comparative linguistics. Examples include the statistical fields of lexicostatistics and glottochronology, and the borrowing of phylogenetics from biology.

Implied weighting describes a group of methods used in phylogenetic analysis to assign the greatest importance to characters that are most likely to be homologous. These are a posteriori methods, which include also dynamic weighting, as opposed to a priori methods, which include adaptive, independent, and chemical categories.

<span class="mw-page-title-main">Character evolution</span>

Character evolution is the process by which a character or trait evolves along the branches of an evolutionary tree. Character evolution usually refers to single changes within a lineage that make this lineage unique from others. These changes are called character state changes and they are often used in the study of evolution to provide a record of common ancestry. Character state changes can be phenotypic changes, nucleotide substitutions, or amino acid substitutions. These small changes in a species can be identifying features of when exactly a new lineage diverged from an old one.

<span class="mw-page-title-main">Homoplasy</span> Gain or loss of the same feature independently in separate lineages during evolution

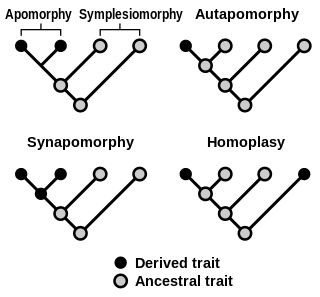
Homoplasy, in biology and phylogenetics, is the term used to describe a feature that has been gained or lost independently in separate lineages over the course of evolution. This is different from homology, which is the term used to characterize the similarity of features that can be parsimoniously explained by common ancestry. Homoplasy can arise from both similar selection pressures acting on adapting species, and the effects of genetic drift.

Minimum evolution is a distance method employed in phylogenetics modeling. It shares with maximum parsimony the aspect of searching for the phylogeny that has the shortest total sum of branch lengths.

References

  1. Mayr, Ernst (2009). "Cladistic analysis or cladistic classification?". Journal of Zoological Systematics and Evolutionary Research. 12: 94–128. doi: 10.1111/j.1439-0469.1974.tb00160.x .
  2. Foote, Mike (Spring 1996). "On the Probability of Ancestors in the Fossil Record". Paleobiology. 22 (2): 141–51. doi:10.1017/S0094837300016146. JSTOR   2401114. S2CID   89032582.
  3. Dayrat, Benoît (Summer 2005). "Ancestor-Descendant Relationships and the Reconstruction of the Tree of Life". Paleobiology. 31 (3): 347–53. doi:10.1666/0094-8373(2005)031[0347:aratro]2.0.co;2. JSTOR   4096939. S2CID   54988538.
  4. 1 2 Posada, David; Crandall, Keith A. (2001). "Intraspecific gene genealogies: Trees grafting into networks". Trends in Ecology & Evolution. 16 (1): 37–45. doi:10.1016/S0169-5347(00)02026-7. PMID   11146143.
  5. Podani, János (2013). "Tree thinking, time and topology: Comments on the interpretation of tree diagrams in evolutionary/phylogenetic systematics" (PDF). Cladistics. 29 (3): 315–327. doi:10.1111/j.1096-0031.2012.00423.x. PMID   34818822. S2CID   53357985. Archived (PDF) from the original on 2017-09-21.
  6. Schuh, Randall T. (2000). Biological Systematics: Principles and Applications. ISBN   978-0-8014-3675-8.[ page needed ]
  7. DeSalle, Rob (2002). Techniques in Molecular Systematics and Evolution. Birkhauser. ISBN   978-3-7643-6257-7.[ page needed ]
  8. Wenzel, John W. (1992). "Behavioral homology and phylogeny". Annu. Rev. Ecol. Syst. 23: 361–381. doi:10.1146/annurev.es.23.110192.002045.
  9. Hillis, David (1996). Molecular Systematics. Sinaur. ISBN   978-0-87893-282-5.[ page needed ]
  10. Hennig, Willi (1966). Phylogenetic Systematics. University of Illinois Press.
  11. West-Eberhard, Mary Jane (2003). Developmental Plasticity and Evolution . Oxford Univ. Press. pp.  353–376. ISBN   978-0-19-512235-0.
  12. Kalersjo, Mari; Albert, Victor A.; Farris, James S. (1999). "Homoplasy Increases Phylogenetic Structure". Cladistics. 15: 91–93. doi:10.1111/j.1096-0031.1999.tb00400.x. S2CID   85905559.
  13. Brower, Andrew V.Z. (2016). "What is a cladogram and what is not?". Cladistics. 32 (5): 573–576. doi: 10.1111/cla.12144 . PMID   34740305. S2CID   85725091.
  14. Kitching, Ian (1998). Cladistics: The Theory and Practice of Parsimony Analysis. Oxford University Press. ISBN   978-0-19-850138-1.[ page needed ]
  15. Stewart, Caro-Beth (1993). "The powers and pitfalls of parsimony". Nature. 361 (6413): 603–7. Bibcode:1993Natur.361..603S. doi:10.1038/361603a0. PMID   8437621. S2CID   4350103.
  16. Foley, Peter (1993). Cladistics: A Practical Course in Systematics. Oxford Univ. Press. p.  66. ISBN   978-0-19-857766-9.
  17. Nixon, Kevin C. (1999). "The Parsimony Ratchet, a New Method for Rapid Parsimony Analysis". Cladistics. 15 (4): 407–414. doi:10.1111/j.1096-0031.1999.tb00277.x. PMID   34902938. S2CID   85720264.
  18. 1 2 3 4 reviewed in Archie, James W. (1996). "Measures of Homoplasy". In Sanderson, Michael J.; Hufford, Larry (eds.). Homoplasy . pp.  153–188. doi:10.1016/B978-012618030-5/50008-3. ISBN   9780126180305.
  19. Chang, Joseph T.; Kim, Junhyong (1996). "The Measurement of Homoplasy: A Stochastic View". Homoplasy. pp. 189–203. doi:10.1016/b978-012618030-5/50009-5. ISBN   9780126180305.
  20. 1 2 Kluge, A. G.; Farris, J. S. (1969). "Quantitative Phyletics and the Evolution of Anurans". Systematic Zoology. 18 (1): 1–32. doi:10.2307/2412407. JSTOR   2412407.
  21. Archie, J. W.; Felsenstein, J. (1993). "The Number of Evolutionary Steps on Random and Minimum Length Trees for Random Evolutionary Data". Theoretical Population Biology. 43: 52–79. doi:10.1006/tpbi.1993.1003.
  22. 1 2 3 Archie, J. W. (1989). "Homoplasy Excess Ratios: New Indices for Measuring Levels of Homoplasy in Phylogenetic Systematics and a Critique of the Consistency Index". Systematic Zoology. 38 (3): 253–269. doi:10.2307/2992286. JSTOR   2992286.
  23. 1 2 3 Hoyal Cuthill, Jennifer F.; Braddy, Simon J.; Donoghue, Philip C. J. (2010). "A formula for maximum possible steps in multistate characters: Isolating matrix parameter effects on measures of evolutionary convergence". Cladistics. 26 (1): 98–102. doi: 10.1111/j.1096-0031.2009.00270.x . PMID   34875753. S2CID   53320612.
  24. Sanderson, M. J.; Donoghue, M. J. (1989). "Patterns of variations in levels of homoplasy". Evolution. 43 (8): 1781–1795. doi:10.2307/2409392. JSTOR   2409392. PMID   28564338.
  25. 1 2 Farris, J. S. (1989). "The retention index and the rescaled consistency index". Cladistics. 5 (4): 417–419. doi:10.1111/j.1096-0031.1989.tb00573.x. PMID   34933481. S2CID   84287895.
  26. Hoyal Cuthill, Jennifer (2015). "The size of the character state space affects the occurrence and detection of homoplasy: Modelling the probability of incompatibility for unordered phylogenetic characters". Journal of Theoretical Biology. 366: 24–32. Bibcode:2015JThBi.366...24H. doi:10.1016/j.jtbi.2014.10.033. PMID   25451518.