1940 United States presidential election in Illinois

Last updated

1940 United States presidential election in Illinois
Flag of Illinois (1915-1969).svg
  1936 November 5, 1940 [1] 1944  

All 29 Illinois votes to the Electoral College
  FDRoosevelt1938.png WendellWillkie.jpg
Nominee Franklin D. Roosevelt Wendell Willkie
Party Democratic Republican
Home state New York New York
Running mate Henry A. Wallace Charles L. McNary
Electoral vote290
Popular vote2,149,9342,047,240
Percentage50.97%48.54%

Illinois Presidential Election Results 1940.svg
County Results

President before election

Franklin D. Roosevelt
Democratic

Elected President

Franklin D. Roosevelt
Democratic

The 1940 United States presidential election in Illinois took place on November 5, 1940, as part of the 1940 United States presidential election. State voters chose 29 [2] representatives, or electors, to the Electoral College, who voted for president and vice president.

Contents

Illinois was won by incumbent President Franklin D. Roosevelt (DNew York), running with Secretary Henry A. Wallace, with 50.97% of the popular vote, against Wendell Willkie (RNew York), running with Minority Leader Charles L. McNary, with 48.54% of the popular vote. [3] [4]

Primaries

The primaries and general elections coincided with those for other federal offices (Senate and House), as well as those for state offices. [5]

Turnout

The total vote in the state-run primary elections (Democratic and Republican) was 2,365,144. [5]

The total vote in the general election was 4,217,935. [5] Both major parties held non-binding state-run preferential primaries on April 9. [5]

Democratic

1940 Illinois Democratic presidential primary
Flag of Illinois.svg
  1936 April 9, 1940 (1940-04-09) 1944  
  FDR in 1933 (1).jpg John Nance Garner (a).jpg
Candidate Franklin D. Roosevelt John Nance Garner
Home state New York Texas
Popular vote1,176,531190,801
Percentage86.04%13.95%

The 1940 Illinois Democratic presidential primary was held on April 9, 1940, in the U.S. state of Illinois as one of the Democratic Party's state primaries ahead of the 1940 presidential election.

The popular vote was a non-binding "beauty contest". Delegates were instead elected by direct votes by congressional district on delegate candidates. [5]

1940 Illinois Democratic presidential primary [5]
CandidateVotes%
Franklin D. Roosevelt 1,176,53186.04
John Nance Garner 190,80113.95
Scattering350.00
Total1,367,367100

Republican

1940 Illinois Republican presidential primary
Flag of Illinois.svg
  1936 April 9, 1940 (1940-04-09) 1944  
  Thomas Dewey.jpg
Candidate Thomas E. Dewey
Home state New York
Popular vote997,225
Percentage99.95%

The 1940 Illinois Republican presidential primary was held on April 9, 1940, in the U.S. state of Illinois as one of the Republican Party's state primaries ahead of the 1940 presidential election.

The preference vote was a "beauty contest". Delegates were instead selected by direct-vote in each congressional districts on delegate candidates. [5]

1940 Illinois Republican presidential primary [5]
CandidateVotes%
Thomas E. Dewey 997,22599.95
Scattering5520.06
Total997,777100

Results

1940 United States presidential election in Illinois [5]
PartyCandidateVotes%
Democratic Franklin D. Roosevelt (inc.) 2,149,934 50.97%
Republican Wendell Willkie 2,047,24048.54%
Socialist Norman Thomas 10,9140.26%
Prohibition Roger W. Babson 9,1900.22%
Write-in 6570.02%
Total votes4,217,935 100%

Results by county

CountyFranklin Delano Roosevelt
Democratic
Wendell Lewis Willkie
Republican
Normal Mattoon Thomas
Socialist
Various candidates
Other parties
MarginTotal votes cast [6]
# %# %# %# %# %
Adams 17,36147.78%18,48050.86%1190.33%3731.03%-1,119-3.08%36,333
Alexander 6,59150.75%6,26048.20%690.53%680.52%3312.55%12,988
Bond 3,37640.75%4,75457.38%200.24%1351.63%-1,378-16.63%8,285
Boone 2,27726.38%6,33073.33%110.13%140.16%-4,053-46.95%8,632
Brown 2,47853.31%2,10145.20%10.02%681.46%3778.11%4,648
Bureau 8,27438.29%13,25861.36%460.21%290.13%-4,984-23.07%21,607
Calhoun 1,62539.08%2,51660.51%110.26%60.14%-891-21.43%4,158
Carroll 3,59235.87%6,39863.90%80.08%150.15%-2,806-28.02%10,013
Cass 4,85451.55%4,49047.68%300.32%420.45%3643.87%9,416
Champaign 17,56346.04%20,31453.26%1650.43%1020.27%-2,751-7.21%38,144
Christian 11,45752.41%10,25546.91%500.23%1000.46%1,2025.50%21,862
Clark 4,80744.36%5,97655.15%50.05%480.44%-1,169-10.79%10,836
Clay 4,93448.27%5,18550.72%310.30%720.70%-251-2.46%10,222
Clinton 4,55837.27%7,58262.00%600.49%300.25%-3,024-24.73%12,230
Coles 11,40951.83%10,52847.82%290.13%480.22%8814.00%22,014
Cook 1,168,14155.24%938,45444.38%4,9080.23%3,3040.16%229,68710.86%2,114,807
Crawford 5,70344.54%7,03654.95%120.09%540.42%-1,333-10.41%12,805
Cumberland 3,09147.92%3,33051.62%110.17%190.29%-239-3.70%6,451
DeKalb 6,98935.53%12,57763.95%530.27%490.25%-5,588-28.41%19,668
DeWitt 5,05247.78%5,47751.80%140.13%310.29%-425-4.02%10,574
Douglas 4,51344.99%5,45154.34%310.31%360.36%-938-9.35%10,031
DuPage 18,92331.51%40,74667.85%3070.51%730.12%-21,823-36.34%60,049
Edgar 6,71345.42%7,98554.03%220.15%600.41%-1,272-8.61%14,780
Edwards 1,77034.16%3,36164.86%230.44%280.54%-1,591-30.70%5,182
Effingham 5,98849.88%5,94149.48%270.22%500.42%470.39%12,006
Fayette 7,28648.85%7,48650.19%300.20%1130.76%-200-1.34%14,915
Ford 3,06234.55%5,77065.11%170.19%130.15%-2,708-30.56%8,862
Franklin 15,52354.16%12,93645.14%1010.35%1000.35%2,5879.03%28,660
Fulton 12,19848.35%12,81650.80%960.38%1180.47%-618-2.45%25,228
Gallatin 3,29355.54%2,58843.65%180.30%300.51%70511.89%5,929
Greene 6,01555.06%4,84044.30%280.26%420.38%1,17510.76%10,925
Grundy 4,10538.22%6,59361.38%230.21%200.19%-2,488-23.16%10,741
Hamilton 3,69147.64%4,00551.69%240.31%280.36%-314-4.05%7,748
Hancock 6,68841.90%9,10857.06%240.15%1410.88%-2,420-15.16%15,961
Hardin 1,97445.56%2,33353.84%100.23%160.37%-359-8.29%4,333
Henderson 1,97737.44%3,26461.81%170.32%230.44%-1,287-24.37%5,281
Henry 10,48140.86%14,97158.37%1230.48%730.28%-4,490-17.51%25,648
Iroquois 7,03638.68%11,04760.73%150.08%930.51%-4,011-22.05%18,191
Jackson 9,60044.22%11,98055.19%650.30%630.29%-2,380-10.96%21,708
Jasper 3,68947.20%4,08252.23%100.13%340.44%-393-5.03%7,815
Jefferson 10,88755.22%8,69244.09%380.19%980.50%2,19511.13%19,715
Jersey 3,69247.99%3,95851.44%270.35%170.22%-266-3.46%7,694
Jo Daviess 3,86434.52%7,28565.09%230.21%200.18%-3,421-30.57%11,192
Johnson 2,25436.99%3,82762.80%40.07%90.15%-1,573-25.81%6,094
Kane 25,67637.81%41,94961.77%2220.33%670.10%-16,273-23.96%67,914
Kankakee 13,71645.97%15,99853.62%610.20%630.21%-2,282-7.65%29,838
Kendall 1,97831.92%4,20067.79%100.16%80.13%-2,222-35.86%6,196
Knox 12,59741.68%17,45957.77%1160.38%520.17%-4,862-16.09%30,224
Lake 24,96539.34%38,24260.26%2030.32%510.08%-13,277-20.92%63,461
LaSalle 29,70453.62%25,29645.66%2070.37%1920.35%4,4087.96%55,399
Lawrence 5,62547.54%6,06151.22%280.24%1191.01%-436-3.68%11,833
Lee 6,00534.74%11,22864.96%260.15%260.15%-5,223-30.22%17,285
Livingston 7,72235.61%13,90964.14%300.14%250.12%-6,187-28.53%21,686
Logan 6,75342.94%8,92956.78%200.13%230.15%-2,176-13.84%15,725
Macon 27,58957.64%19,99841.78%880.18%1890.39%7,59115.86%47,864
Macoupin 14,35652.00%13,00047.08%1800.65%740.27%1,3564.91%27,610
Madison 44,80359.01%30,44540.10%5080.67%1730.23%14,35818.91%75,929
Marion 13,80756.41%10,46142.74%600.25%1480.60%3,34613.67%24,476
Marshall 3,34342.26%4,52757.23%300.38%100.13%-1,184-14.97%7,910
Mason 4,41649.08%4,54150.47%180.20%230.26%-125-1.39%8,998
Massac 2,81337.14%4,72262.34%160.21%230.30%-1,909-25.20%7,574
McDonough 5,78335.66%10,32663.67%260.16%820.51%-4,543-28.01%16,217
McHenry 6,17027.07%16,48072.30%1250.55%200.09%-10,310-45.23%22,795
McLean 18,02444.87%21,86554.44%1270.32%1500.37%-3,841-9.56%40,166
Menard 2,89444.81%3,53154.68%160.25%170.26%-637-9.86%6,458
Mercer 3,83037.53%6,33662.09%200.20%180.18%-2,506-24.56%10,204
Monroe 2,82637.17%4,75462.54%200.26%20.03%-1,928-25.36%7,602
Montgomery 9,65447.50%10,49751.65%850.42%890.44%-843-4.15%20,325
Morgan 9,08247.10%10,13752.57%210.11%430.22%-1,055-5.47%19,283
Moultrie 3,69650.13%3,63649.32%70.09%340.46%600.81%7,373
Ogle 4,83328.87%11,83870.71%280.17%430.26%-7,005-41.84%16,742
Peoria 42,00954.40%34,91145.21%1760.23%1250.16%7,0989.19%77,221
Perry 6,53947.26%7,24352.35%240.17%310.22%-704-5.09%13,837
Piatt 3,56443.68%4,56455.94%70.09%240.29%-1,000-12.26%8,159
Pike 7,67653.15%6,61945.83%190.13%1270.88%1,0577.32%14,441
Pope 1,49933.84%2,91465.78%90.20%80.18%-1,415-31.94%4,430
Pulaski 3,45642.75%4,58956.76%180.22%220.27%-1,133-14.01%8,085
Putnam 1,19540.03%1,77859.56%80.27%40.13%-583-19.53%2,985
Randolph 7,80245.32%9,33354.21%540.31%260.15%-1,531-8.89%17,215
Richland 4,33545.89%5,02253.17%130.14%760.80%-687-7.27%9,446
Rock Island 35,24057.67%25,62941.95%1320.22%1000.16%9,61115.73%61,101
Saline 10,69250.02%10,56749.43%370.17%810.38%1250.58%21,377
Sangamon 31,94347.23%35,46452.44%1110.16%1100.16%-3,521-5.21%67,628
Schuyler 3,40450.04%3,31848.77%120.18%691.01%861.26%6,803
Scott 2,49248.87%2,58550.70%90.18%130.25%-93-1.82%5,099
Shelby 7,70450.69%7,25047.71%680.45%1751.15%4542.99%15,197
St. Clair 53,48259.50%35,99840.05%2910.32%1200.13%17,48419.45%89,891
Stark 1,81834.79%3,39364.94%10.02%130.25%-1,575-30.14%5,225
Stephenson 8,91138.67%14,04060.92%490.21%450.20%-5,129-22.26%23,045
Tazewell 17,62458.44%12,41941.18%520.17%640.21%5,20517.26%30,159
Union 5,80453.74%4,91545.51%450.42%360.33%8898.23%10,800
Vermilion 22,89149.50%23,05949.87%620.13%2300.50%-168-0.36%46,242
Wabash 4,18752.57%3,65945.94%60.08%1131.42%5286.63%7,965
Warren 4,87838.30%7,79061.17%110.09%560.44%-2,912-22.87%12,735
Washington 3,47937.73%5,70161.82%220.24%200.22%-2,222-24.09%9,222
Wayne 5,56945.68%6,55653.77%230.19%440.36%-987-8.10%12,192
White 5,90951.41%5,45947.50%700.61%550.48%4503.92%11,493
Whiteside 7,35631.65%15,75267.77%900.39%440.19%-8,396-36.12%23,242
Will 29,44247.53%32,29152.13%1760.28%370.06%-2,849-4.60%61,946
Williamson 14,64550.12%14,43349.40%670.23%720.25%2120.73%29,217
Winnebago 28,06147.46%30,68351.89%1780.30%2050.35%-2,622-4.43%59,127
Woodford 4,31439.43%6,57560.09%200.18%330.30%-2,261-20.66%10,942
Totals2,149,93450.97%2,047,24048.54%10,9140.26%9,8470.23%102,6942.43%4,217,935

See also

Related Research Articles

<span class="mw-page-title-main">2004 United States presidential election in Illinois</span>

The 2004 United States presidential election in Illinois took place on November 2, 2004, and was part of the 2004 United States presidential election. Voters chose 21 representatives, or electors to the Electoral College, who voted for president and vice president.

<span class="mw-page-title-main">2000 United States presidential election in Illinois</span>

The 2000 United States presidential election in Illinois took place on November 7, 2000, and was part of the 2000 United States presidential election. Voters chose 22 representatives, or electors to the Electoral College, who voted for president and vice president.

<span class="mw-page-title-main">2012 United States presidential election in Illinois</span>

The 2012 United States presidential election in Illinois took place on November 6, 2012, as part of the 2012 United States presidential election in which all 50 states plus the District of Columbia participated. Illinois voters chose 20 electors to represent them in the Electoral College via a popular vote pitting incumbent Democratic President Barack Obama and his running mate, Vice President Joe Biden, against Republican challenger and former Massachusetts Governor Mitt Romney and his running mate, Congressman Paul Ryan. The Obama/Biden ticket won Illinois with 57.50% of the popular vote to Romney/Ryan's 40.66%, thus winning the state's twenty electoral votes by a margin of 16.84%.

<span class="mw-page-title-main">1980 United States presidential election in Illinois</span>

The 1980 United States presidential election in Illinois took place on November 4, 1980. All 50 states and The District of Columbia, were part of the 1980 United States presidential election. State voters chose 26 electors to the Electoral College, who voted for president and vice president. This would be the last time a Democrat failed to win more than three counties as well as the last time Rock Island County voted Republican, with the county turning sharply to the Democratic party beginning with Reagan's reelection bid and continuing through to the present day.

<span class="mw-page-title-main">2016 United States presidential election in Illinois</span>

The 2016 United States presidential election in Illinois was held on Tuesday, November 8, 2016, as part of the 2016 United States presidential election in which all 50 states plus the District of Columbia participated. Illinois voters chose electors to represent them in the Electoral College via a popular vote, pitting the Republican Party's nominee, businessman Donald Trump, and running mate Indiana Governor Mike Pence against Democratic Party nominee, former Secretary of State Hillary Clinton, and her running mate Virginia Senator Tim Kaine. Illinois had 20 votes in the Electoral College.

<span class="mw-page-title-main">1976 United States presidential election in Illinois</span>

The 1976 United States presidential election in Illinois was held on November 2, 1976. All 50 states and The District of Columbia, were part of the 1976 United States presidential election. State voters chose 26 electors to the Electoral College, who voted for president and vice president.

<span class="mw-page-title-main">1972 United States presidential election in Illinois</span>

The 1972 United States presidential election in Illinois was held on November 7, 1972 as part of the 1972 United States presidential election. Incumbent President Richard Nixon won the state of Illinois with 59.03 percent of the vote, carrying the state's 26 electoral votes. He defeated his main opponent, Democratic candidate George McGovern in Illinois by a large margin of 18.52%, which still left Illinois 4.63% more Democratic than the nation.

<span class="mw-page-title-main">1964 United States presidential election in Illinois</span>

The 1964 United States presidential election in Illinois took place on November 3, 1964, as part of the 1964 United States presidential election. State voters chose 26 representatives, or electors, to the Electoral College, who voted for president and vice president.

<span class="mw-page-title-main">1960 United States presidential election in Illinois</span>

The 1960 United States presidential election in Illinois took place on November 8, 1960, as part of the 1960 United States presidential election. State voters chose 27 representatives, or electors, to the Electoral College, who voted for president and vice president.

<span class="mw-page-title-main">1956 United States presidential election in Illinois</span>

The 1956 United States presidential election in Illinois took place on November 6, 1956, as part of the 1956 United States presidential election. State voters chose 27 representatives, or electors, to the Electoral College, who voted for president and vice president.

<span class="mw-page-title-main">1952 United States presidential election in Illinois</span>

The 1952 United States presidential election in Illinois took place on November 4, 1952, as part of the 1952 United States presidential election. State voters chose 27 representatives, or electors, to the Electoral College, who voted for president and vice president.

<span class="mw-page-title-main">1912 United States presidential election in Illinois</span> Election in Illinois

The 1912 United States presidential election in Illinois took place on November 5, 1912, as part of the 1912 United States presidential election. State voters chose 29 representatives, or electors, to the Electoral College, who voted for president and vice president.

<span class="mw-page-title-main">1916 United States presidential election in Illinois</span> Election in Illinois

The 1916 United States presidential election in Illinois was held on November 7, 1916, as part of the 1916 United States presidential election. State voters chose 29 electors to the Electoral College, who voted for president and vice president.

<span class="mw-page-title-main">1948 United States presidential election in Illinois</span>

The 1948 United States presidential election in Illinois took place on November 2, 1948, as part of the 1948 United States presidential election. State voters chose 28 representatives, or electors, to the Electoral College, who voted for president and vice president.

<span class="mw-page-title-main">1944 United States presidential election in Illinois</span>

The 1944 United States presidential election in Illinois took place on November 7, 1944, as part of the 1944 United States presidential election. State voters chose 28 representatives, or electors, to the Electoral College, who voted for president and vice president.

<span class="mw-page-title-main">1936 United States presidential election in Illinois</span> Election in Illinois

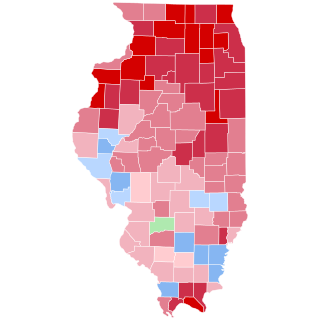
The 1936 United States presidential election in Illinois took place on November 3, 1936, as part of the 1936 United States presidential election. State voters chose 29 representatives, or electors, to the Electoral College, who voted for president and vice president.

<span class="mw-page-title-main">1932 United States presidential election in Illinois</span> Election in Illinois

The 1932 United States presidential election in Illinois took place on November 8, 1932, as part of the 1932 United States presidential election. State voters chose 29 representatives, or electors, to the Electoral College, who voted for president and vice president.

<span class="mw-page-title-main">1920 United States presidential election in Illinois</span> Election in Illinois

The 1920 United States presidential election in Illinois took place on November 2, 1920, as part of the 1920 United States presidential election. State voters chose 29 representatives, or electors, to the Electoral College, who voted for president and vice president.

<span class="mw-page-title-main">1924 United States presidential election in Illinois</span> Election in Illinois

The 1924 United States presidential election in Illinois took place on November 4, 1924, as part of the 1924 United States presidential election. State voters chose 29 representatives, or electors, to the Electoral College, who voted for president and vice president.

<span class="mw-page-title-main">1928 United States presidential election in Illinois</span> Election in Illinois

Republican candidate Herbert Hoover won the state of Illinois in the 1928 United States presidential election, and would emerge victorious from the overall election. State voters chose 29 representatives, or electors, to the Electoral College, who voted for president and vice president.

References

  1. "United States Presidential election of 1940 - Encyclopædia Britannica" . Retrieved August 20, 2018.
  2. "1940 Election for the Thirty-ninth Term (1941-45)" . Retrieved August 20, 2018.
  3. "1940 Presidential General Election Results - Illinois" . Retrieved August 20, 2018.
  4. "The American Presidency Project - Election of 1940" . Retrieved August 20, 2018.
  5. 1 2 3 4 5 6 7 8 9 "OFFICIAL VOTE of the STATE OF ILLINOIS Cast at the GENERAL ELECTION, November 5, 1940 JUDICIAL ELECTIONS, 1939-1940 PRIMARY ELECTION General Primary, April 9, 1940" (PDF). Illinois State Board of Elections. Archived from the original (PDF) on June 24, 2021. Retrieved August 2, 2020.
  6. Our Campaigns; IL US President 1940