1928 United States presidential election in Illinois

Last updated

1928 United States presidential election in Illinois
Flag of Illinois (1915-1969).svg
  1924 November 6, 1928 1932  

All 29 Illinois votes to the Electoral College
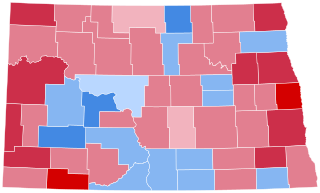
  Herbert Hoover - NARA - 532049.jpg Unsuccessful 1928.jpg
Nominee Herbert Hoover Al Smith
Party Republican Democratic
Home state California New York
Running mate Charles Curtis Joseph Taylor Robinson
Electoral vote290
Popular vote1,769,1411,313,817
Percentage56.93%42.28%

Illinois Presidential Election Results 1928.svg
County Results

President before election

Calvin Coolidge
Republican

Elected President

Herbert Hoover
Republican

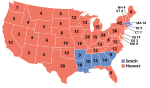
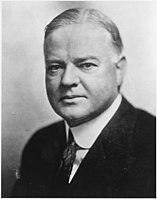
Republican candidate Herbert Hoover won the state of Illinois in the 1928 United States presidential election, and would emerge victorious from the overall election. State voters chose 29 representatives, or electors, to the Electoral College, who voted for president and vice president.

Contents

A strongly Democratic state during the Second Party System, Illinois became Republican-leaning after the American Civil War due to a combination of strong Free Soil Party heritage amongst its Yankee northern counties with the wartime conversion of some Virginian-settled rock-ribbed Democratic Southern Illinois counties [1] to Unionist Republicanism [2] à la Appalachia. [3] Between the Civil War and World War I, partisanship in Illinois – like in the Border States – largely re-fought the war, with the result that although the Democratic Party gained at least 43 percent of the statewide vote via Southern and German Catholic support in every election up to 1900, they never gained an absolute majority and carried the state's electoral votes only in 1892. [4]

Due to the Democratic Party's growing Populist and prohibitionist leanings, a decline in Democratic support after 1900 in its German Central Illinois strongholds transformed Illinois into a powerfully Republican state at all levels. [5] Even Woodrow Wilson in 1912 when the GOP was mortally divided carried the state by only a very narrow margin, and in 1920 hostility to the League of Nations and the perceived anti-German bias of both outgoing President Wilson and new Democratic nominee and former Ohio Governor James M. Cox – the latter of whom had banned German-language instruction in Ohio schools [6] – meant Harding carried Illinois by over 42 percentage points and the state was his sixth strongest in a national landslide. Thirteen German Catholic or southern-settled counties went Republican for the first time. [7]

In 1924, Calvin Coolidge maintained Harding's dominance despite losing substantial German Catholic and Mississippi Valley industrial support to Progressive Wisconsin Senator Robert M. La Follette, whose family would endorse Catholic New York City Democrat Al Smith after the patriarch died in 1925. [8] Despite some predictions of upheaval during April [9] Hoover was easily nominated as the Republican candidate. Smith was nominated as the Democratic candidate. After the nominations were finalized, some critics felt Smith might have a chance of carrying electoral-vote-rich Illinois due to opposition to Hoover in the Farm Belt; [10] however by the end of June Hoover asserted that the farm vote was safe after Lowden's supporters decided to aid the GOP nominee. [11]

Hoover campaigned in Illinois after reports early in July [12] suggested the popularity of Smith's “wet” stand in Chicago made his win in this traditionally Republican state doubtful. [13] Smith did not visit the state during the summer, but relied on campaigning by members of the state Democratic ticket led by Thomas S. Donovan, [14] mainly in Chicago but also in the Metro East region. [15] During September, Donovan and the Democrats intensified their campaign in both liberal and anti-Prohibition Chicago and “dry” downstate Illinois. [16]

At the end of the summer, the state was confused and few trends were apparent in early polling, with Republicans in metropolitan Chicago quarreling bitterly. [17] However, by the end of September it was clear that religion was the paramount issue in the campaign and that it was driving Chicago toward Smith and the rest of the state toward Hoover (Smith was the first Catholic nominated by a major party for president). [18]

Despite earlier doubts, [13] [14] the earliest poll by Literary Digest showed Hoover carrying Illinois by a two-to-one majority; [19] however, increased registration in Cook County made the early Literary Digest polls seem dubious, [20] and Hoover was winning only by five-to-three in the next poll in the second week of October, [21] and only by twelve percentage points in the third week – at a time when Hoover was leading in 42 of 48 states. [22] As things turned out, this last poll proved accurate. Smith would give his final Chicago campaign speech on October 17. [23]

Primaries

The primaries and general elections coincided with those for House as well as those for state offices. [24]

Turnout

The total vote in the state-run primary elections (Democratic and Republican) was 1,228,537. [24]

The total vote in the general election was 3,107,489. [24] Both major parties held non-binding state-run preferential primaries on April 12. [24]

Democratic

1928 Illinois Democratic presidential primary
Flag of Illinois.svg
  1924 April 10, 1928 (1928-04-10) 1932  
  AlfredSmith (1).png Sen. Jas. A. Reed LCCN2016848785 (cropped).jpg
Candidate Al Smith James A. Reed
Home state New York Missouri
Popular vote44,2123,786
Percentage91.11%7.80

The 1928 Illinois Democratic presidential primary was held on April 10, 1928 in the U.S. state of Illinois as one of the Democratic Party's state primaries ahead of the 1928 presidential election.

The popular vote was a non-binding "beauty contest". Delegates were instead elected by direct votes by congressional district on delegate candidates. [24]

Al Smith easily won the primary, and was virtually unopposed for the Democratic nomination, with most other prominent Democrats standing out as they felt they had no hope of winning the general election. [25]

1928 Illinois Democratic presidential primary [24]
CandidateVotes%
Al Smith (write-in)44,21291.11
James A. Reed (write-in)3,7867.80
Thomas Walsh (write-in)2210.46
W.G. McAdoo (write-in)2130.44
E. T. Meredith (write-in)570.12
Henry T. Rainey (write-in)160.03
Scattering2040.42
Total48,525100

Republican

1928 Illinois Republican presidential primary
Flag of Illinois.svg
  1924 April 10, 1928 (1928-04-10) 1932  
  Frank O Lowden portrait (1).jpg
Candidate Frank Orren Lowden
Home state Illinois
Popular vote345,498
Percentage99.50%

The 1928 Illinois Republican presidential primary was held on April 10, 1928 in the U.S. state of Illinois as one of the Republican Party's state primaries ahead of the 1928 presidential election.

The preference vote was a "beauty contest". Delegates were instead selected by direct-vote in each congressional districts on delegate candidates. [24]

The preference vote was won nearly unanimously by the only name on ballot, favorite son, Secretary of Commerce Frank Lowden. [24] [26]

1928 Illinois Republican presidential primary [24]
CandidateVotes%
Frank Lowden 1,172,27899.35
Herbert Hoover (write-in)4,3680.37
Calvin Coolidge (incumbent) (write-in)2,4200.21
Charles G. Dawes (write-in)7560.06
Scattering1900.02
Total1,180,012100

Results

Presidential Candidate Running Mate PartyElectoral Vote (EV)Popular Vote (PV) [24]
Herbert Hoover of California Charles Curtis Republican 291,769,14156.93%
Al Smith Joseph T. Robinson Democratic 01,313,81742.28%
Norman Thomas James Maurer Socialist 019,1380.62%
William Z. Foster Benjamin Gitlow Workers Party America 03,5810.12%
Verne L. Reynolds Jeremiah D. Crowley Socialist Labor 01,8120.06%

Results by county

CountyHerbert Clark Hoover
Republican
Alfred Emmanuel Smith
Democratic
Normal Mattoon Thomas
Socialist
William Z. Foster
Workers’ Party America
Verne L. Reynolds
Socialist Labor
MarginTotal votes cast [27]
#%#%#%#%#%#%
Adams 15,59053.59%13,21545.42%2540.87%130.04%210.07%2,3758.16%29,093
Alexander 5,66661.24%3,55838.46%210.23%40.04%30.03%2,10822.78%9,252
Bond 4,16064.06%2,29835.39%300.46%10.02%50.08%1,86228.67%6,494
Boone 5,96580.95%1,37118.60%300.41%10.01%20.03%4,59462.34%7,369
Brown 2,28954.96%1,86744.83%60.14%10.02%20.05%42210.13%4,165
Bureau 11,55763.73%6,48635.77%620.34%120.07%160.09%5,07127.97%18,133
Calhoun 1,59450.16%1,55148.80%310.98%20.06%00.00%431.35%3,178
Carroll 6,19776.34%1,87623.11%410.51%40.05%00.00%4,32153.23%8,118
Cass 4,00953.50%3,46146.18%170.23%30.04%40.05%5487.31%7,494
Champaign 19,49468.28%8,91531.23%1190.42%110.04%110.04%10,57937.05%28,550
Christian 9,89656.77%7,34542.14%1350.77%370.21%180.10%2,55114.63%17,431
Clark 5,63260.64%3,62138.99%260.28%60.06%30.03%2,01121.65%9,288
Clay 4,52265.16%2,41834.84%00.00%00.00%00.00%2,10430.32%6,940
Clinton 3,03130.77%6,77468.76%390.40%30.03%50.05%-3,743-37.99%9,852
Coles 11,47969.12%5,07130.54%390.23%70.04%110.07%6,40838.59%16,607
Cook 812,06352.73%716,28346.51%8,9710.58%2,1010.14%7530.05%95,7806.22%1,540,171
Crawford 5,98962.90%3,49536.70%320.34%40.04%20.02%2,49426.19%9,522
Cumberland 3,24263.04%1,87336.42%210.41%50.10%20.04%1,36926.62%5,143
DeKalb 11,50174.19%3,94025.41%450.29%150.10%20.01%7,56148.77%15,503
DeWitt 6,10069.40%2,63129.93%550.63%20.02%20.02%3,46939.47%8,790
Douglas 4,89068.19%2,23931.22%400.56%20.03%00.00%2,65136.97%7,171
DuPage 28,01672.37%10,47927.07%1810.47%130.03%230.06%17,53745.30%38,712
Edgar 7,50958.27%5,32541.32%420.33%60.05%40.03%2,18416.95%12,886
Edwards 2,86174.78%95024.83%140.37%10.03%00.00%1,91149.95%3,826
Effingham 3,88247.26%4,23951.61%851.03%50.06%30.04%-357-4.35%8,214
Fayette 6,54561.65%3,99837.66%570.54%60.06%100.09%2,54723.99%10,616
Ford 4,66868.72%2,09830.88%260.38%10.01%00.00%2,57037.83%6,793
Franklin 9,90045.79%11,36952.58%1610.74%1430.66%490.23%-1,469-6.79%21,622
Fulton 10,60059.95%6,59137.28%4542.57%110.06%240.14%4,00922.68%17,680
Gallatin 2,00245.78%2,34353.58%220.50%10.02%50.11%-341-7.80%4,373
Greene 4,29951.05%4,07648.40%400.48%30.04%30.04%2232.65%8,421
Grundy 5,12661.54%3,17438.11%230.28%20.02%40.05%1,95223.44%8,329
Hamilton 3,27551.08%3,03747.36%751.17%200.31%50.08%2383.71%6,412
Hancock 7,79558.65%5,44740.99%350.26%50.04%80.06%2,34817.67%13,290
Hardin 1,75864.35%93334.15%281.02%30.11%100.37%82530.20%2,732
Henderson 2,69571.11%1,06528.10%260.69%20.05%20.05%1,63043.01%3,790
Henry 14,66670.83%5,85828.29%1670.81%70.03%90.04%8,80842.54%20,707
Iroquois 8,45360.71%5,42138.94%380.27%40.03%70.05%3,03221.78%13,923
Jackson 9,18060.79%5,83638.64%750.50%60.04%50.03%3,34422.14%15,102
Jasper 3,20151.04%3,05548.71%140.22%20.03%00.00%1462.33%6,272
Jefferson 7,32655.08%5,90544.40%620.47%40.03%40.03%1,42110.68%13,301
Jersey 2,99354.62%2,47345.13%110.20%30.05%00.00%5209.49%5,480
Jo Daviess 6,33361.59%3,85637.50%880.86%30.03%30.03%2,47724.09%10,283
Johnson 2,89270.69%1,16328.43%300.73%40.10%20.05%1,72942.26%4,091
Kane 38,23669.94%16,18429.60%2200.40%150.03%180.03%22,05240.33%54,673
Kankakee 11,90553.44%10,24745.99%1200.54%30.01%40.02%1,6587.44%22,279
Kendall 3,58975.53%1,15424.28%80.17%10.02%00.00%2,43551.24%4,752
Knox 16,15172.33%5,99326.84%1730.77%30.01%100.04%10,15845.49%22,330
Lake 26,81467.73%12,25230.95%3390.86%1500.38%320.08%14,56236.78%39,587
LaSalle 24,03953.15%20,80746.00%3540.78%120.03%160.04%3,2327.15%45,228
Lawrence 5,85160.16%3,80639.13%530.54%80.08%80.08%2,04521.03%9,726
Lee 9,23867.14%4,47632.53%380.28%50.04%30.02%4,76234.61%13,760
Livingston 11,16165.68%5,73733.76%840.49%20.01%80.05%5,42431.92%16,992
Logan 7,63159.97%5,01939.44%600.47%100.08%50.04%2,61220.53%12,725
Macon 24,49270.68%9,93228.66%1940.56%120.03%240.07%14,56042.02%34,654
Macoupin 10,69947.68%11,29050.32%3501.56%810.36%180.08%-591-2.63%22,438
Madison 28,02853.48%23,65845.14%5401.03%1190.23%610.12%4,3708.34%52,406
Marion 9,11060.52%5,82338.69%850.56%100.07%240.16%3,28721.84%15,052
Marshall 4,02958.69%2,82841.19%70.10%10.01%00.00%1,20117.49%6,865
Mason 3,95654.78%3,24644.95%170.24%20.03%00.00%7109.83%7,221
Massac 3,40572.87%1,24126.56%130.28%120.26%20.04%2,16446.31%4,673
McDonough 8,95368.15%4,10431.24%690.53%40.03%80.06%4,84936.91%13,138
McHenry 10,66165.33%5,59634.29%570.35%40.02%10.01%5,06531.04%16,319
McLean 20,78065.37%10,74233.79%2400.75%110.03%160.05%10,03831.58%31,789
Menard 3,24364.54%1,74234.67%340.68%60.12%00.00%1,50129.87%5,025
Mercer 5,69970.59%2,31628.69%510.63%40.05%30.04%3,38341.91%8,073
Monroe 2,72148.03%2,93451.79%80.14%20.04%00.00%-213-3.76%5,665
Montgomery 8,99954.29%7,39244.60%1230.74%480.29%130.08%1,6079.70%16,575
Morgan 10,19263.52%5,80536.18%310.19%80.05%100.06%4,38727.34%16,046
Moultrie 3,31060.31%2,16839.50%90.16%10.02%00.00%1,14220.81%5,488
Ogle 9,80876.53%2,96123.10%430.34%10.01%30.02%6,84753.43%12,816
Peoria 31,02456.50%23,15042.16%6321.15%310.06%760.14%7,87414.34%54,913
Perry 4,63647.47%5,02951.49%670.69%70.07%270.28%-393-4.02%9,766
Piatt 4,56569.62%1,95929.88%230.35%30.05%70.11%2,60639.74%6,557
Pike 6,70561.88%4,00836.99%1101.02%80.07%50.05%2,69724.89%10,836
Pope 2,00474.06%67925.09%200.74%30.11%00.00%1,32548.97%2,706
Pulaski 3,31965.18%1,72633.90%340.67%100.20%30.06%1,59331.28%5,092
Putnam 1,38761.10%86938.28%110.48%20.09%10.04%51822.82%2,270
Randolph 5,73947.46%6,25151.69%930.77%30.02%70.06%-512-4.23%12,093
Richland 4,04261.03%2,55038.50%230.35%20.03%60.09%1,49222.53%6,623
Rock Island 27,24665.22%14,33434.31%1320.32%450.11%190.05%12,91230.91%41,776
Saline 7,52553.82%6,33745.32%870.62%170.12%170.12%1,1888.50%13,983
Sangamon 31,95759.99%21,02639.47%1740.33%780.15%360.07%10,93120.52%53,271
Schuyler 3,01154.00%2,54245.59%160.29%10.02%60.11%4698.41%5,576
Scott 2,60159.96%1,73039.88%50.12%20.05%00.00%87120.08%4,338
Shelby 7,21462.58%4,07135.31%2432.11%00.00%00.00%3,14327.26%11,528
St. Clair 31,02645.60%36,37453.46%5060.74%760.11%550.08%-5,348-7.86%68,037
Stark 2,96669.09%1,30630.42%190.44%20.05%00.00%1,66038.67%4,293
Stephenson 11,99267.97%5,57931.62%620.35%30.02%70.04%6,41336.35%17,643
Tazewell 9,40956.73%6,91041.66%2481.50%30.02%160.10%2,49915.07%16,586
Union 3,35244.52%4,14955.10%240.32%40.05%10.01%-797-10.58%7,530
Vermilion 21,61662.26%12,72836.66%2590.75%590.17%550.16%8,88825.60%34,717
Wabash 2,37337.26%3,95562.10%330.52%50.08%30.05%-1,582-24.84%6,369
Warren 7,91573.61%2,68124.93%1461.36%40.04%70.07%5,23448.67%10,753
Washington 3,63855.90%2,84843.76%220.34%00.00%00.00%79012.14%6,508
Wayne 5,18962.04%3,10837.16%570.68%50.06%50.06%2,08124.88%8,364
White 4,17753.01%3,66646.53%280.36%50.06%30.04%5116.49%7,879
Whiteside 13,58076.60%4,07923.01%610.34%20.01%60.03%9,50153.59%17,728
Will 26,08155.02%20,87744.04%4130.87%180.04%160.03%5,20410.98%47,405
Williamson 10,91351.21%10,13947.58%1660.78%620.29%290.14%7743.63%21,309
Winnebago 33,25880.39%7,68418.57%2690.65%1210.29%400.10%25,57461.81%41,372
Woodford 5,14060.30%3,31138.84%670.79%50.06%10.01%1,82921.46%8,524
Totals1,769,14156.93%1,313,81742.28%19,1380.62%3,5810.12%1,8120.06%455,32414.65%3,107,489

Analysis

Hoover carried Illinois by a 14-point margin, which was nonetheless a major decline upon the two preceding elections and the first time Illinois had voted more Democratic than the nation at large since Stephen A. Douglas in 1860. Smith did make major gains in heavily Catholic Chicago [28] – despite reservations from the city's large Polish-American population about his Irish and Tammany background [29] – but he failed to carry Cook County despite doubling Davis’ 1924 vote share. In the most heavily anti-Catholic areas – Scandinavian Rockford and Ozark Bible Belt-influenced Southern Illinois – the GOP vote held firm or rose and this was enough to ensure Smith had no chance of carrying the state. [28]

See also

Related Research Articles

<span class="mw-page-title-main">1928 United States presidential election</span> 36th quadrennial U.S. presidential election

The 1928 United States presidential election was the 36th quadrennial presidential election, held on Tuesday, November 6, 1928. Republican former Secretary of Commerce Herbert Hoover defeated the Democratic nominee, Governor Al Smith of New York. After President Calvin Coolidge declined to seek reelection, Hoover emerged as his party's frontrunner. As Hoover's party opponents failed to unite around a candidate, Hoover received a large majority of the vote at the 1928 Republican National Convention. The strong state of the economy discouraged some Democrats from running, and Smith was nominated on the first ballot of the 1928 Democratic National Convention. Hoover and Smith had been widely known as potential presidential candidates long before the 1928 campaign, and both were generally regarded as outstanding leaders. Both were newcomers to the presidential race and presented in their person and record an appeal of unknown potency to the electorate. Both faced serious discontent within their respective parties' membership, and both lacked the wholehearted support of their parties' organization.

<span class="mw-page-title-main">1932 United States presidential election</span> 37th quadrennial U.S. presidential election

The 1932 United States presidential election was the 37th quadrennial presidential election, held on Tuesday, November 8, 1932. The election took place against the backdrop of the Great Depression. The incumbent Republican President Herbert Hoover was defeated in a landslide by Democrat Franklin D. Roosevelt, the governor of New York and the vice presidential nominee of the 1920 presidential election. Roosevelt was the first Democrat in 80 years to simultaneously win an outright majority of the electoral college and popular vote, a feat last accomplished by Franklin Pierce in 1852, as well as the first Democrat in 56 years to win a majority of the popular vote, which was last done by Samuel J. Tilden in 1876. Roosevelt was the last sitting governor to be elected president until Bill Clinton in 1992. Hoover was the last incumbent to lose an election to another term until Gerald Ford lost 44 years later. The election marked the effective end of the Fourth Party System, which had been dominated by Republicans. It was the first time since 1916 that a Democrat was elected president.

<span class="mw-page-title-main">1980 United States presidential election in Illinois</span> Election in Illinois

The 1980 United States presidential election in Illinois took place on November 4, 1980. All 50 states and The District of Columbia, were part of the 1980 United States presidential election. State voters chose 26 electors to the Electoral College, who voted for president and vice president. This would be the last time a Democrat failed to win more than three counties as well as the last time Rock Island County voted Republican, with the county turning sharply to the Democratic party beginning with Reagan's reelection bid and continuing through to the present day.

<span class="mw-page-title-main">1976 United States presidential election in Illinois</span> Election in Illinois

The 1976 United States presidential election in Illinois was held on November 2, 1976. All 50 states and The District of Columbia, were part of the 1976 United States presidential election. State voters chose 26 electors to the Electoral College, who voted for president and vice president.

<span class="mw-page-title-main">1928 United States presidential election in Wisconsin</span> Election in Wisconsin

The 1928 United States presidential election in Wisconsin was held on November 6, 1928 as part of the 1928 United States presidential election. State voters chose 13 electors to the Electoral College, who voted for president and vice president.

<span class="mw-page-title-main">1928 United States presidential election in Connecticut</span>

The 1928 United States presidential election in Connecticut took place on November 6, 1928, as part of the 1928 United States presidential election which was held throughout all contemporary 48 states. Voters chose seven representatives, or electors to the Electoral College, who voted for president and vice president.

<span class="mw-page-title-main">1928 United States presidential election in Florida</span> Election in Florida

The 1928 United States presidential election in Florida was held on November 6, 1928, as part of the 1928 United States presidential election held throughout all contemporary forty-eight states. Florida voters chose six electors, or representatives to the Electoral College, who voted for president and vice president.

<span class="mw-page-title-main">1928 United States presidential election in Georgia</span> Election in Georgia

The 1928 United States presidential election in Georgia took place on November 6, 1928, as part of the wider United States presidential election. Voters chose 14 representatives, or electors, to the Electoral College, who voted for president and vice president.

<span class="mw-page-title-main">1928 United States presidential election in Michigan</span> Election in Michigan

The 1928 United States presidential election in Michigan took place on November 6, 1928, as part of the 1928 United States presidential election. Voters chose 15 representatives, or electors, to the Electoral College, who voted for president and vice president.

<span class="mw-page-title-main">1932 United States presidential election in Alabama</span> Election in Alabama

The 1932 United States presidential election in Alabama took place on November 8, 1932, as part of the nationwide presidential election. Alabama voters chose eleven representatives, or electors, to the Electoral College, who voted for president and vice president. In Alabama, voters voted for electors individually instead of as a slate, as in the other states.

<span class="mw-page-title-main">1932 United States presidential election in North Dakota</span> Election in North Dakota

The 1932 United States presidential election in North Dakota took place on November 8, 1932, as part of the 1932 United States presidential election. Voters chose four representatives, or electors, to the Electoral College, who voted for president and vice president.

<span class="mw-page-title-main">1928 United States presidential election in North Carolina</span>

The 1928 United States presidential election in North Carolina was held on November 6, 1928. North Carolina voters chose twelve electors to the Electoral College, who voted for president and vice president.

<span class="mw-page-title-main">1928 United States presidential election in Indiana</span> Election in Indiana

The 1928 United States presidential election in Indiana took place on November 6, 1928, as part of the 1928 United States presidential election which was held throughout all contemporary 48 states. Voters chose 15 representatives, or electors to the Electoral College, who voted for president and vice president.

<span class="mw-page-title-main">1928 United States presidential election in North Dakota</span> Election in North Dakota

The 1928 United States presidential election in North Dakota took place on November 4, 1924, as part of the 1928 United States presidential election which was held throughout all contemporary 48 states. Voters chose five representatives, or electors to the Electoral College, who voted for president and vice president.

<span class="mw-page-title-main">1928 United States presidential election in Oregon</span> Election in Oregon

The 1928 United States presidential election in Oregon took place on November 6, 1928, as part of the 1928 United States presidential election. Voters chose five representatives, or electors, to the Electoral College, who voted for president and vice president.

<span class="mw-page-title-main">1928 United States presidential election in Tennessee</span> Election in Tennessee

The 1928 United States presidential election in Tennessee took place on November 6, 1928, as part of the 1928 United States presidential election. Tennessee voters chose 12 representatives, or electors, to the Electoral College, who voted for president and vice president.

<span class="mw-page-title-main">1928 United States presidential election in Oklahoma</span> Election in Oklahoma

The 1928 United States presidential election in Oklahoma took place on November 6, 1928, as part of the 1928 United States presidential election which was held throughout all contemporary 48 states. Voters chose ten representatives, or electors to the Electoral College, who voted for president and vice president. In its early years, Oklahoma was a “Solid South” state whose founding fathers like "Alfalfa Bill" Murray and Charles N. Haskell had disfranchised most of its black population via literacy tests and grandfather clauses, the latter of which would be declared unconstitutional in Guinn v. United States. In 1920 this “Solid South” state, nonetheless, joined the Republican landslide of Warren G. Harding, electing a GOP senator and five congressmen, but in 1922 the Democratic Party returned to their typical ascendancy as the state GOP became bitterly divided.

<span class="mw-page-title-main">1920 United States presidential election in Illinois</span> Election in Illinois

The 1920 United States presidential election in Illinois took place on November 2, 1920, as part of the 1920 United States presidential election. State voters chose 29 representatives, or electors, to the Electoral College, who voted for president and vice president.

<span class="mw-page-title-main">1924 United States presidential election in Illinois</span> Election in Illinois

The 1924 United States presidential election in Illinois took place on November 4, 1924, as part of the 1924 United States presidential election. State voters chose 29 representatives, or electors, to the Electoral College, who voted for president and vice president.

<span class="mw-page-title-main">1928 United States presidential election in Kentucky</span>

The 1928 United States presidential election in Kentucky took place on November 6, 1928 as part of the 1928 United States presidential election. Voters chose 13 representatives, or electors to the Electoral College, who voted for president and vice president.

References

  1. Phillips, Kevin P.; The Emerging Republican Majority, pp. 341-344 ISBN   978-0-691-16324-6
  2. Wells, Damon; Stephen Douglas: The Last Years, 1857–1861, p. 285 ISBN   0292776357
  3. Copeland, James E.; ‘Where Were the Kentucky Unionists and Secessionists’; The Register of the Kentucky Historical Society, volume 71, no. 4 (October, 1973), pp. 344-363
  4. "Presidential General Election Results Comparison – Illinois". Dave Leip’s U.S. Election Atlas.
  5. Schattschneider, Elmer Eric; The Semisovereign People: A Realist's View of Democracy in America, pp. 76-84 ISBN   0030133661
  6. Hough, Jerry F.; Changing Party Coalitions: The Mystery of the Red State-Blue State Alignment, pp. 86-87 ISBN   0875864090
  7. Menendez, Albert J.; The Geography of Presidential Elections in the United States, 1868-2004, p. 52 ISBN   0786422173
  8. Menendez; The Geography of Presidential Elections in the United States, p. 59
  9. Dudle, Uncle; ‘The Lowden Revival’; Daily Boston Globe, April 17, 1928, p. 22
  10. ‘The Pivotal State’; The Washington Post, June 11, 1928
  11. ‘Hoover Will Have Aid of Lowden Men in His Campaign: Kansas City "Coalition" Chiefs Promise Their Support – Lowden Himself Silent’; The New York Times, July 1, 1982, p. 1
  12. ‘Hoover Drive Begun to Hold Illinois: Deneen Tells State Chiefs Democrats “Poison” Minds of Some Industrial Leaders’; The New York Times, July 10, 1928, p. 1
  13. 1 2 ‘Celler Reports Smith Strong in Midwest: Representative Tells of Train Polls on His Trip Back From Houston’; The New York Times, July 8, 1928, p. 20
  14. 1 2 ‘Illinois for Smith, Says State Chairman: Donovan Telegraphs Raskob That the Democratic Sentiment “Is a Revelation”’; The New York Times, August 2, 1928, p. 2
  15. ‘Plan Smith Campign Outside of Chicago: Hawes and Donowan Want Headquarters at St. Louis for Down-State Illinois’; The New York Times; August 16, 1928, p. 10
  16. ‘Democrat Attack Telling in Illinois: State Is Called Extremely Doubtful as Assaults Hit G.O.P. Strongholds’
  17. ‘Voters of Illinois Confused on Issues: No Definite Trend Yet Seen; G.O.P. in Bitter Quarrel in Chicago’; The Washington Post, September 2, 1928, p. M6
  18. Hennessy, M.E.; ‘Religion Tops Issues in Battle in Illinois: Chicago Strong for Smith Rest Is for Hoover. Mid-West Republican Bureau Lays Claim to That Whole Section’; Daily Boston Globe, September 27, 1928, p. 12
  19. ‘Hoover Lead Gains in Digest Poll’; The New York Times; October 5, 1928, p. 2
  20. Donegan, Arthur B.; ‘Illinois in Ferment in Big Finals Drives: Both Parties Impressed by Record Registration in Cook County. State Is Held in Doubt’; The Washington Post, October 7, 1928, p. M4
  21. ‘Hoover Keeps Lead on Digest Ballots: Poll of Forty States Gives Him 1,201,869, Against 688,829 for Governor Smith’; The New York Times, October 12, 1928, p. 22
  22. ‘Hoover Has 42 States in Poll: Four States Show Smith Majority and Two Considered Doubtful Total of 2,529,997 Returns’; The Wall Street Journal , October 19, 1928, p. 6
  23. Gableman, Edwin W.; ‘Smith Sees Victory in States Visited: Arrives in Chicago for His Final Speech of the Present Tour. Missouri Is Optimistic’; The Washington Post, October 18, 1928, p. 2
  24. 1 2 3 4 5 6 7 8 9 10 "OFFICIAL VOTE OF THE STATE OF ILLINOIS CAST AT THE GENERAL ELECTION, November 6, 1928 JUDICIAL ELECTIONS, 1927-1928 PRIMARY ELECTION GENERAL PRIMARY, April 10, 1928 PRESIDENTIAL PREFERENCE, APRIL 10, 1928" (PDF). Illinois State Board of Elections. Archived from the original (PDF) on February 1, 2022. Retrieved August 5, 2020.
  25. Warren, Kenneth F.; Encyclopedia of U.S. campaigns, elections, and electoral behavior: A-M, Volume 1, p. 620 ISBN   1412954894
  26. Groves, Charles; ‘Lowden Supporters Count Great Gain: Aided by Illinois Primary Victory and Farm Bill Claim 185 Delegates – Buck Silent on Story Dawes Will Get Them’; Daily Boston Globe , April 15, 1928, p. A8
  27. Our Campaigns; IL US President Race, November 06, 1928
  28. 1 2 Phillips; The Emerging Republican Majority, p. 387
  29. Duncan-Clark, S.J.; ‘Uncertainties in Illinois Campaign: Republican Factionalism in Cook County Cause for Grave Misgivings. Democratic Ranks Broken: Fears of Tammany in the White House Loom Large Throughout the State’; The New York Times, September 23, 1928, p. E1