Demographics of Andorra

Last updated

Demographics of Andorra
Population pyramid of Andorra 2016.png
Population pyramid of Andorra in 2016
Population85,560 (2022 est.)
Growth rate-0.1% (2022 est.)
Birth rate6.2 births/1,000 population (2022)
Death rate4.5 deaths/1,000 population (2022)
Life expectancy83.42 years
  male81.2 years
  female85.79 years
Fertility rate0.94 children born/woman (2022)
Infant mortality rate3.44 deaths/1,000 live births
Net migration rate0 migrant(s)/1,000 population (2022 est.)
Age structure
0–14 years13.37%
65 and over17.36%
Sex ratio
Total1.05 male(s)/female (2022 est.)
At birth1.07 male(s)/female
Under 151.06 male(s)/female
65 and over0.9 male(s)/female
Nationality
NationalityAndorran
Language
OfficialCatalan

This is a demography of the population of Andorra, including population density, ethnicity, education level, health of the populace, economic status, religious affiliations and other aspects of the population.

Contents

Andorrans are a minority in their own country; Spanish, French, and Portuguese residents make up 67.7% of the population.

The national language is Catalan, a Romance language in the Western Romance group. It is spoken by more than 9 million people in the nearby territories of Spain and France. Spanish, French, and Portuguese are also spoken.

Andorrans live in seven urbanized valleys that form Andorra's political districts the seven parròquies (parishes):

Population size and structure

Historical populations
YearPop.±% p.a.
19506,176    
19608,392+3.11%
197019,545+8.82%
198035,460+6.14%
199054,507+4.39%
200065,844+1.91%
201085,015+2.59%
201578,014−1.70%
Source: Departament d'Estadística d'Andorra [1]

Population

The latest population figure (dec. 2023) of Andorra is 85,101.

Median age

Total: 46.2 years
Male: 46.3 years
Female: 46.1 years (2020 est.)

Sex ratio

At birth: 1.07 male(s)/female
Under 15 years: 1.06 male(s)/female
15-64 years: 1.05 male(s)/female
65 years and over: 1.03 male(s)/female
Total population: 1.05 male(s)/female (2023 est.)

Structure of the population

Population Estimates by Sex and Age Group (01.I.2021) (Population statistics are compiled from registers.): [2]
Age GroupMaleFemaleTotal%
Total39 74038 27578 015100
0–41 3151 2352 5503.27
5–91 8161 7893 6054.62
10–142 1462 0294 1755.35
15–192 1001 9734 0735.22
20–242 3142 0054 3195.54
25–292 4642 1744 6385.95
30–342 6542 5135 1676.62
35–393 0122 9625 9747.66
40–443 3843 4186 8028.72
45–493 7173 6457 3629.44
50–543 5553 3236 8788.82
55–593 2933 0456 3388.12
60–642 5442 3544 8986.28
65-691 8601 7453 6054.62
70-741 4421 4022 8443.65
75-791 0241 0282 0522.63
80-845637401 3031.67
85-893375088451.08
90-941582944520.58
95+42931350.17
Age groupMaleFemaleTotalPercent
0–145 2775 05310 33013.24
15–6429 03727 41256 44972.36
65+5 4265 81011 23614.40

Vital statistics

From state sources: [3]

Average populationLive birthsDeathsNatural changeCrude birth rate (per 1000)Crude death rate (per 1000)Natural change (per 1000)Fertility rate
19485,50092583416.610.56.1
19495,80085483714.68.26.4
19506,10094613315.510.15.4
19516,200104634116.710.16.6
19526,10098494916.18.08.1
19535,700101534817.69.38.3
19545,50096514517.39.28.1
19555,800108555318.59.49.1
19566,200110614917.79.87.9
19576,300111476417.67.410.4
19586,800138558320.48.112.3
19597,2001575710021.97.914.0
19607,8001807310723.09.314.0
19618,7001856112421.37.014.3
19629,6002427217025.17.517.6
196310,8002627518724.26.917.3
196411,8002757719823.36.516.8
196512,9003087523323.95.818.1
196614,0002928820420.96.314.6
196715,0003309323722.16.215.9
196816,4003759627922.95.917.0
196917,70039011327722.06.415.6
197018,90039510229320.95.415.5
197120,0004149132320.74.516.2
197221,00048211037223.25.217.0
197322,30047513234321.35.915.4
197423,90054511642922.84.818.0
197525,7005158842720.13.416.7
197626,70046914332617.65.412.2
197727,50046912234717.14.412.7
197829,10044114030115.24.810.4
197930,70042011031013.73.610.1
198033,40057715342417.34.612.7
198136,60056015640415.34.311.0
198238,90063012750316.23.312.9
198340,80056315740613.83.810.0
198442,20047216430811.23.97.3
198543,70055716539212.83.89.0
198645,80054717936811.93.98.0
198747,70052717635111.03.77.3
198849,50057220636611.64.27.4
198950,70063420942512.54.18.4
199052,70062819143711.93.68.3
199156,80067821746111.93.88.1
199260,30072921951012.13.68.5
199363,40072321151211.43.38.1
199464,80070418452010.92.88.1
199564,10070221948311.03.47.6
199664,20070019750310.93.17.8
199764,90073019753311.23.08.2
199865,60078123554611.93.68.3
199965,90083320762612.53.19.4
200065,90069822747111.33.97.4
200166,10073321551811.83.68.2
200266,70074921853111.23.37.9
200369,70072122150010.33.27.1
200474,60081428153310.93.87.1
200577,70082827655210.73.67.1
200679,90084326058310.63.37.3
200782,20082623059610.12.87.3
200883,80087523763810.42.87.6
200984,3008382725669.93.26.7
201073,60082823958911.33.28.01.41
201169,77279327551811.43.97.41.38
201269,75873730343410.64.36.21.33
201369,9666372393989.13.45.71.18
201470,5706392763639.13.95.11.21
201571,7326592823779.23.95.31.23
201673,1056343103248.74.24.41.19
201774,7945883232657.94.33.51.13
201876,1775433352087.14.42.71.03
201977,5435393012387.03.93.11.03
202078,0155394191206.95.41.51.03
202179,5355033861176.34.91.40.97
202281,5885023711316.24.51.70.94
2023 [4] 85,1014583571015.44.21.20.79

Infant mortality rate

Total: 3.39 deaths/1,000 live births
country comparison to the world: 199
Male: 3.49 deaths/1,000 live births
Female: 3.27 deaths/1,000 live births (2023 est.)

Life expectancy at birth

Total population: 83.61 years
Country comparison to the world: 9
Male: 81.40 years
Female: 85.97 years (2023 est.)

Ethnic groups

Andorrans 48.3% (2023 est.)
Spanish 24.8%
Portuguese 11.2%
French 4.5%
Argentine 1.4%
Other 9.8% (including Britons and Italians)
(These figures correspond to ethnicity and not mother tongue or citizenship.)

Common Languages

Catalan (official)
Spanish
French
Portuguese

Religion

Andorra religiosity (Census 2011)
Roman Catholic
88.2%
Protestant
2.1%
Other Christian
1.8%
Islam
2.6%
No response
2.8%
No religion
2.5%


Related Research Articles

<span class="mw-page-title-main">Demographics of Angola</span>

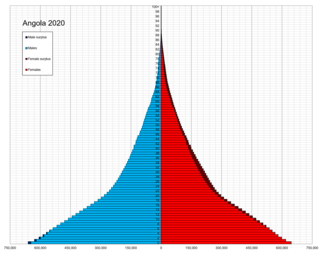
Demographic features of the population of Angola include population density, ethnicity, education level, health of the populace, economic status, religious affiliations and other aspects.

<span class="mw-page-title-main">Demographics of Cape Verde</span>

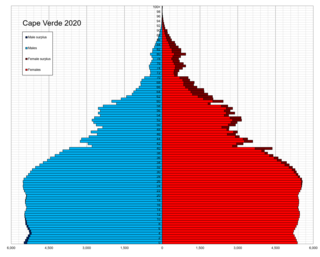
Demographic features of the population of Cape Verde include population density, ethnicity, education level, health of the populace, economic status, religious affiliations and other aspects of the population.

<span class="mw-page-title-main">Demographics of Costa Rica</span>

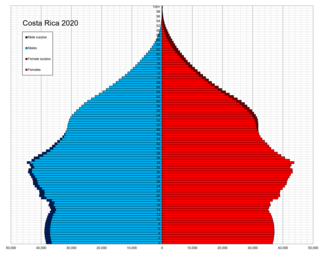
This is a demographic article about Costa Rica's population, including population density, ethnicity, education level, health of the populace, economic status, religious affiliations, and other aspects of the population.

<span class="mw-page-title-main">Demographics of the Dominican Republic</span>

This is a demography of the population of the Dominican Republic including population density, ethnicity, education level, health of the populace, economic status, religious affiliations and other aspects of the population.

<span class="mw-page-title-main">Demographics of Equatorial Guinea</span>

Demographic features of the population of Equatorial Guinea include population density, ethnicity, education level, health of the populace, economic status, religious affiliations and other aspects of the population.

Demographic features of the population of French Polynesia include population density, ethnicity, education level, health of the populace, economic status, religious affiliations and other aspects.

<span class="mw-page-title-main">Demographics of Gibraltar</span> Demographics of Gibraltar

Demographic features of the population of Gibraltar include ethnicity, education level, health of the populace, economic status, religious affiliations and other aspects.

<span class="mw-page-title-main">Demographics of Guatemala</span>

This is a demography of the population of Guatemala including population density, ethnicity, education level, health of the populace, economic status, religious affiliations and other aspects of the population.

<span class="mw-page-title-main">Demographics of Kiribati</span>

Demographic features of the population of Kiribati include population density, ethnicity, education level, health of the populace, economic status, religious affiliations and other aspects of the population.

<span class="mw-page-title-main">Demographics of Mali</span>

Demographic features of the population of Mali include population density, ethnicity, education level, health of the populace, economic status, religious affiliations and other aspects of the population.

Demographic features of the population of Mayotte include population density, ethnicity, education level, health of the populace, economic status, religious affiliations and other aspects of the population. Mayotte's population density went from 179 persons per square kilometer in 1985 to 251 per square kilometer in 1991. Its capital, Dzaoudzi had a population of 5,865 according to the 1985 census; the island's largest town, Mamoudzou, had 12,026 people.

<span class="mw-page-title-main">Demographics of Palau</span>

Demographic features of the population of Palau include population density, ethnicity, education level, health of the populace, economic status, religious affiliations and other aspects.

This is a demography of the population of Saint Pierre and Miquelon including population density, ethnicity, education level, health of the populace, economic status, religious affiliations and other aspects of the population.

<span class="mw-page-title-main">Demographics of Samoa</span> Demographics of country

Demographic features of the population of Samoa include population density, ethnicity, education level, health of the populace, economic status, religious affiliations and other aspects of the population.

<span class="mw-page-title-main">Demographics of Senegal</span>

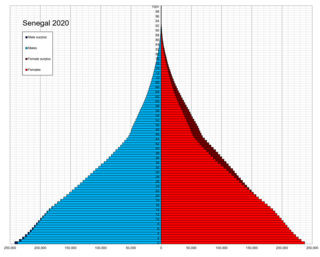
Demographic features of the population of Senegal include population density, ethnicity, education level, health of the populace, economic status, religious affiliations and other aspects of the population.

<span class="mw-page-title-main">Demographics of Eswatini</span>

Demographic features of the population of Eswatini include population density, ethnicity, education level, health of the populace, economic status, religious affiliations and other aspects of the population.

<span class="mw-page-title-main">Demographics of Uruguay</span> Demographics of country

This is a demography of the population of Uruguay including population density, ethnicity, education level, health of the populace, economic status, religious affiliations and other aspects of the population.

<span class="mw-page-title-main">Demographics of Algeria</span> Demographics of a country

Demographic features of the population of Algeria include population density, ethnicity, education level, health of the populace, economic status, religious affiliations and other aspects.

<span class="mw-page-title-main">Demographics of Cuba</span>

The demographic characteristics of Cuba are known through census which have been conducted and analyzed by different bureaus since 1774. The National Office of Statistics of Cuba (ONE) since 1953. The most recent census was conducted in September 2012. The population of Cuba at the 2012 census was nearly 11.2 million. The population density is 101 inhabitants per square kilometer, and the overall life expectancy in Cuba is 78.0 years. The population has always increased from one census to the next in the 20th century, with the exception of the 2012 census, when the count decreased by 10,000. Since 1740, Cuba's birth rate has surpassed its death rate; the natural growth rate of the country is positive. Cuba is in the fourth stage of demographic transition. In terms of age structure, the population is dominated (71.1%) by the 15- to 64-year-old segment. The median age of the population is 39.5, making it the oldest in the Americas, and the gender ratio of the total population is 0.99 males per female.

<span class="mw-page-title-main">Languages of Andorra</span>

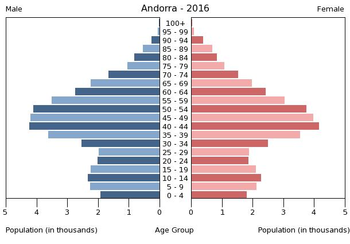
The historic and official language of Andorra is Catalan, a Romance language. Because of immigration, historical links, and close geographic proximity, Spanish and French are commonly spoken. There is a sizeable immigrant community that speaks Portuguese. Most Andorran residents can speak one or more of these, in addition to Catalan. Spanish was the most common mother tongue in Andorra according to mother tongue percentage statistics by the Andorran Government released in 2018. In 2022, Catalan became the most common mother tongue used by 55.2% of the Andorran population.

References

  1. "Poblacio total, Departament d'Estadística d'Andorra". Archived from the original on 2017-01-15. Retrieved 2019-11-25.
  2. "UNSD — Demographic and Social Statistics". unstats.un.org. Retrieved 2023-05-10.
  3. "Departament d'Estadística".
  4. "A004 Estadística del moviment natural de població - A006 Estadística de matrimonis, divorcis, separacions i nul·litats - A007 Indicadors demogràfics bàsics. Any 2023" (PDF). Archived from the original (PDF) on 2024-05-17. Retrieved 2024-05-17.