Demographics of Luxembourg | |
---|---|
Population | 672,050 (2024 est.) |
Growth rate | 1.64% (2022 est.) |
Birth rate | 11.61 births/1,000 population (2022 est.) |
Death rate | 7.21 deaths/1,000 population (2022 est.) |
Life expectancy | 82.98 years |
• male | 80.52 years |
• female | 85.58 years (2022 est.) |
Fertility rate | 1.63 children born/woman (2022 est.) |
Infant mortality rate | 3.25 deaths/1,000 live births |
Net migration rate | 12.01 migrant(s)/1,000 population (2022 est.) |
Age structure | |
0–14 years | 16.73% |
65 and over | 15.37% |
Sex ratio | |
Total | 1.02 male(s)/female (2022 est.) |
At birth | 1.06 male(s)/female |
Under 15 | 1.06 male(s)/female |
65 and over | 0.7 male(s)/female |
Nationality | |
Nationality | Luxembourger |
Major ethnic | Luxembourger (52.7%) |
Language | |
Official | Luxembourgish, French, German |
Spoken | Luxembourgish |
Year | Pop. | ±% |
---|---|---|
1821 | 134,082 | — |
1839 | 175,223 | +30.7% |
1851 | 194,719 | +11.1% |
1861 | 197,731 | +1.5% |
1871 | 204,028 | +3.2% |
1880 | 210,507 | +3.2% |
1890 | 211,481 | +0.5% |
1900 | 234,674 | +11.0% |
1910 | 259,027 | +10.4% |
1922 | 261,643 | +1.0% |
1930 | 299,782 | +14.6% |
1947 | 290,992 | −2.9% |
1960 | 314,889 | +8.2% |
1970 | 339,841 | +7.9% |
1981 | 364,302 | +7.2% |
1991 | 384,634 | +5.6% |
2001 | 439,539 | +14.3% |
2011 | 512,353 | +16.6% |
2021 | 643,941 | +25.7% |
Source: [1] 2020 data [2] |
Demographic features of the population of Luxembourg include population density, education level, health of the populace, economic status, religious affiliations and other aspects of the population.
The following is an overview of the demographics of Luxembourg . Demographic topics include basic statistics, most populous cities, and religious affiliation.
The population of Luxembourg as of 1 January 2024 was 672,050 (52.7% Luxembourgers and 47.3% of foreign nationality). [3]
The people of Luxembourg are called Luxembourgers. [4]
The population of Luxembourg in 2024 is 672,050.
1.8% (2020 est.)
1.62 children born/woman (2020 est.)
Period [5] | Life expectancy in Years | Period | Life expectancy in Years |
---|---|---|---|
1950–1955 | 66.0 | 1990–1995 | 75.8 |
1955–1960 | 67.6 | 1995–2000 | 77.0 |
1960–1965 | 69.1 | 2000–2005 | 78.3 |
1965–1970 | 69.8 | 2005–2010 | 79.5 |
1970–1975 | 70.2 | 2010–2015 | 81.2 |
1975–1980 | 71.5 | 2015–2020 | 82.0 |
1980–1985 | 72.9 | 2020–2025 | 82.8 |
1985–1990 | 74.5 | 2025–2030 | 83.6 |
Source: UN World Population Prospects
(2020 est.)
The following table chronicles factors such as population, birth rates, and death rates in Luxembourg since 1900. [6]
Average population | Live births | Deaths | Natural change | Crude birth rate (per 1000) | Crude death rate (per 1000) | Natural change (per 1000) | Fertility rates | |
---|---|---|---|---|---|---|---|---|
1900 | 234,000 | 7,037 | 5,109 | 1,928 | 30.1 | 21.9 | 8.2 | |
1901 | 236,000 | 7,444 | 4,300 | 3,144 | 31.5 | 18.2 | 13.3 | |
1902 | 238,000 | 7,416 | 4,460 | 2,956 | 31.1 | 18.7 | 12.4 | |
1903 | 241,000 | 7,279 | 4,686 | 2,593 | 30.3 | 19.5 | 10.8 | |
1904 | 243,000 | 7,535 | 4,952 | 2,583 | 31.0 | 20.4 | 10.6 | |
1905 | 245,000 | 7,431 | 4,851 | 2,580 | 30.3 | 19.8 | 10.5 | |
1906 | 248,000 | 7,516 | 4,844 | 2,672 | 30.3 | 19.6 | 10.8 | |
1907 | 250,000 | 7,738 | 4,482 | 3,256 | 30.9 | 17.9 | 13.0 | |
1908 | 253,000 | 7,639 | 4,933 | 2,706 | 30.2 | 19.5 | 10.7 | |
1909 | 256,000 | 7,264 | 4,752 | 2,512 | 28.4 | 18.6 | 9.8 | |
1910 | 258,000 | 7,065 | 4,321 | 2,744 | 27.4 | 16.7 | 10.6 | |
1911 | 260,000 | 7,126 | 4,892 | 2,234 | 27.4 | 18.8 | 8.6 | |
1912 | 262,000 | 7,051 | 4,556 | 2,495 | 26.9 | 17.4 | 9.5 | |
1913 | 264,000 | 7,009 | 4,383 | 2,626 | 26.5 | 16.6 | 9.9 | |
1914 | 266,000 | 6,781 | 4,446 | 2,335 | 25.5 | 16.7 | 8.8 | |
1915 | 265,000 | 5,701 | 4,126 | 1,575 | 21.5 | 15.6 | 5.9 | |
1916 | 264,000 | 4,958 | 4,246 | 712 | 18.8 | 16.1 | 2.7 | |
1917 | 263,000 | 4,516 | 4,730 | -214 | 17.1 | 18.0 | -0.8 | |
1918 | 263,000 | 4,413 | 5,611 | -1,198 | 16.8 | 21.4 | -4.6 | |
1919 | 262,000 | 4,638 | 4,627 | 11 | 17.7 | 17.7 | 0.0 | |
1920 | 261,000 | 5,621 | 3,404 | 2,217 | 21.6 | 13.1 | 8.5 | |
1921 | 261,000 | 5,494 | 3,444 | 2,050 | 21.1 | 13.2 | 7.9 | |
1922 | 262,000 | 5,094 | 3,538 | 1,556 | 19.5 | 13.5 | 5.9 | |
1923 | 263,000 | 5,468 | 3,581 | 1,887 | 20.8 | 13.6 | 7.2 | |
1924 | 266,000 | 5,369 | 3,421 | 1,948 | 20.2 | 12.9 | 7.3 | |
1925 | 268,000 | 5,619 | 3,791 | 1,828 | 21.0 | 14.1 | 6.8 | |
1926 | 270,000 | 5,639 | 4,100 | 1,539 | 20.9 | 15.2 | 5.7 | |
1927 | 278,000 | 5,864 | 3,909 | 1,955 | 21.1 | 14.1 | 7.0 | |
1928 | 287,000 | 6,114 | 4,017 | 2,097 | 21.3 | 14.0 | 7.3 | |
1929 | 292,000 | 6,210 | 4,553 | 1,657 | 21.3 | 15.6 | 5.7 | |
1930 | 297,000 | 6,377 | 3,876 | 2,501 | 21.4 | 13.0 | 8.4 | |
1931 | 300,000 | 5,988 | 3,971 | 2,017 | 20.0 | 13.3 | 6.7 | |
1932 | 299,000 | 5,295 | 3,949 | 1,346 | 17.7 | 13.2 | 4.5 | |
1933 | 298,000 | 4,895 | 3,725 | 1,170 | 16.4 | 12.5 | 3.9 | |
1934 | 298,000 | 4,665 | 3,535 | 1,130 | 15.7 | 11.9 | 3.8 | |
1935 | 297,000 | 4,523 | 3,740 | 783 | 15.2 | 12.6 | 2.6 | |
1936 | 298,000 | 4,514 | 3,433 | 1,081 | 15.2 | 11.5 | 3.6 | |
1937 | 299,000 | 4,514 | 3,555 | 959 | 15.1 | 11.9 | 3.2 | |
1938 | 301,000 | 4,486 | 3,811 | 675 | 14.9 | 12.7 | 2.2 | |
1939 | 300,000 | 4,511 | 3,804 | 707 | 15.0 | 12.7 | 2.4 | |
1940 | 296,000 | 3,959 | 3,580 | 379 | 13.4 | 12.1 | 1.3 | |
1941 | 292,000 | 4,029 | 4,065 | -36 | 13.8 | 13.9 | -0.1 | |
1942 | 290,000 | 4,506 | 4,220 | 286 | 15.6 | 14.6 | 1.0 | |
1943 | 289,000 | 4,277 | 4,437 | -160 | 14.8 | 15.4 | -0.6 | |
1944 | 285,000 | 4,128 | 5,406 | -1,278 | 14.5 | 18.9 | -4.5 | |
1945 | 284,000 | 3,775 | 4,585 | -810 | 13.3 | 16.2 | -2.9 | |
1946 | 286,000 | 4,263 | 3,525 | 738 | 14.9 | 12.3 | 2.6 | |
1947 | 289,000 | 4,178 | 3,548 | 630 | 14.5 | 12.3 | 2.2 | |
1948 | 292,000 | 4,162 | 3,400 | 762 | 14.3 | 11.6 | 2.6 | |
1949 | 294,000 | 4,026 | 3,676 | 350 | 13.7 | 12.5 | 1.2 | |
1950 | 296,000 | 4,116 | 3,401 | 715 | 13.9 | 11.5 | 2.4 | |
1951 | 297,000 | 4,176 | 3,456 | 720 | 14.0 | 11.6 | 2.4 | |
1952 | 299,000 | 4,535 | 3,557 | 978 | 15.2 | 11.9 | 3.3 | |
1953 | 301,000 | 4,565 | 3,737 | 828 | 15.2 | 12.4 | 2.7 | |
1954 | 303,000 | 4,713 | 3,421 | 1,292 | 15.6 | 11.3 | 4.3 | |
1955 | 305,000 | 4,962 | 3,453 | 1,509 | 16.3 | 11.3 | 5.0 | |
1956 | 307,000 | 4,833 | 3,878 | 955 | 15.8 | 12.6 | 3.1 | 2.08 |
1957 | 309,000 | 4,954 | 3,811 | 1,143 | 16.1 | 12.4 | 3.7 | 2.13 |
1958 | 310,000 | 4,959 | 3,512 | 1,447 | 16.0 | 11.3 | 4.7 | 2.13 |
1959 | 312,000 | 5,037 | 3,607 | 1,430 | 16.1 | 11.6 | 4.6 | 2.16 |
1960 | 314,000 | 5,019 | 3,716 | 1,303 | 16.0 | 11.8 | 4.1 | 2.37 |
1961 | 317,000 | 5,112 | 3,616 | 1,496 | 16.1 | 11.4 | 4.7 | 2.42 |
1962 | 321,000 | 5,137 | 4,037 | 1,100 | 16.0 | 12.6 | 3.4 | 2.41 |
1963 | 324,000 | 5,112 | 3,929 | 1,183 | 15.8 | 12.1 | 3.7 | 2.37 |
1964 | 328,000 | 5,229 | 3,857 | 1,372 | 16.0 | 11.8 | 4.2 | 2.40 |
1965 | 332,000 | 5,297 | 4,057 | 1,240 | 16.0 | 12.2 | 3.7 | 2.39 |
1966 | 334,000 | 5,194 | 4,133 | 1,061 | 15.6 | 12.4 | 3.2 | 2.36 |
1967 | 335,000 | 4,957 | 4,166 | 791 | 14.8 | 12.4 | 2.4 | 2.25 |
1968 | 336,000 | 4,780 | 4,138 | 642 | 14.2 | 12.3 | 1.9 | 2.14 |
1969 | 338,000 | 4,503 | 4,202 | 301 | 13.3 | 12.5 | 0.9 | 2.03 |
1970 | 339,000 | 4,476 | 4,168 | 308 | 13.2 | 12.3 | 0.9 | 1.97 |
1971 | 342,000 | 4,512 | 4,416 | 96 | 13.2 | 12.9 | 0.3 | 1.96 |
1972 | 347,000 | 4,138 | 4,120 | 18 | 11.9 | 11.9 | 0.1 | 1.75 |
1973 | 351,000 | 3,847 | 4,184 | -337 | 11.0 | 11.9 | -1.0 | 1.58 |
1974 | 355,000 | 3,925 | 4,291 | -366 | 11.1 | 12.1 | -1.0 | 1.57 |
1975 | 359,000 | 3,997 | 4,376 | -379 | 11.1 | 12.2 | -1.1 | 1.55 |
1976 | 361,000 | 3,915 | 4,507 | -592 | 10.8 | 12.5 | -1.6 | 1.48 |
1977 | 362,000 | 4,053 | 4,083 | -30 | 11.2 | 11.3 | -0.1 | 1.49 |
1978 | 362,000 | 4,072 | 4,187 | -115 | 11.2 | 11.6 | -0.3 | 1.47 |
1979 | 363,000 | 4,078 | 3,985 | 93 | 11.2 | 11.0 | 0.3 | 1.47 |
1980 | 364,000 | 4,169 | 4,113 | 56 | 11.4 | 11.3 | 0.2 | 1.50 |
1981 | 365,000 | 4,414 | 4,105 | 309 | 12.1 | 11.2 | 0.8 | 1.55 |
1982 | 366,000 | 4,300 | 4,133 | 167 | 11.8 | 11.3 | 0.5 | 1.49 |
1983 | 366,000 | 4,185 | 4,129 | 56 | 11.4 | 11.3 | 0.2 | 1.44 |
1984 | 366,000 | 4,192 | 4,072 | 120 | 11.5 | 11.1 | 0.3 | 1.42 |
1985 | 367,000 | 4,104 | 4,027 | 77 | 11.2 | 11.0 | 0.2 | 1.38 |
1986 | 368,000 | 4,309 | 3,970 | 339 | 11.7 | 10.8 | 0.9 | 1.44 |
1987 | 371,000 | 4,238 | 4,012 | 226 | 11.4 | 10.8 | 0.6 | 1.39 |
1988 | 374,000 | 4,603 | 3,840 | 763 | 12.3 | 10.3 | 2.0 | 1.51 |
1989 | 378,000 | 4,665 | 3,984 | 681 | 12.4 | 10.6 | 1.8 | 1.52 |
1990 | 382,000 | 4,936 | 3,773 | 1,163 | 12.9 | 9.9 | 3.0 | 1.62 |
1991 | 387,000 | 4,986 | 3,744 | 1,242 | 12.9 | 9.7 | 3.2 | 1.60 |
1992 | 392,000 | 5,149 | 4,022 | 1,127 | 13.1 | 10.3 | 2.9 | 1.67 |
1993 | 397,000 | 5,353 | 3,915 | 1,438 | 13.5 | 9.8 | 3.6 | 1.69 |
1994 | 403,000 | 5,451 | 3,800 | 1,651 | 13.5 | 9.4 | 4.1 | 1.72 |
1995 | 409,000 | 5,421 | 3,797 | 1,624 | 13.3 | 9.3 | 4.0 | 1.67 |
1996 | 414,000 | 5,689 | 3,895 | 1,794 | 13.7 | 9.4 | 4.3 | 1.76 |
1997 | 419,000 | 5,503 | 3,937 | 1,566 | 13.1 | 9.4 | 3.7 | 1.71 |
1998 | 425,000 | 5,386 | 3,901 | 1,485 | 12.7 | 9.2 | 3.5 | 1.67 |
1999 | 430,000 | 5,582 | 3,793 | 1,789 | 13.0 | 8.8 | 4.2 | 1.71 |
2000 | 436,000 | 5,723 | 3,754 | 1,969 | 13.1 | 8.6 | 4.5 | 1.78 |
2001 | 442,000 | 5,459 | 3,719 | 1,740 | 12.4 | 8.4 | 3.9 | 1.66 |
2002 | 446,000 | 5,345 | 3,744 | 1,601 | 12.0 | 8.4 | 3.6 | 1.63 |
2003 | 452,000 | 5,303 | 4,053 | 1,250 | 11.7 | 9.0 | 2.8 | 1.62 |
2004 | 458,000 | 5,452 | 3,578 | 1,874 | 11.9 | 7.8 | 4.1 | 1.66 |
2005 | 465,000 | 5,371 | 3,621 | 1,750 | 11.5 | 7.8 | 3.8 | 1.62 |
2006 | 473,000 | 5,514 | 3,766 | 1,748 | 11.7 | 8.0 | 3.7 | 1.64 |
2007 | 480,000 | 5,477 | 3,866 | 1,611 | 11.4 | 8.1 | 3.4 | 1.61 |
2008 | 489,000 | 5,596 | 3,595 | 2,001 | 11.5 | 7.4 | 4.1 | 1.60 |
2009 | 498,000 | 5,638 | 3,657 | 1,982 | 11.3 | 7.3 | 4.0 | 1.59 |
2010 | 507,000 | 5,874 | 3,760 | 2,114 | 11.6 | 7.4 | 4.2 | 1.63 |
2011 | 518,000 | 5,639 | 3,819 | 1,820 | 10.9 | 7.4 | 3.5 | 1.51 |
2012 | 531,000 | 6,026 | 3,876 | 2,150 | 11.4 | 7.3 | 4.1 | 1.57 |
2013 | 543,000 | 6,115 | 3,822 | 2,293 | 11.2 | 7.0 | 4.2 | 1.55 |
2014 | 556,000 | 6,070 | 3,841 | 2,229 | 10.9 | 6.9 | 4.0 | 1.50 |
2015 | 576,000 | 6,115 | 3,983 | 2,132 | 10.9 | 7.0 | 3.9 | 1.47 |
2016 | 590,000 | 6,050 | 3,967 | 2,083 | 10.4 | 6.8 | 3.6 | 1.40 |
2017 | 602,000 | 6,174 | 4,263 | 1,911 | 10.4 | 7.1 | 3.3 | 1.39 |
2018 | 608,000 | 6,274 | 4,318 | 1,956 | 10.3 | 7.1 | 3.2 | 1.38 |
2019 | 613,900 | 6,230 | 4,283 | 1,947 | 10.0 | 6.9 | 3.1 | 1.34 |
2020 | 626,100 | 6,459 | 4,609 | 1,850 | 10.2 | 7.3 | 2.9 | 1.37 |
2021 | 634,730 | 6,690 | 4,489 | 2,201 | 10.4 | 7.0 | 3.4 | 1.38 |
2022 | 645,397 | 6,495 | 4,449 | 2,046 | 9.8 | 6.7 | 3.1 | 1.31 |
2023 | 660,809 | 6,320 | 4,431 | 1,889 | 9.5 | 6.6 | 2.9 | 1.25 |
Period | Live births | Deaths | Natural increase |
---|---|---|---|
January - September 2022 | 4,686 | 3,313 | +1,373 |
January - September 2023 | 4,594 | 3,252 | +1,342 |
Difference | -92 (−1.96%) | -61 (−1.84%) | -31 |
Age Group | Male | Female | Total | % |
---|---|---|---|---|
Total | 319 456 | 315 274 | 634 730 | 100 |
0–4 | 16 900 | 16 355 | 33 255 | 5.24 |
5–9 | 17 641 | 16 618 | 34 259 | 5.40 |
10–14 | 17 291 | 16 590 | 33 881 | 5.34 |
15–19 | 17 179 | 15 892 | 33 071 | 5.21 |
20–24 | 19 975 | 18 739 | 38 714 | 6.10 |
25–29 | 24 373 | 23 227 | 47 600 | 7.50 |
30–34 | 25 947 | 25 103 | 51 050 | 8.04 |
35–39 | 24 798 | 24 587 | 49 385 | 7.78 |
40–44 | 24 400 | 23 790 | 48 190 | 7.59 |
45–49 | 23 728 | 22 533 | 46 261 | 7.29 |
50–54 | 24 324 | 22 633 | 46 957 | 7.40 |
55–59 | 22 789 | 21 070 | 43 859 | 6.91 |
60–64 | 18 034 | 17 477 | 35 511 | 5.59 |
65-69 | 13 904 | 14 266 | 28 170 | 4.44 |
70-74 | 11 176 | 11 828 | 23 004 | 3.62 |
75-79 | 7 593 | 8 844 | 16 437 | 2.59 |
80-84 | 5 290 | 7 492 | 12 782 | 2.01 |
85-89 | 2 853 | 5 009 | 7 862 | 1.24 |
90-94 | 1 100 | 2 493 | 3 593 | 0.57 |
95-99 | 148 | 657 | 805 | 0.13 |
100-104 | 10 | 67 | 77 | 0.01 |
105-109 | 2 | 3 | 5 | <0.01 |
110+ | 1 | 1 | 2 | <0.01 |
Age group | Male | Female | Total | Percent |
0–14 | 51 832 | 49 563 | 101 395 | 15.97 |
15–64 | 225 547 | 215 051 | 440 598 | 69.42 |
65+ | 42 077 | 50 660 | 92 737 | 14.61 |
In 2020, 64% of children born in Luxembourg were to mothers of foreign origin, both from other EU member states and from non-EU countries. [10]
This section needs additional citations for verification .(February 2015) |
Luxembourg does not formally collect ethnic or racial data of its citizens. [11] The foreign population resident in Luxembourg currently numbers over 313,407, corresponding to 47.43% of the total population (compared to 13.2% in 1961). [3] That means there are currently almost as many immigrants as there are native citizens. These immigrants are overwhelmingly [12] nationals of EU countries (accounting for over 80%), by far the greater part of whom originally come from Portugal, Italy and the two neighbouring countries, France and Belgium. For some years, there has also been a large increase in the number of immigrants and asylum seekers from the countries of Eastern Europe, and especially the new republics to have emerged from the former Yugoslavia (Bosnia and Herzegovina, Serbia and Montenegro). These immigrants include a considerable proportion of young people. Immigrants (especially asylum seekers) have a strong impact on the birth rate, accounting for nearly 50% of births in Luxembourg. The population of Ukrainian immigrants increased dramatically following the 2022 invasion of Ukraine, representing nearly a percent of the total population as of 2023. [13]
A more detailed breakdown by nationality [12] shows that the Portuguese community is still the largest group, accounting for around 30% of the foreign population. The Italian population has been stable for the past ten years at approximately 20,000. Some 80,000 foreigners come from bordering countries (France, Belgium and Germany).
Nationality [14] | ||
---|---|---|
1 January 2023 | ||
1 | Luxembourg | 347,402 |
2 | Portugal | 92,101 |
3 | France | 49,104 |
4 | Italy | 24,676 |
5 | Belgium | 19,205 |
6 | Germany | 12,678 |
7 | Spain | 9,068 |
8 | Romania | 6,625 |
9 | Ukraine | 5,238 |
10 | Poland | 5,130 |
11 | India | 4,657 |
12 | China | 4,295 |
13 | Greece | 4,268 |
14 | Netherlands | 3,956 |
15 | United Kingdom | 3,924 |
16 | Syria | 3,231 |
17 | Brazil | 3,050 |
18 | Montenegro | 2,806 |
19 | Cape Verde | 2,488 |
20 | Ireland | 2,372 |
- | Other | 54,535 |
Graphs are unavailable due to technical issues. There is more info on Phabricator and on MediaWiki.org. |
The predominant religion of the Luxembourg population is Roman Catholic, with Protestant, Anglican, Jewish, Muslim and Hindu minorities. According to a 1979 law, the government forbids collection of data on religious practices, but over 90% is estimated to be baptized Catholic (the Virgin Mary is the Patroness of the city of Luxembourg).
The Lutherans are the largest Protestant denomination in the country. Muslims are estimated to number approximately 6000 persons, notably including 1,500 refugees from Montenegro; Orthodox (Albanian, Greek, Montenegrin, Serbian, Russian, and Romanian) adherents are estimated to number approximately 5,000 persons, along with approximately 14,880 Jews. Freedom of religion is provided by the Luxembourg Constitution. [15]
The following demographic statistics are from the CIA World Factbook. [16]
census 2011 | Luxembourgish | Portuguese | French | German | Italian | English | Dutch | Spanish | Serbian | other |
---|---|---|---|---|---|---|---|---|---|---|
"main language" | 55,8 | 15,7 | 12,1 | 3,1 | 2,9 | 2,1 | 0,9 | 0,8 | 0,5 | |
spoken at home | 64,9 | 88 | 31,2 | 11,6 | 5,1 | 7,2 | 10,4 | |||
use in school | 79,6 | 10,2 | 49,1 | 39,3 | 1,7 | 20,4 | 6,5 | |||
use at the workplace | 60,5 | 14,6 | 68,2 | 34,2 | 4,8 | 28,5 | 7,3 |
The linguistic situation in Luxembourg is complicated. The "national language" is Luxembourgish, a West Germanic language based on the same German dialect as in the neighbouring part of Germany. Three languages are used by the administration: Luxembourgish, French and German. French is the only language of legislation [17]
According to the census of 2011, the residents of Luxembourg answer very differently about their use of language, depending on the context (see table). [18]
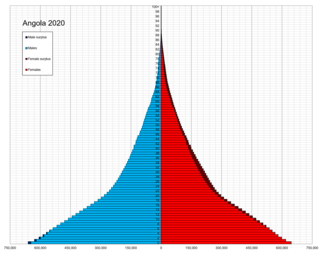
Demographic features of the population of Angola include population density, ethnicity, education level, health of the populace, economic status, religious affiliations and other aspects.
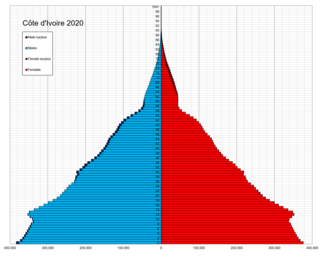
Demographic features of the population of Ivory Coast include population density, ethnicity, education level, health of the populace, economic status, religious affiliations and other aspects of the population.
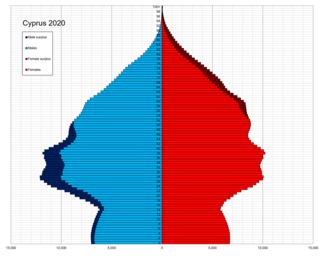
The people of Cyprus are broadly divided into two main ethnic communities, Greek Cypriots and Turkish Cypriots, who share many cultural traits but maintain distinct identities based on ethnicity, religion, language, and close ties with Greece and Turkey respectively. Before the dispute started in 1964 the peoples of Cyprus were dispersed over the entire island.
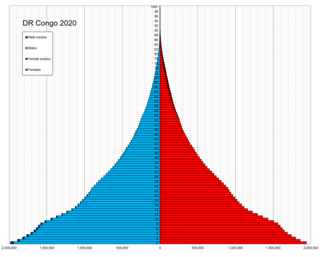
Demographic features of the population of the Democratic Republic of the Congo include ethnicity, education level, health, economic status, religious affiliations and other aspects of the population.
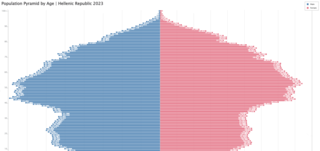
The Demographics of Greece refer to the demography of the population that inhabits the Greek peninsula. The population of Greece was estimated by the United Nations to be 10,445,365 in 2021.
Ireland had an estimated population of 5,281,600 as of 1 April 2023.
Luxembourg, officially the Grand Duchy of Luxembourg, is a small landlocked country in Western Europe. It is bordered by Belgium to the west and north, Germany to the east, and France to the south. Its capital and most populous city, Luxembourg, is one of the four institutional seats of the European Union and the seat of several EU institutions, notably the Court of Justice of the European Union, the highest judicial authority. Luxembourg's culture, people, and languages are highly intertwined with its French and German neighbors; while Luxembourgish is the only national language of the Luxembourgish people and of the Grand Duchy of Luxembourg, French is the only language for legislation, and all three – Luxembourgish, German and French – are used for administrative matters in the country.
Demographic features of the population of North Macedonia include population density, ethnicity, education level, health of the populace, economic status, religious affiliations and other aspects of the population.
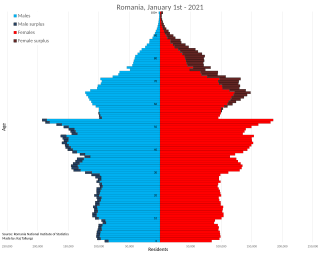
Demographic features of the population of Romania include population density, ethnicity, education level, health of the populace, economic status, religious affiliations, and other aspects of the population.
The demographics of Togo include ethnicity, population density, age, education level, health, economic status and religious affiliations.
This is a demography of the population of Uruguay including population density, ethnicity, education level, health of the populace, economic status, religious affiliations and other aspects of the population.
Demographic features of the population of Portugal include population density, ethnicity, education level, health of the populace, economic status, religious affiliations and other aspects of the population.
Demographic features of the population of Norway, including Jan Mayen, and Svalbard, where the hospital is not equipped for births, include population density, ethnicity, education level, health of the populace, economic status, religious affiliations and other aspects.
Demographic features of the population of Belgium include ethnicity, education level, health of the populace, economic status, religious affiliations and other aspects. All figures are from the National Institute for Statistics unless otherwise indicated.
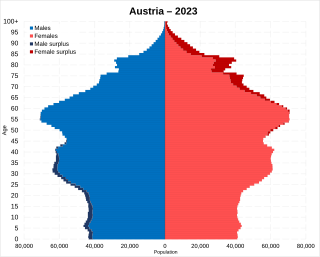
Demographic features of the population of Austria include population density, ethnicity, education level, health of the populace, economic status, religious affiliations and other aspects of the population.
Luxembourg's 100 communes conform to LAU Level 2 and are the country's lowest administrative divisions.
Portuguese Luxembourgers, also known as Luso-Luxembourgers, are the citizens or residents of Luxembourg whose ethnic origins lie in Portugal, including both Portuguese-born citizens with Luxembourg citizenship and Luxembourg-born citizens of Portuguese ancestry or citizenship.
Luxembourg nationality law is ruled by the Constitution of Luxembourg. The Grand Duchy of Luxembourg is a member state of the European Union and, therefore, its citizens are also EU citizens.
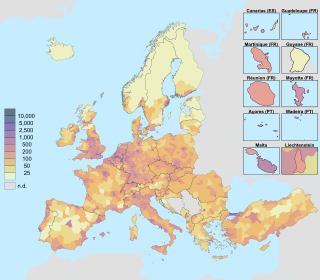
The demographics of the European Union show a highly populated, culturally diverse union of 27 member states. As of 1 January 2023, the population of the EU is around 448 million people.
Social class in Luxembourg after 1945 is generally based on occupation, personal income, and spending power as well as rights to social welfare rather than birth circumstances and family background. The country's demographic situation has changed considerably since 1945, where a mostly blue-collar working population gave way to mostly white-collar occupations over the second half of the twentieth century. Differences in consumer patterns between the white-collar and blue-collar workers decreased considerably between 1963 and 1977, causing a socio-economic evolution that saw a wider sphere of access for both working and middle classes to consumer goods such as cars, white goods, and real estate, thus demonstrating an equalisation of social strata in terms of income and spending power. The population of Luxembourg has also altered in nature due to significant growth in numbers of residents and increases in migration patterns since the mid-twentieth century; in 1961 13% of the population consisted of non-Luxembourgers, by 2020, this is at 44.3. At present, 47% of the Luxembourgish population has a migrant background’, and this is as a result of the response to socioeconomic processes that drew large numbers of immigrants to the country in the latter half of the twentieth century.