Demographics of Moldova

Last updated

Demographics of Moldova
Moldova Population Pyramid.svg
Moldova population pyramid in 2020
PopulationDecrease2.svg 2,512,800 [1] (01.01.2023, excluding Transnistria)
Density85.6 (excluding Transnistria)
(2021)
Growth rate−0.3 (2016)
Birth rate10.5 births/1,000 population
(2016)
Death rate10.8 deaths/1,000 population
(2016)
Life expectancy73.21 years (2017)
  male69.35 years
(2017)
  female76.96 years
(2017)
Fertility rate1.57 children born/woman
(2018)
Infant mortality rate9.4 deaths/1,000 live births (2017)
Net migration rate+0.0 migrant(s)/1,000 population (2012)
Age structure
0–14 years16.4%
(male 301,150/female 284,400)
15–64 years73.6%
(male 1,277,900/female 1,341,650)
65 and over10.0%
(male 133,060/female 222,270)
Sex ratio
Total0.91 male(s)/female (2008 est.)
At birth1.06 male(s)/female
Under 151.06 male(s)/female
15–64 years0.94 male(s)/female
65 and over0.59 male(s)/female
Nationality
NationalityMoldovans
Major ethnicMoldovans 75.1% [2]
Minor ethnic Romanians 7.0%, Ukrainians 6.6%, Gagauz 4.6%, Russians 4.1%, Bulgarians 1.9%
Language
OfficialRomanian language
SpokenRomanian, Russian, Gagauz

Demographic features of the population of Republic of Moldova include distribution, ethnicity, languages, religious affiliation and other statistical data.

Contents

Overview of the demographic statistics

According to the 2014 Moldovan Census, 2,789,205 people resided in the areas controlled by the central government of Republic of Moldova. Another 209,030 were non-resident citizens living abroad, for a total of 2,998,235. [3]

According to the 2015 census in Transnistria, 475,007 people lived in the breakaway Transnistria, including the city of Bender, and the other localities de facto controlled by Transnistrian authorities. [4] Thus, the total population of the country in 2014 amounted to 3,473,242.

Median age
total 34.3 years (2008 est.)
(up from 32.22 years in 2005)
male32.4 years
(up from 30.14 years in 2005)
female36.4 years
(up from 34.27 years in 2005)
Literacy rate
total96% (1989); 99.1% (2003); 99.1% (2005)
male99% (1989); 99.6% (2003); 99.7% (2005)
female94% (1989); 98.7% (2003); 98.6% (2005)
definition age 15 and over can read and write
Unemployment rate
8% (official), 40% (real)
Source: The World Factbook, CIA; [5] UN [6] , [7]

Urban–rural distribution of population

According to the 2014 census, 1,144,428 residents or 38,2% live in cities while 1,853,807 are rural residents. The largest cities under the control of the constitutional authorities are Chișinău with 644,204 (with 590,631 actual urban dwellers) and Bălți with 102,457 (97,930 urban dwellers). The autonomous territorial unit of Gagauzia has 134,535, out of which 48,666 or 36,2% are urban dwellers. Ungheni is the third largest city with 32,828, followed by Cahul with 28,763, Soroca with 22,196 and Orhei with 21,065. [8]

By district (2004 census)

notypenamepopulationurbanrural
population %citiespopulation %communes
1municipality Chișinău 712,218644,20490.45%768,0149.55%12
2municipality Bălți 127,561122,66996.16%14,8923.84%2
3auton.territ.unit Găgăuzia 155,64658,19037.39%397,45662.61%23
4district Anenii Noi 81,7108,35810.23%173,35289.77%25
5district Basarabeasca 28,97811,19238.62%117,78661.38%6
6district Briceni 78,02714,23018.24%263,79781.76%26
7district Cahul 119,23135,48829.76%183,74370.24%36
8district Cantemir 60,0013,8726.45%156,12993.55%26
9district Călărași 75,07514,51619.34%160,55980.66%27
10district Căușeni 90,61221,94124.21%268,67175.79%25 (out of 28)
11district Cimișlia 60,92512,85821.10%148,06778.90%22
12district Criuleni 72,2547,1389.88%165,11690.12%24
13district Dondușeni 46,4429,80121.10%136,64178.90%21
14district Drochia 87,09216,60619.07%170,48680.93%27
15district Dubăsari 43,01534,015100%11
16district Edineț 81,39023,065%258,325%30
17district Fălești 90,32014,931%175,389%32
18district Florești 89,38917,086%317,086%37
19district Glodeni 60,97510,465%150,510%18
20district Hîncești 119,76215,281%1104,481%38
21district Ialoveni 97,70415,041%182,663%24
22district Leova 51,05614,411%236,645%23
23district Nisporeni 64,92412,105%152,819%22
24district Ocnița 56,51019,270%337,240%18
25district Orhei 116,27125,641%190,630%37
26district Rezina 48,10510,196%137,909%24
27district Rîșcani 69,45413,351%256,103%26
28district Sîngerei 87,15315,760%271,393%24
29district Soroca 94,98628,362%166,624%34
30district Strășeni 88,90019,633%269,267%25
31district Șoldănești 42,2276,304%135,923%22
32district Ștefan Vodă 70,5947,768%162,826%22
33district Taraclia 43,15413,756%129,398%14
34district Telenești 70,1266,855%163,271%30
35district Ungheni 110,54535,311%275,234%31
Subtotal control by central government3,383,3321,305,65538.59%542,077,67761.41%844
36territorial unit Transnistria 383,806280,640163.85%10158,888136.15%69
37municipality Bender 91,19788,05596.86%13,1423.14%1
10parts of district Căușeni 14,93514,935100%3 (out of 28)
15parts of district Dubăsari 715715100%parts of 1
Subtotal control by breakaway Tiraspol555,347377,66768.01%11177,68031.99%73
Total3,938,6791,683,32242.74%652,255,35757.26%917

Note:1The breakaway Transnistrian authorities count as rural the population of the towns of Crasnoe, Maiac, and Tiraspolul Nou. Since their exact population isn't available, so does this table.

Transnistrian-controlled areas (2015 cens.)

[9]

Populationurbanrural
populationcitiespopulationcommunes
Tiraspol 129,367129,3671
Camenca District 20 542 ?1 ?12
Rîbnița District 69,000 ?1 ?22
Dubăsari District 31,000 ?1 ?9
Grigoriopol District 40,000 ?12 ?114
Slobozia District 84,000 ?24 ?212
Subtotal Transnistria 383,806?10?69
Bender (w/o Proteagailovca)91,19791,1971
Proteagailovca 3,1423,1421
Gîsca 4,8414,8411
Chițcani (incl. Merenești and Zahorna)~9,000~9,0001
Cremenciug 1,0941,0941
Roghi 715715parts of 1
Subotal other localities109,98991,197118,7924
Total Tiraspol-controlled areas475,003333,00311142,00073

Note:
1 The breakaway Transnistrian authorities have counties as urban only the population of the town of Grigoriopol, while that of the town of Maiac was counted as rural.
2 The breakaway Transnistrian authorities have counties as urban only the population of the towns of Slobozia and Dnestrovsc, while those of the towns of Crasnoe and Tiraspolul Nou were counted as rural.
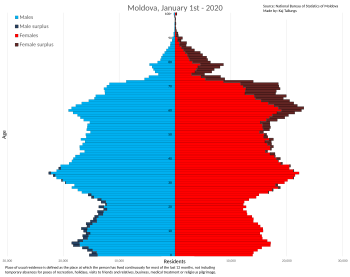
Vital statistics

Bessarabia Governorate (1900–1914)

[10]

Average populationLive birthsDeathsNatural changeCrude birth rate (per 1000)Crude death rate (per 1000)Natural change (per 1000)Crude migration rate (per 1000
19002,037,00083,30648,48034,82640.923.817.1
19012,073,00087,79746,29641,50142.322.320.0-2.3
19022,113,00096,64155,42341,21845.726.219.5-0.2
19032,154,00094,93653,23641,70044.124.719.40
19042,194,00099,26555,43643,82945.325.320.0-1.4
19052,237,00080,08562,38717,69835.827.97.911.7
19062,267,00095,09055,63839,45241.924.517.4-4.0
19072,303,000107,19559,96447,23146.526.020.5-4.6
19082,345,00096,08854,77241,31641.023.417.60.6
19092,395,000105,68162,49843,18344.126.118.03.3
19102,441,000101,54477,35624,18841.631.79.99.3
19112,488,00097,86474,09323,77139.329.89.69.7
19122,540,000102,65477,43125,22340.430.59.911.0
19132,602,000102,39777,74524,65239.429.99.514.9
19142,625,000100,87179,20221,66938.430.28.30.5

After WW II, total area

[11] [12]

Average populationLive birthsDeathsNatural changeCrude birth rate (per 1000)Crude death rate (per 1000)Natural change (per 1000)Crude migration rate (per 1000)Total fertility rateUrban FertilityRural Fertility
19452,028,000(e)42,79578,797−36,00221.138.9−17.8
19462,254,000(e)64,46264,3719128.628.50.1111.3
19472,188,000(e)57,555165,049−107,49426.375.5−49.219.9
19482,126,000(e)73,12335,84637,27734.416.917.519.9
19492,236,000(e)94,18030,40763,77342.113.628.523.2
19502,341,00091,13726,36364,77438.911.327.719.3
19512,381,00091,64525,95765,68838.510.927.6-10.5
19522,432,00080,91830,96849,95033.312.720.50.9
19532,491,00079,04123,25755,78431.79.322.41.9
19542,557,00083,60724,07759,53032.79.423.33.2
19552,627,00079,77221,86457,90830.48.322.05.4
19562,701,00081,37220,10961,26330.17.422.75.5
19572,777,00085,74321,11464,62930.97.623.34.8
19582,853,00087,50218,74168,76130.76.624.13.33.54
19592,929,00092,17621,46770,70931.57.324.12.53.64
19603,003,00087,91019,29068,62029.36.422.92.43.41
19613,073,00086,68319,59067,09328.26.421.81.53.20
19623,141,00080,49421,36559,12925.66.818.83.33.00
19633,208,00078,42220,73757,68524.46.518.03.32.89
19643,273,00073,58319,94453,63922.56.116.43.92.71
19653,335,00067,99620,57147,42520.46.214.24.72.68
19663,395,00071,40621,47449,93221.06.314.53.52.73
19673,453,00071,38023,40647,97420.76.813.73.42.69
19683,506,00069,99724,26845,72920.06.913.02.32.65
19693,549,00067,57526,24941,32619.07.411.50.82.58
19703,594,00069,77826,57743,20119.47.412.00.72.56
19713,647,00073,64327,88945,75420.27.612.52.22.63
19723,700,00076,19828,00148,19720.67.613.01.52.63
19733,748,00076,33930,75645,58320.48.212.20.82.59
19743,794,00077,47432,21645,25820.48.511.90.42.55
19753,839,00079,16935,63543,53420.69.311.30.62.52
19763,877,00079,86334,81245,05120.69.011.6-1.72.46
19773,910,00079,02237,25041,77220.29.510.7-2.22.40
19783,936,00078,99438,41040,58420.19.810.3-3.72.381.703.00
19793,967,00080,15241,72938,42320.210.59.7-1.82.391.802.90
19804,010,00079,58040,47239,10819.810.19.81.02.411.802.90
19814,054,00082,27941,47640,80320.310.210.10.92.451.803.10
19824,097,00083,25841,04642,21220.310.010.30.32.431.793.19
19834,137,00091,30444,32946,97522.110.711.4-1.62.571.873.46
19844,175,00089,63745,53744,10021.510.910.6-1.42.671.953.65
19854,214,00090,45346,07544,37821.510.910.5-1.22.702.003.70
19864,255,00094,72640,43754,28922.39.512.8-3.12.782.003.80
19874,290,00091,76240,18551,57721.49.412.0-3.82.702.103.80
19884,321,00088,56840,91247,65620.59.511.0-3.82.632.003.60
19894,349,00082,22140,11342,10818.99.29.7-3.22.462.023.00
19904,364,00077,08542,42734,65817.79.77.9-4.52.391.913.07
19914,363,00072,02045,84926,17116.510.56.0-6.22.261.792.84
19924,353,00069,65444,52225,13216.010.25.8-8.12.211.682.86
19934,350,00066,17946,63719,54215.210.74.5-5.22.101.532.77
19944,350,00062,08551,51410,57114.312.02.3-2.31.951.442.54
19954,340,00056,41152,9693,44213.012.20.8-3.11.761.312.24
19964,325,00051,86549,7482,11712.011.50.5-4.01.601.192.05
19974,311,00051,28651,13814811.911.90.0-3.21.55
19984,318,00046,70547,691−98610.811.0−0.21.81.48
19994,307,00043,51148,904−5,39310.111.4−1.3-1.21.43

(e)= estimate

Moldova under the central government control

Average populationLive birthsDeathsNatural changeCrude birth rate (per 1000)Crude death rate (per 1000)Natural change (per 1000)Crude migration rate (per 1000)Total fertility rate (TFR)Urban TFRRural TFRLife Expectancy
(total)
Life Expectancy
(male)
Life Expectancy
(female)
19973,654,00045,58342,9572,62612.511.80.71.731.362.0966.6162.8670.30
19983,652,00041,33239,9221,41011.310.90.4-0.91.671.322.0367.7764.0371.39
19993,647,00038,50141,315−2,81410.611.3−0.8-0.61.611.261.9767.4463.7471.04
20003,640,00036,93941,224−4,28510.211.3−1.2-0.71.571.231.9567.5963.8771.22
20013,631,00036,44840,075−3,62710.011.0−1.0-1.51.481.211.9268.2064.5071.75
20023,623,00035,70541,852−6,1479.911.6−1.7-0.51.411.131.8968.1364.4071.71
20033,613,00036,47143,079−6,60810.111.9−1.8-1.01.471.181.8868.1364.4771.64
20043,604,00038,27241,668−3,39610.611.6−0.9-1.61.501.191.9168.3864.5072.16
20053,595,00037,69544,689−6,99410.512.4−1.9-0.61.2190.941.30167.8563.8471.66
20063,586,00037,58743,137−5,55010.512.0−1.5-1.01.2281.0251.38768.4064.5772.23
20073,577,00037,97343,050−5,07710.612.0−1.4-1.11.2560.9731.54368.7965.0472.56
20083,570,00039,01841,948−2,93010.911.7−0.8-1.21.2771.0181.53369.3665.5573.17
20093,566,00040,80342,139−1,33611.411.8−0.4-0.71.3261.0481.58269.3165.3173.37
20103,563,00040,47443,631−3,15711.412.3−0.90.11.3091.0551.53169.1165.0073.41
20113,560,00039,18239,249−6711.011.0−0.0-0.81.2661.0091.48270.8866.8274.93
20123,560,00039,43539,560−12511.011.1−0.10.11.2791.0301.48371.1267.2474.99
20133,559,00037,87138,060−18910.610.7−0.1-0.21.2380.9751.44971.8568.0575.55
20142,857,81540,70939,5221,18714.313.80.5-197.51.821.522.0469.3365.2073.60
20152,835,97840,54739,80074714.414.10.4-8.01.871.522.1169.3765.2273.72
20162,803,18639,64038,4121,22814.313.70.5-12.11.891.562.1269.8565.6874.20
20172,755,18936,36336,779−41613.213.3−0.2-16.91.811.492.0370.7766.7174.92
20182,707,20334,53737,263−2,72612.813.8−1.0-16.41.811.482.0370.666.375.0
20192,664,22432,42336,411−3,98812.213.7−1.5-14.41.781.471.9970.966.875.2
20202,635,13030,83440,717−9,88311.715.5−3.8-7.11.761.461.9869.966.073.9
20212,595,80929,32045,464−16,14411.317.5−6.2-8.71.751.481.9469.065.172.9
20222,538,89427,01836,196–9,17810.614.2-3.6-18.31.691.461.8771.467.175.7
202324,03333,733–9,700

Current vital statistics

[16] [17]

PeriodLive birthsDeathsNatural increase
January – September 202219,59332,493-12,900
January – September 202315,68225,354-9,672
DifferenceDecrease2.svg -3,911 (-19.96%)Decrease Positive.svg -7,139 (-21.97%)Increase2.svg +3,228

Structure of the population

Population by Sex and Age Group (12.V.2014) (Excludes non-residents present in country at time of census (visitors, foreigners temporarily residing in country, etc.). Tiraspol, Bender, Slobozia, Ribnita, Camenca Yrigoricpol/Grigoriopol are districts from Transnistria where the census was not conducted.): [18]
Age GroupMaleFemaleTotal%
Total1 352 0991 452 7022 804 801100
0–488 31183 681171 9926.13
5–982 45578 229160 6845.73
10–1477 27572 752150 0275.35
15–1993 72789 965183 6926.55
20–24118 376112 777231 1538.24
25–29129 771121 694251 4658.97
30–34109 201105 669214 8707.66
35–3995 57595 220190 7956.80
40–4487 45189 455176 9066.31
45–4984 28889 276173 5646.19
50–5498 512110 162208 6747.44
55–5993 612110 213203 8257.27
60–6479 681102 009181 6906.48
65-6939 65255 75595 4073.40
70-7432 64552 62585 2703.04
75-7922 75742 33965 0962.32
80-8412 54325 43737 9801.35
85-894 80111 70116 5020.59
90-941 1483 1294 2770.15
95-991584165740.02
100+1601983580.01
Age groupMaleFemaleTotalPercent
0–14248 041234 662482 70317.21
15–64990 1941 026 4402 016 63471.90
65+113 864191 600305 46410.89
Population Estimates by Sex and Age Group (01.VII.2021) (Provisional Estimates): [18]
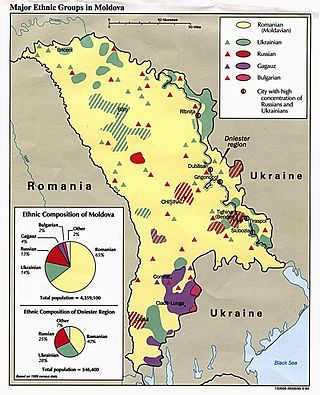
Age GroupMaleFemaleTotal%
Total1 247 3091 367 8902 615 199100
0–478 99173 900152 8915.85
5–986 33581 443167 7776.42
10–1480 29876 162156 4595.98
15–1970 36266 581136 9435.24
20–2467 96164 991132 9525.08
25–2986 31886 189172 5056.60
30–34105 175104 312209 4868.01
35–39102 957102 774205 7307.87
40–4487 69389 962177 6546.79
45–4983 77087 522171 2916.55
50–5478 83884 168163 0056.23
55–5982 82295 630178 4506.82
60–6487 913110 597198 5087.59
65-6966 17094 832161 0026.16
70-7444 97472 212117 1864.48
75-7918 04534 12752 1711.99
80-8412 32527 46639 7881.52
85+6 38015 04521 4250.82
Age groupMaleFemaleTotalPercent
0–14245 624231 505477 12918.24
15–64853 791892 7031 746 49466.78
65+147 894243 682391 57614.97

Transnistrian-controlled areas

[19]

Source: [20]

Average populationLive birthsDeathsNatural changeCrude birth rate (per 1000)Crude death rate (per 1000)Natural change (per 1000)
1997657,0005,7038,181−2,4788.712.5−3.8
1998665,7005,3737,769-2,3968.111.7-3.6
1999660,0005,0107,589-2,5797.611.5-3.9
2000651,8005,0107,770-2,7607.711.9-4.2
2001642,5004,5057,759-3,2547.012.1-5.1
2002633,6004,6308,118-3,4887.312.8-5.5
2003623,8004,4408,192-3,7527.113.1-6.0
2004554,4004,8408,031-3,1918.714.5-5.8
2005547,5004,6648,186-3,5228.515.0-7.5
2006540,6004,8688,306-3,4389.015.4-6.4
2007533,5004,8938,132-3,2399.215.2-6.1
2008527,5005,2907,967-2,67710.015.1-5.1
2009522,5005,1897,454-2,2659.914.3-4.3
2010518,0005,1897,709-2,52010.014.9-4.9
2011513,4004,9997,289-2,2909.714.2-4.5
2012509,4005,1737,280-2,10710.214.3-4.1
2013505,2004,8066,867-2,0619.513.6-4.1
2014500,7004,9947,313-2,31910.014.6-4.6
2015474,5004,9597,094-2,13510.515.0-4.5
2016470,6004,6766,758-2,0829.914.4-4.5
2017469,0004,5006,684-2,1849.614.3-4.7
2018465,1004,0866,727-2,6418.814.5-5.7
2019465,2003,6466,810-3,1647.814.6-6.8
2020465,8003,4637,258-3,7957.415.6 [21] -8.1
2021465,3003,1448,980-5,8366.819.3 [21] -12.5
2022 [21] 459,8002,8206,483-3,6636.114.1-8.0
2023 [22] 455,7002,5886,152-3,5645.713.5-7.8

Current vital statistics

[22]

PeriodLive birthsDeathsNatural increase
January – December 20222,8206,483-3,663
January – December 20232,5886,152-3,564
DifferenceDecrease2.svg -232 (-8.2%)Decrease Positive.svg -331 (-5.1%)Increase2.svg 99

Fertility Rate (The Demographic Health Survey)

[23] Fertility Rate (TFR) (Wanted Fertility Rate) and CBR (Crude Birth Rate):

YearCBR (Total)TFR (Total)CBR (Urban)TFR (Urban)CBR (Rural)TFR (Rural)
200512,01,712,51,511,71,8

Ethnic groups

Ethnic map of Moldova (2004 data) Harta etnica a Rep. Moldova - 2004.jpg
Ethnic map of Moldova (2004 data)
Ethnic map of Moldova (2014 data) Rep.Moldova - Harta Etnica (2014).png
Ethnic map of Moldova (2014 data)

Out of the 2,804,801 people covered by the 2014 Moldovan census, 2,754,719 gave an answer as to their ethnic affiliation. Among them, 2,068,068 or 73.7% declared themselves Moldovans and 192,800 or 6.9% Romanians. [24] Some organisations such as the Liberal party of Moldova have criticised the census results, claiming Romanians comprise 85% of the population and that census officials have pressured respondents to declare themselves Moldovans instead of Romanians and have purposefully failed to cover urban respondents who are more likely to declared themselves Romanians as opposed to Moldovans [25]

At the same time, 181,035 declared themselves Ukrainians, 111,726 Russians, 126,010 Gagauz and 51,867 Bulgarians. The proportion of Ukrainians and Russians in the area controlled by Chișinău has fallen from 8,4% to 6,5% and 5,9% to 4,0% respectively between 2004 and 2014. Meanwhile, the percentage of Gagauz has risen slightly from 4,4% in 2004 to 4,5% in 2014. [8]

The proportion of Ukrainians and Russians in the previous 2004 census also decreased considerably in comparison to the last Soviet census in 1989: from 13.8% to 11.2% and from 13.0% to 9.4% respectively out of the combined population including Transnistria. This is mostly due to emigration.

Ukrainians mostly live in the east (Transnistria) and the north, while Russians mostly live in urban areas: 27% of all Russians live in Chișinău, 18% live in Tiraspol, 11% in Bender and 6% in Bălți. Most of the Gagauz live in the south of Moldova in the autonomous region of Gagauzia.

Total area

Population of Moldova according to ethnic group 1959–2014
Ethnic
group
census 19591census 19702census 19793census 19894census 20045census 20145
Number %Number %Number %Number %Number %Number %
Moldovans 81,886,56665.42,303,91664.62,525,68763.92,794,74964.52,742,23169.62,068,05875.1
Romanians 1,6630.11,5810.01,6570.02,4770.173,5291.9192,8007.0
Ukrainians 420,82014.6506,56014.2560,67914.2600,36613.8442,47511.2181,0356.6
Gagauzians 95,8563.3124,9023.5138,0003.5153,5483.5151,5963.8126,0104.6
Russians 292,93010.2414,44411.6505,73012.8562,06913.0369,8969.4111,7264.1
Bulgarians 61,6522.173,7762.180,6652.088,4192.079,5202.051,8671.9
Romani 7,2650.39,2350.310,6660.311,5710.312,7780.39,3230.3
Jews 95,1043.398,0622.780,1242.065,7991.54,8670.11,6010.05
Poles 4,7830.24,8990.14,9610.14,7390.14,1740.11,4040.05
Others17,8380.631,4980.941,5871.151,6231.257,6131.510,9000.5
Total2,884,4773,568,8733,949,7564,335,3603,938,6792,998,2355
1 Source: . 2 Source: . 3 Source: . 4 Source: . 5 Source: 6 2004 combined censuses of the government-controlled area and Transnistria 6 2014 census only in government-controlled area. 8 There is an ongoing controversy, whether Romanians and Moldovans should be counted together.

Declared country of birth for the current inhabitants of the part of Moldova under the central government control, according to the 2004 census:

ethnic grouptotal populationurbanrural
total Moldova former USSR other countriesnon-declaredtotalMoldovaformer USSRother countriesnon-declaredtotalMoldovaformer USSRother countriesnon-declared
Moldovans and Romanians 2,638,125
100%
2,604,051
98.71%
30,360
1.15%
3,345
0.13%
369
0.01%
870,445
100%
848,554
%
19,501
%
2,081
%
309
%
1,767,680
100%
1,755,497
%
10,859
%
1,264
%
60
%
Ukrainians 282,406
100%
227,750
80.65%
54,036
19.13%
598
0.21%
22
0.01%
145,890
100%
103,039
%
42,318
%
514
%
19
%
136,516
100%

%
11,718
%
84
%
3
%
Russians 201,218
100%
129,664
64.44%
70,380
34.98%
1,096
0.54%
78
0.04%
166,395
100%
106,580
%
58,739
%
1,011
%
65
%
34,823
100%
23,084
%
11,641
%
85
%
13
%
Gagauzians 147,500
100%
144,268
97.81%
3,101
2.10%
120
0.08%
11
0.01%
53,613
100%
51,586
%
1,941
%
76
%
10
%
93,887
100%
92,682
%
1,160
%
44
%
1
%
Bulgarians 65,662
100%
59,489
90.60%
5,968
9.09%
199
0.30%
6
0.01%
29,447
100%
25,215
%
4,071
%
156
%
5
%
36,215
100%
34,274
%
1,897
%
43
%
1
%
others 34,401
100%
22,702
65.99%
10,797
31.39%
894
2.60%
8
0.02%
26,058
100%
16,973
%
8,358
%
722
%
5
%
8,343
100%
5,729
%
2,439
%
172
%
3
%
non-declared 14,020
100%
13,894
99.10%
12
0.09%
28
0.20%
86
0.61%
13,807
100%
13,668
%
9
%
27
%
83
%
213
100%
206
%
3
%
1
%
3
%
Total3,383,332
100%
3,201,818
94.64%
174,654
5.16%
6,280
0.19%
580
0.02%
1,305,655
100%
1,165,635
89.28%
134,937
10.33%
4,587
0.35%
496
0.04%
2,077,677
100%
2,036,183
98.00%
39,717
1.91%
1,693
0.08%
84
0.004%

Population by district, according to the 2004 census:

Population Moldovans 1 Ukrainians Russians Gagauzians Bulgarians Romanians 1Jews Poles Gypsies others
Chișinău 712,218481,626
67.62%
58,945
8.28%
99,149
13.92%
6,446
0.91%
8,868
1.25%
31,984
4.49%
2,649
0.37%
834
0.12%
507
0.07%
21,210
2.98%
Bălți 127,56166,877
52.43%
30,288
23.74%
24,526
19.23%
243
0.19%
297
0.23%
2,258
1.77%
411
0.32%
862
0.68%
272
0.21%
1,527
1.20%
Gagauzia 155,6467,481
4.81%
4,919
3.16%
5,941
3.82%
127,835
82.13%
8,013
5.15%
38
0.02%
17
0.01%
28
0.02%
486
0.31%
888
0.57%
Anenii Noi 81,71068,761
84.15%
6,526
7.99%
4,135
5.06%
235
0.29%
481
0.59%
857
1.05%
17
0.02%
28
0.03%
228
0.28%
442
0.54%
Basarabeasca 28,97820,218
69.77%
1,948
6.72%
2,568
8.86%
2,220
7.66%
1,544
5.33%
70
0.24%
13
0.04%
5
0.02%
216
0.75%
176
0.61%
Briceni 78,02755,123
70.65%
19,939
25.55%
2,061
2.64%
59
0.08%
45
0.06%
314
0.40%
84
0.11%
10
0.01%
187
0.24%
205
0.26%
Cahul 119,23191,001
76.32%
7,842
6.58%
7,702
6.46%
3,665
3.07%
5,816
4.88%
2,095
1.76%
40
0.03%
29
0.02%
238
0.20%
803
0.67%
Cantemir 60,00152,986
88.31%
969
1.61%
710
1.18%
519
0.86%
3,736
6.23%
910
1.52%
0%
11
0.02%
43
0.07%
117
0.19%
Călărași 75,07569,190
92.16%
2,799
3.73%
947
1.26%
54
0.07%
47
0.06%
1,490
1.98%
21
0.03%
11
0.01%
378
0.50%
138
0.18%
Căușeni 90,61279,432
87.66%
2,469
2.72%
3,839
4.24%
653
0.72%
1,108
1.22%
2,844
3.14%
8
0.01%
9
0.01%
30
0.03%
220
0.24%
Cimișlia 60,92552,972
86.95%
3,376
5.54%
2,371
3.89%
278
0.46%
1,341
2.20%
331
0.54%
7
0.01%
10
0.02%
95
0.16%
144
0.24%
Criuleni 72,25467,046
92.79%
2,692
3.73%
1,008
1.40%
49
0.07%
72
0.10%
1,170
1.62%
6
0.01%
6
0.01%
36
0.05%
169
0.23%
Dondușeni 46,44237,302
80.32%
5,893
12.69%
2,714
5.84%
31
0.07%
36
0.08%
247
0.53%
12
0.03%
15
0.03%
68
0.15%
124
0.27%
Drochia 87,09274,369
85.39%
9,849
11.31%
1,641
1.88%
44
0.05%
33
0.04%
675
0.78%
14
0.02%
10
0.01%
272
0.31%
185
0.21%
Dubăsari 34,01532,652
95.99%
521
1.53%
611
1.80%
45
0.13%
16
0.05%
102
0.30%
9
0.03%
2
0.01%
0%
57
0.17%
Edineț 81,39058,749
72.18%
16,084
19.76%
5,084
6.25%
143
0.18%
91
0.11%
446
0.55%
23
0.03%
26
0.03%
499
0.61%
245
0.30%
Fălești 90,32075,863
83.99%
10,711
11.86%
3,064
3.39%
39
0.04%
32
0.04%
306
0.34%
6
0.01%
20
0.02%
57
0.06%
222
0.25%
Florești 89,38975,797
84.79%
8,023
8.98%
4,633
5.18%
45
0.05%
51
0.06%
433
0.48%
19
0.02%
29
0.03%
120
0.13%
239
0.27%
Glodeni 60,97546,317
75.96%
11,918
19.55%
1,693
2.78%
32
0.05%
44
0.07%
329
0.54%
8
0.01%
174
0.29%
303
0.50%
157
0.26%
Hîncești 119,762108,189
90.34%
6,218
5.19%
1,463
1.22%
99
0.08%
212
0.18%
3,046
2.54%
19
0.02%
16
0.01%
305
0.25%
195
0.16%
Ialoveni 97,70491,379
93.53%
1,117
1.14%
1,112
1.14%
95
0.10%
935
0.96%
2,608
2.67%
5
0.01%
12
0.01%
197
0.20%
244
0.25%
Leova 51,05643,673
85.54%
1,245
2.44%
1,167
2.29%
432
0.85%
3,804
7.45%
471
0.92%
8
0.02%
9
0.02%
105
0.21%
142
0.28%
Nisporeni 64,92460,774
93.61%
223
0.34%
339
0.52%
17
0.03%
28
0.04%
2,329
3.59%
1
<0.01%
4
0.01%
1,147
1.77%
62
0.10%
Ocnița 56,51032,491
57.50%
17,351
30.70%
2,764
4.89%
79
0.14%
60
0.11%
104
0.18%
14
0.02%
43
0.08%
3,417
6.05%
187
0.33%
Orhei 116,271100,469
86.41%
4,520
3.89%
2,216
1.91%
113
0.10%
90
0.08%
8,253
7.10%
46
0.04%
23
0.02%
221
0.19%
320
0.28%
Rezina 48,10544,721
92.97%
1,691
3.52%
1,093
2.27%
34
0.07%
40
0.08%
375
0.78%
30
0.06%
5
0.01%
13
0.03%
103
0.21%
Rîșcani 69,45450,391
72.55%
15,632
22.51%
1,726
2.49%
60
0.09%
61
0.09%
777
1.12%
8
0.01%
42
0.06%
602
0.87%
155
0.22%
Sîngerei 87,15374,139
85.07%
8,456
9.70%
3,029
3.48%
47
0.05%
43
0.05%
1,162
1.33%
10
0.01%
48
0.06%
56
0.06%
163
0.19%
Soroca 94,98684,728
89.20%
4,752
5%
2,601
2.74%
53
0.06%
48
0.05%
931
0.98%
65
0.07%
17
0.02%
1,564
1.65%
227
0.24%
Strășeni 88,90083,368
93.78%
985
1.11%
1,576
1.77%
70
0.08%
109
0.12%
2,542
2.86%
13
0.01%
14
0.02%
24
0.03%
199
0.22%
Șoldănești 42,22740,354
95.56%
1,055
2.50%
376
0.89%
9
0.02%
14
0.03%
299
0.71%
2
<0.01%
-
0%
74
0.18%
44
0.10%
Ștefan Vodă 70,59465,318
92.53%
2,182
3.09%
1,918
2.72%
64
0.09%
145
0.21%
562
0.80%
1
<0.01%
4
0.01%
219
0.31%
181
0.26%
Taraclia 43,1545,980
13.86%
2,646
6.13%
2,139
4.96%
3,587
8.31%
28,293
65.56%
29
0.07%
2
<0.01%
9
0.02%
218
0.51%
251
0.58%
Telenești 70,12667,309
95.98%
879
1.25%
537
0.77%
16
0.02%
16
0.02%
1,262
1.80%
4
0.01%
1
<0.01%
6
0.01%
96
0.14%
Ungheni 110,54597,805
88.48%
7,743
7%
2,766
2.50%
90
0.08%
93
0.08%
1,627
1.47%
16
0.01%
17
0.02%
68
0.06%
320
0.29%
Subtotal controlled by central government3,383,3322,564,850
75.80%
282,406
8.35%
201,218
5.95%
147,500
4.36%
65,662
1.94%
73,276
2.16%
3,608
0.11%
2,383
0.07%
12,271
0.36%
30,157
0.89%

1There is an ongoing controversy over whether Moldovans are a subset of Romanians, or a distinct ethnic group. At the 2004 Moldovan Census, citizens could declare only one nationality. Consequently, one could not declare oneself both Moldovan and Romanian.

Transnistrian-controlled areas

2015 census

According to the last census in Transnistria (October 2015), the population of the region was 475,373, a 14.47% decrease from the figure recorded at the 2004 census. [26] By ethnic composition, the population of Transnistria was distributed as follows:

Around 14% did not declare any ethnicity. For the first time, the population had the option to identify as "Transnistrian". [26]

2004 census

Population Mold. Russians Ukrainians Gagauzes Bulg. Gyps. Jews Poles Belor. Germ. Armen. others,
non-decl.
Tiraspol 158,069 23,790

15.05%

 65,928

41.71%

 52,278

33.07%

 1,988

1.26%

 2,450

1.55%

 116

0.07%

 573

0.36%

 324

0.20%

 1,712

1.08%

 701

0.44%

 360

0.23%

 7,849
4.97%
Camenca District 27,28413,048

47.82%

1,880

6.89%

11,610

42.55%

43

0.16%

59

0.22%

9

0.03%

10

0.04%

447

1.64%

85

0.31%

26

0.10%

16

0.06%

51

0.19%

Rîbnița District 82,69924,729

29.90%

14,237

17.22%

37,554

45.41%

149

0.18%

309

0.37%

51

0.06%

177

0.21%

528

0.64%

412

0.50%

150

0.18%

81

0.10%

4,322

5.23%

Dubăsari District 36,73418,080

49.22%

7,125

19.40%

10,594

28.84%

92

0.25%

134

0.36%

46

0.13%

46

0.13%

53

0.14%

185

0.50%

63

0.17%

126

0.34%

190

0.52%

Grigoriopol District 48,00031,118

64.83%

7,332

15.28%

8,333

17.36%

123

0.26%

240

0.50%

13

0.03%

26

0.05%

100

0.21%

187

0.39%

327

0.68%

62

0.13%

139

0.29%

Slobozia District 86,74236,651

42.25%

20,636

23.79%

19,872

22.91%

512

0.59%

7,323

8.44%

133

0.15%

35

0.04%

137

0.16%

475

0.55%

496

0.57%

140

0.16

332

0.38%

Subtotal Transnistria 439,528147,416

33.54%

117,138

26.65%

140,241

31.91%

2,907

0.66%

10,515

2.39%

368

 0.08%

867

 0.20%

1,589

 0.36%

3,056

0.70%

1,763

 0.40%

785

 0.18%

12,883

2.93%

Bender (w/o Protegailovca)97,02724,374

25.12%

41,949

43.23%

17,348

17.88%

1,066

1.10%

3,001

3.09%

132

0.14%

383

0.39%

190

0.21%

713

0.73%

258

0.27%

173

0.18%

7,440

7.67%

Proteagailovca 3,142756–761

24.12%

1,482

47.17%

658

20.94%

25

0.80%

163

5.19%

0–5

0.06%

2

0.06%

0–12

0.19%

19

0.60%

6

0.19%

0–16

0.25%

0–31

0.48%

Gîsca 4,841819–824

16.98%

2,956

61.06%

719

14.85%

91

1.88%

168

3.47%

0–5

0.04%

7

0.14%

0–12

0.12%

8

0.17%

22

0.45%

0–16

0.17%

13–44

0.60%

Chițcani (incl. Merenești and Zahorna)~9,000~3,100

~35%

~4,800

~53%

~900

~10%

N/A

N/A

N/A

N/A

N/A

N/A

N/A

N/A

~200

~2%

Cremenciug 1,094465

42.50%

353

32.27%

203

18.56%

7

0.64%

11

1.01%

2

0.18%

-

-

-

-

15

1.37%

22

2.01%

6

0.55%

10

0.91%

Roghi 715 [27] ~700

~95%

N/A

N/A

N/A

N/A

N/A

N/A

N/A

N/A

N/A

N/A

~15

~5%

Subotal other localities115,81930,219

26.09%

51,540

44.50%

19,828

17.12%

1,189

1.03%

3,343

2.89%

139

0.12%

392

0.34%

202

0.17%

755

0.65%

308

0.27%

195

0.17%

7,709

6.66%

Total Tiraspol-controlled areas555,347177,635

31.99%

168,678

30.37%

160,069

28.82%

4,096

0.74%

13,858

2.50%

507

0.09%

1,259

0.23%

1,791

0.32%

3,811

0.69%

2,071

0.37%

980

0.18%

20,592

3.71%

Notes:
  • The exact numbers in the above table are taken from the data published by the Transnistrian breakaway authorities after the 2004 Census in Transnistria, except the population of Roghi, which was taken from website of the Dubăsari District of Transnistria.
  • The number of inhabitants of Slobozia District + that of the commune Chițcani was given by Transnistrian authorities as 95,742. Other sources indicate ~9,000 for Chițcani. In this table it is assumed there are 9,000 inhabitants in Chițcani, and 86,742 in Slobozia District. Should the exact data of the census for Chițcani be available, the entries in the lines of Slobozia District and of Chițcani should be corrected accordingly.
  • Transnistrian authorities have published the ethnic composition for the combined population of the Dubăsari District and the village of Roghi in Molovata Nouă commune. Other sources indicate that the latter is almost entirely Moldovan. In this table it is assumed that of the 715 inhabitants of this village, 700 are Moldovan and 15 are others. Should the exact ethnicity data of the census for Roghi be available, the entries for ethnicities in the lines of Dubăsari District and of Roghi should be corrected accordingly.
  • Percentages are calculated from the absolute numbers

Languages

Romanian is the official language of Moldova. However, many speakers use the term Moldovan to describe the language they speak, even though its literary standard is virtually identical to Romanian. Officially since 1990, it is written in the Latin alphabet.

Native language

Currently, 2,184,065 people or 80.2% of those covered by the 2014 census on the right bank of the Dniester or Moldova (proper) identified Moldovan or Romanian as their native language, of which 1,544,726 (55.1%) declared Moldovan and 639.339 (22.8%) declared it Romanian. 263,523 people or 9.4% have Russian as native language, 107,252 or 3.8% – Ukrainian, 114,532 or 4.1% – Gagauz, 41,756 or 1.5% – Bulgarian, 12,187 or 0.5% – another language. Only 2,723,315 declared their native language out of the 2,804,801 covered by the 2014 census. [8]

First language in daily use (2014 census)

According to the 2014 census, 2,720,377 answered to the question on "language usually used for communication". 2,138,964 people or 78.63% of the inhabitants of Moldova (proper) have Moldovan/Romanian as first language, of which 1,486,570 (53%) declared it Moldovan and 652,394 (23.3%) declared it Romanian. 394,133 people or 14.1% have Russian as language of daily use, 73.802 or 2.6% – Ukrainian, 74.167 or 2.6% – Gagauz, 26,577 or 0.9% – Bulgarian, and 12,734 or 0.5% – another language. [8]

First language in daily use (2004 census)

Ethnic group \ First languageMoldovan *RomanianRussian Ukrainian Gagauzian Bulgarian other languagedid non declareTotal
Moldovans 1,949,318475,126128,3729,1707991,1139512,564,849
Romanians 1,59769,9361,537815411673,276
Russians 8,8522,805187,5261,224329344138201,218
Ukrainians 17,4914,158141,206118,699427294131282,406
Gagauzians 2,75660940,445413102,39582161147,500
Bulgarians 4,6521,04623,25918867335,8083665,662
other ethnic groups3,8281,13318,6103392621819,85619234,401
did non declare461352913,90914,020
Total by language of first use1,988,540
58.77% 
554,814
16.4% 
540,990
15.99% 
130,114
3.85% 
104,890
3.10% 
38,565
1.14% 
11,318
0.34% 
14,101
0.41% 
3,383,332
100% 
* Moldovan language is one of the names used in the Republic of Moldova for the Romanian language.

Usage of own language by the ethnic groups of Moldova (2004 census)

ethnic groupown language Moldovan and Romanian Russian
Moldovans 94.52%5%
Romanians 97.62%2.1%
Russians 93.20%5.79%
Ukrainians 42.03%7.66%50.00%
Gagauzians 69.42%2.28%27.42%
Bulgarians 54.53%8.68%35.42%
othersup to 28.65%14.42%54.10%

Urban areas

ethnic groupown language Moldovan and Romanian Russian
Moldovans 86.71%13.07%
Romanians 96.88%2.85%
Russians 95.85%3.82%
Ukrainians 13.06%6.56%80.19%
Gagauzians 40.10%2.19%57.23%
Bulgarians 36.81%7.93%54.45%
othersup to 28.11%8.35%62.05%

Rural areas

ethnic groupown language Moldovan and Romanian Russian
Moldovans 98.24%1.17%
Romanians 98.76%0.94%
Russians 80.52%15.25%
Ukrainians 72.99%8.85%17.74%
Gagauzians 86.16%2.33%10.40%
Bulgarians 68.95%9.29%19.95%
othersup to 30.34%33.39%29.25%

Soviet era data

Ethnic map of Moldova (1989 data) Major ethnics groups in Moldova 1989.jpg
Ethnic map of Moldova (1989 data)

In the Soviet census of 1989 members of most of the ethnic groups in Moldavian SSR claimed the language of their ethnicity as their mother tongue: Moldovans (95%), Ukrainians (62%), Russians (99%), Gagauz (91%), Bulgarians (79%), and Gipsies (82%). The exceptions were Jews (26% citing Yiddish), Belarusians (43%), Germans (31%), and Poles (10%).

In the Soviet census of 1989, 62% of the total population claimed Moldovan as their native language. Only 4% of the entire population claimed Moldovan as a second language.

In 1979, Russian was claimed as a native language by a large proportion of Jews (66%) and Belarusians (62%), and by a significant proportion of Ukrainians (30%). Proportions of other ethnicities naming Russian as a native language ranged from 17% of Bulgarians to 3% of Moldovans (Russian was more spoken by urban Moldovans than by rural Moldovans). Russian was claimed as a second language by a sizeable proportion of all ethnicities: Moldovans (46%), Ukrainians (43%), Gagauz (68%), Jews (30%), Bulgarians (67%), Belarusians (34%), Germans (53%), Roma (36%), and Poles (24%).

Religion (2004 census)

According to the 2004 census, the population of Moldova has the following religious composition:

ReligionAdherents % of total
Eastern Orthodox Christians 3,158,01593.3%

Newer Protestant faiths

Baptists
Seventh-day Adventists
Pentecostal
Christians of Evangelical Faith a


32,754    
13,503    
9,179    
5,075    

1.79%
0.97%    
0.40%    
0.27%    
0.15%    

Traditional Protestant

Confessional Evangelicals
Reformed
Evangelical Synod-Presbyterians


1,429    
1,190    
3,596    

0.19%
0.04%    
0.04%    
0.11%    

Old-Rite Christians  b5,0940.15%
Roman Catholics4,6450.14%
Other religions29,8130.88%
Non-religious 33,2070.98%
Atheists 12,7240.38%

Notes: 75,727 (2.24% of population) did not answer that question.
a Known as Creștini după Evanghelie, Pentecostal group.
b Traditionally Orthodox Lipovans.

History

In 1940–1941, and 1944–1991, the Soviet government strictly limited the activities of the Orthodox Church (and all religions) and at times sought to exploit it, with the ultimate goal of abolishing it and all religious activity altogether. Most Orthodox churches and monasteries in Moldova were demolished or converted to other uses, such as administrative buildings or warehouses, and clergy were sometimes punished for leading services. Still, many believers continued to practice their faith.

People in the independent Moldova have much greater religious freedom than they did in Soviet times. Legislation passed in 1992 guarantees religious freedom, but requires all religious groups to be officially recognized by the government.

Orthodox Christians

In 1991, Moldova had 853 Orthodox churches and eleven Orthodox monasteries (four for monks and seven for nuns). In 1992 construction or restoration of 221 churches was underway, but clergy remained in short supply.[ citation needed ] As of 2004, Christian Orthodox constitute the vast majority of the population in all districts of Moldova.

In the interwar period, the vast majority of ethnic Moldovans belonged to the Romanian Orthodox Church (Bucharest Patriarchate), but today both Romanian and Russian Orthodox Church (Moscow Patriarchate) have jurisdiction in Moldova, with the latter having more parishes. According to the local needs, liturgy is performed in Romanian, Russian, and Turkic (Gagauz). After the revival of religious activity in the last 20 years, a minority of the clergy and the faithful wanted to return to the Bucharest Patriarchate (Metropolis of Bessarabia). Because higher-level church authorities were unable to resolve the matter, Moldova now has two episcopates, one for each patriarchate. After the Soviet occupation in 1940, the Metropolis was downgraded to a Bishopric. In late 1992, the Patriarch of Moscow and All Russia issued a decree upgrading its eparchy of Chișinău and Moldova to a Metropolis.

Greek Catholics

Moldova also has a Greek Catholic minority, mainly among ethnic Ukrainians, although the Soviet government declared the Greek Catholic Churches illegal in 1946 and forcibly united them with the Russian Orthodox Church. However, the Greek Catholic Churches had survived underground until the dissolution of the Soviet Union.

Roman Catholics

Half of Moldova's Roman Catholics are in Chișinău, and 1/5 in Bălți.

Old Believers

In addition, the Old Russian Orthodox Church (Old Believers) had fourteen churches and one monastery in Moldova in 1991.

Half of Moldova's Old Believers are in Florești district, and 1/5 in Sîngerei district.

Judaism

Despite the Soviet government's suppression and harassment, Moldova's practicing Jews managed to retain their religious identity. About a dozen Jewish newspapers were started in the early 1990s, and religious leaders opened a synagogue in Chișinău; there were six Jewish communities of worship throughout the country. In addition, Moldova's government created the Department of Jewish Studies at Chișinău State University, mandated the opening of a Jewish high school in Chișinău, and introduced classes in Judaism in high schools in several cities. The government also provides financial support to the Society for Jewish Culture.

Protestants

There are around 65,000 Protestants of all sects in Moldova today. There are more than 1,000 Baptists in the cities of Chișinău and Bălți, in Cahul, Fălești, Hîncești, Sîngerei, Ștefan Vodă, and Ungheni districts, and in Găgăuzia. There are more than 1,000 Seventh-day Adventists in Cahul, Hîncești and Sîngerei districts, and in Găgăuzia, there are more than 1,000 Pentecostals in Chișinău and in Briceni district. There are more than 1,000 members of Brethren assemblies only in Chișinău. There are more than 1,000 Evangelical Synod-Presbyterians only in Chișinău.

Others

Other religious denominations in Moldova include:

Immigration

Foreign citizens (according to the Office of Migration and Asylum): [28] [29] [30] [31] [32]

Country201820192020202120222023
Flag of Ukraine.svg  Ukraine 6,7866,8345,3185,404
Flag of Russia.svg  Russia 5,7425,9534,0683,905
Flag of Turkey.svg  Turkey 9431,2929421,248
Flag of Europe.svg Flag of Romania.svg  Romania 9881,0371,0121,172
Flag of Israel.svg  Israel 2,2001,9291,4121,107
Flag of India.svg  India 256520634773
Flag of Europe.svg Flag of Italy.svg  Italy 501535449474
Flag of Azerbaijan.svg  Azerbaijan 371458433404
Flag of the United States.svg  United States 433507364282
Flag of Belarus.svg  Belarus 327309240255
Flag of Uzbekistan.svg  Uzbekistan 164327172227
Flag of Armenia.svg  Armenia 211229209218
Flag of Kazakhstan.svg  Kazakhstan 202220179181
Flag of Tajikistan.svg  Tajikistan 106133
Flag of Europe.svg Flag of Germany.svg  Germany 131123101121
Flag of Syria.svg  Syria 140134112110
Flag of Georgia.svg  Georgia 98110101105
Others3,2713,3131,3101,551
Total22,76423,83017,162~18,60018,76120,763

Secondary demographic indices

Average age

Average age of the population (years) on the fifth [33]
The year19921995growth2000growth2005growth2010growth2015growth
Years
32,032,4
+0.4
33,4
+1.0
34,9
+1.5
36,2
+1.3
37,5
+1.3

Life expectancy at birth

Life expectancy in Moldova since 1950 Life expectancy of Moldova.svg
Life expectancy in Moldova since 1950
Life expectancy in Moldova since 1960 by gender Life expectancy by WBG -Moldova -diff.png
Life expectancy in Moldova since 1960 by gender

Since 2000, there has been a continuous increase in life expectancy, except for 2005, a year in which there was a high level of general and infant mortality. In 2013, this indicator recorded the maximum value of the given period – 71.85 years, including men – 68.1 and women – 75.5 years. [34] The significant increase in life expectancy was influenced by the decrease in the overall mortality rate to 10.7 deaths per 1000 inhabitants, and the infant death rate, which constituted 9.4 deaths under one year per 1,000 live births.

Average life expectancy (years) based on sex after decades, five and a half years [35]
The year1960197019801990199520002005201020152016
Women:Increase2.svg69,8Increase2.svg72,1Decrease2.svg68,8Increase2.svg71,9Decrease2.svg69,7Increase2.svg71,2Increase2.svg71,7Increase2.svg73,4Increase2.svg75,5Increase2.svg76,1
Average time:Increase2.svg68,1Increase2.svg69,4Decrease2.svg65,6Increase2.svg68,0Decrease2.svg65,8Increase2.svg67,6Increase2.svg67,9Increase2.svg69,1Increase2.svg71,5Increase2.svg72,2
Men:Increase2.svg65,6Increase2.svg66,3Decrease2.svg62,4Increase2.svg63,9Decrease2.svg61,8Increase2.svg63,9Decrease2.svg63,8Increase2.svg65,0Increase2.svg67,5Increase2.svg68,1

Population by sex

Gender composition of the population, after decades [36]
Year197019801990200020102015
Men46,76%47,25%47,64%47,87%48,08%48,10%
Women53,24%52,75%52,36%52,13%51,92%51,90%
Men per 1.000 women878896910918926927

Infant mortality

Children under 1 year old in 1,000 newborns: [37]

The Year198019851990199520002005201020152017
ChildrenDecrease Positive.svg35,0Decrease Positive.svg30,9Decrease Positive.svg19,0Increase Negative.svg21,2Decrease Positive.svg18,3Decrease Positive.svg12,4Decrease Positive.svg11,7Decrease Positive.svg9,7Decrease Positive.svg9,4

Marriage

YearNumber
marriages
per 1000 inhabitantsNumber
divorce
per 1000 inhabitants
198046.08311,511.2732,8
198540.901Decrease2.svg9,711.176Decrease Positive.svg2,7
199040.809Decrease2.svg9,413.135Increase Negative.svg3,0
199532.775Decrease2.svg7,514.617Increase Negative.svg3,4
200021.684Decrease2.svg6,09.707Decrease Positive.svg2,7
200527.187Increase2.svg7,614.521Increase Negative.svg4,0
201026.483Decrease2.svg7,411.504Decrease Positive.svg3,2
201125.900Decrease2.svg7,311.120Decrease Positive.svg3,1
201224.262Decrease2.svg6,810.637Decrease Positive.svg3,0
201324.449Increase2.svg6,910.775Steady2.svg3,0
201425.624Increase2.svg7,211.130Increase Negative.svg3,1
201524.709Decrease2.svg6,911.199Steady2.svg3,1
201621.992Decrease2.svg6,210.605Decrease Positive.svg3,0

Urban and rural population

Density of population per km , depending on administrative unit Plotnost' naseleniia Moldavii na 2014 g.png
Density of population per km , depending on administrative unit
YearUrban population %Rural population %
20001.486.41040,892.148.70259,11
2001Decrease2.svg1.485.21040,94Decrease2.svg2.142.60259,06
2002Decrease2.svg1.484.14241,02Decrease2.svg2.134.17058,98
2003Decrease2.svg1.477.92740,97Decrease2.svg2.129.50859,03
2004Decrease2.svg1.476.02841,00Decrease2.svg2.124.40859,00
2005Decrease2.svg1.469.82840,94Decrease2.svg2.120.10859,06
2006Increase2.svg1.478.01141,27Decrease2.svg2.103.09958,73
2007Decrease2.svg1.476.11041,32Decrease2.svg2.096.59358,68
2008Decrease2.svg1.476.09941,37Decrease2.svg2.091.41358,63
2009Increase2.svg1.476,68141,44Decrease2.svg2.087.01458,56
2010Increase2.svg1.481.69641,62Decrease2.svg2.078.73458,38
2011Increase2.svg1.485.76641,74Decrease2.svg2.073.77558,26
2012Increase2.svg1.492.16541,92Decrease2.svg2.067.33258,08
2013Increase2.svg1.502.99642,25Decrease2.svg2.054.63857,75
2014Increase2.svg1.507.26542,40Decrease2.svg2.047.89457,60
2015Increase2.svg1.511.05142,53Decrease2.svg2.042.00557,47
2016Increase2.svg1.516.80042,71Decrease2.svg2.034.10057,47

See also

Related Research Articles

<span class="mw-page-title-main">Transnistria</span> Unrecognised state in Eastern Europe

Transnistria, officially known as the Pridnestrovian Moldavian Republic (PMR), is a breakaway state internationally recognized as part of Moldova. Transnistria controls most of the narrow strip of land between the Dniester river and the Moldova–Ukraine border, as well as some land on the other side of the river's bank. Its capital and largest city is Tiraspol. Transnistria is officially designated by the Republic of Moldova as the Administrative-Territorial Units of the Left Bank of the Dniester or as Stînga Nistrului.

<span class="mw-page-title-main">Gagauzia</span> Autonomous Turkic region of southern Moldova

Gagauzia or Gagauz-Yeri, officially the Autonomous Territorial Unit of Gagauzia (ATUG), is an autonomous territorial unit of Moldova. Its autonomy is intended for the local Gagauz people, a Turkic-speaking, primarily Orthodox ethnic group.

<span class="mw-page-title-main">Administrative divisions of Moldova</span>

Moldova is divided administratively into two levels:

<span class="mw-page-title-main">Moldovans</span> Ethnic group native to Eastern Europe

Moldovans, sometimes referred to as Moldavians, are a Romanian-speaking ethnic group and the largest ethnic group of the Republic of Moldova and a significant minority in Romania, Italy, Ukraine and Russia. There is an ongoing controversy, in part involving the linguistic definition of ethnicity, over whether Moldovans' self-identification constitutes an ethnic group distinct and separate from Romanians, or a subset. The extent of self-identification as Romanians in the Republic of Moldova varies.

<span class="mw-page-title-main">Slobozia District</span> District in Transnistria, Moldova

Slobozia District is a district of Transnistria. It is the southernmost district of Transnistria, located mostly south of Tiraspol. Its seat is the city of Slobozia, located at 46°44′N29°42′E, on the river Dniester. The district contains 4 cities/towns and 12 communes :

<span class="mw-page-title-main">Unification of Moldova and Romania</span> Movement for uniting Moldova and Romania

The unification of Moldova and Romania is a popular concept in the two countries that began during the Revolutions of 1989. The Romanian Revolution in 1989 and the independence of Moldova in 1991 further contributed to the development of a movement for the unification of the two Romanian-speaking countries. The question of reunification is recurrent in the public sphere of the two countries, often as a speculation, both as a goal and a danger. Though historically Romanian support for unification was high, a March 2022 survey following the Russian invasion of Ukraine indicated that only 11% of Romania's population supports an immediate union, while over 42% think it is not the right moment.

<span class="mw-page-title-main">History of Transnistria</span>

This is the history of Transnistria, officially the Pridnestrovian Moldavian Republic (PMR), an unrecognised breakaway state that is internationally recognised as part of Moldova. Transnistria controls most of the narrow strip of land between the Dniester river and the Moldovan–Ukrainian border, as well as some land on the other side of the river's bank.

<span class="mw-page-title-main">Chițcani</span> Commune in Căușeni, Moldova

Chițcani is a commune in Căușeni District, Moldova. It consists of the village Chițcani and two small villages (hamlets), Merenești and Zahorna. Chițcani is situated to the south-east of the city of Tighina (Bender). The locality, although situated on the right (western) bank of the river Dniester, is under the control of the breakaway Transnistrian authorities. On the opposite side of the river lies the city of Tiraspol.

<span class="mw-page-title-main">Romanian-language schools in Transnistria</span> Schools teaching in the Romanian language in Transnistria

The Romanian-language schools in Transnistria are subject to limitations by the government of Transnistria, an unrecognized breakaway region of Moldova since 1992.

Cocieri is a commune in the Republic of Moldova, and the administrative center of Dubăsari District. It is located on the eastern bank of the Dniester River, consisting of two villages, Cocieri and Vasilievca.

Doroțcaia is a village in the Dubăsari District, Republic of Moldova, situated on the eastern bank of the River Dniester.

<span class="mw-page-title-main">Religion in Transnistria</span> Overview of religion in Transnistria

Official statistics of the Pridnestrovian Moldavian Republic show that 91 percent of the Transnistrian population adhere to Eastern Orthodox Christianity, with 4 percent adhering to the Catholic Church. Roman Catholics are mainly located in Northern Transnistria, a region with a notable Polish minority.

<span class="mw-page-title-main">Law enforcement in Transnistria</span> Law enforcement in the unrecognized state of Transnistria

Law enforcement in Transnistria is administered by the region's own police force. Transnistria functions as a presidential republic, with its own government, parliament, military, paramilitary and police (militsiya) force, constitution, currency, postal system and stamps, flag, national anthem, and coat of arms.

<span class="mw-page-title-main">Languages of Moldova</span>

The official state language of Moldova is Romanian, which is the native language of 78.6% of the population ; it is also spoken as a primary language by other ethnic minorities. Gagauz, Russian, and Ukrainian languages are granted official regional status in Gagauzia and/or Transnistria.

<span class="mw-page-title-main">Moldova–Russia relations</span> Bilateral relations

Moldova–Russia relations are the bilateral relations between the Republic of Moldova and the Russian Federation, two Eastern European, post-Soviet, ex-communist countries. Russian support for the self-proclaimed Pridnestrovian Moldavian Republic (Transnistria) and a substantial Russian military presence therein strained Moldovan relations with Russia.

Etulia is a commune in the Gagauz Autonomous Territorial Unit of the Republic of Moldova. It is composed of three villages: Etulia, Etulia Nouă and Etulia station. The 2004 census listed the commune as having a population of 3,649 people. 3,382 inhabitants are Gagauz. Minorities included 31 Russians, 43 Ukrainians, 24 Bulgarians, 164 Moldovans and 1 Greek.

Russians in Moldova form the second largest ethnic minority in the country. According to the Moldovan Census (2004) and a separate 2004 Census in Transnistria, about 370,000 persons identified themselves as ethnic Russians in Moldova.

Huluboaia is a village in Cahul District, Moldova, By the 2014 census the village has a population of 794 people.

Larga Nouă is a commune in Cahul District, Moldova. It is composed of two villages, Larga Nouă and Larga Veche.

The 2014 Moldovan census was held between 12 and 25 May 2014. It was organized by National Bureau of Statistics of the Republic of Moldova.

References

Inline:

  1. "Population with usually resident population by sex and age group in territorial profile on 1 January 2023". 8 June 2023.
  2. 2014 Moldovan census
  3. "Key results of the 2014 Population and Housing Census". 31 March 2017.
  4. "В Приднестровье проживают 475 007 человек". Archived from the original on 7 November 2017. Retrieved 4 November 2017.
  5. "Moldova". Central Intelligence Agency. 2 May 2023 via CIA.gov.
  6. (in English) UN (2001/2002)
  7. (in English) UN (2000)
  8. 1 2 3 4 "Rezultatele Recensămîntului Populației și al Locuințelor 2014". 2 August 2013.
  9. "В ПРИДНЕСТРОВЬЕ ПРОЖИВАЕТ БОЛЕЕ 475 ТЫС. ЧЕЛОВЕК".
  10. "Statistical Yearbooks of the Russian Empire". Archived from the original on 16 December 2014. Retrieved 24 December 2014.
  11. "Demographic Yearbook". United Nations Statistics Division .[ not specific enough to verify ]
  12. "Statistica Moldovei". Archived from the original on 3 October 2015. Retrieved 19 February 2011.
  13. "Biroul Național de Statistică al Republicii Moldova". Biroul Național de Statistică al Republicii Moldova.
  14. (in Romanian) Biroul Național de Statistică prezintă numărul revizuit al populației Republicii Moldova și datele despre migrația internațională | Infografice cu privire la numărul revizuit al populației și indicatori demografici
  15. "Numărul populaţiei cu reședința obișnuită în Republica Moldova pe sexe şi grupe de vârstă la începutul anului 2019". Numărul populaţiei cu reședința obișnuită în Republica Moldova pe sexe şi grupe de vârstă la începutul anului 2019. 17 July 2019.
  16. "Quarterly statistical bulletin". 10 February 2022.
  17. "Natural movement".
  18. 1 2 "UNSD — Demographic and Social Statistics". unstats.un.org. Retrieved 10 May 2023.
  19. "Yearbook of the State Statistics Service". Archived from the original on 17 April 2021. Retrieved 17 April 2021.
  20. "Главная". Министерство экономического развития.
  21. 1 2 3 Иван Тыняев (18 February 2023). "Демография – 2022". newspmr.com.
  22. 1 2 Иван Тыняев (29 January 2024). "Демография – 2023". newspmr.com.
  23. "The DHS Program – Quality information to plan, monitor and improve population, health, and nutrition programs".
  24. Statistică, Biroul Naţional de (2 August 2013). "// Recensămîntul populației și al locuințelor 2014". Statistica.md. Retrieved 2 August 2017.
  25. "Partidul Liberal despre datele Recensamantului din 2014, prezentate abia astazi, in 2017: "Sunt viciate si nu reflecta realitatea din Republica Moldova"".
  26. 1 2 Перепись населения ПМР [Population census of PMR]. newspmr.com (in Russian). 9 March 2017.
  27. "Webpage of Dubăsari District of Transnistria". Archived from the original on 19 June 2009. Retrieved 9 July 2009.
  28. "Compendiul Statistic al Profilului Migrațional Extins al Republicii Moldova pentru anii 2017-2019" (PDF). BMA.gov. Archived from the original (PDF) on 14 June 2021. Retrieved 29 December 2020.
  29. "Stocul străinilor în Republica Moldova" (PDF). ANUAR STATISTIC: Imigrarea străinilor, azilul și apatridia în Republica Moldova în anul 2020. Archived from the original (PDF) on 24 May 2021. Retrieved 24 May 2021.
  30. "Informație despre numărul străinilor documentați cu permise de ședere în Republica Moldova la data de 31.12.2021" (PDF). Archived from the original (PDF) on 19 April 2023. Retrieved 11 February 2022.
  31. ANUAR STATISTIC: Imigrarea străinilor, azilul și apatridia în Republica Moldova în anul 2022
  32. ANUAR STATISTIC: Imigrarea străinilor, azilul și apatridia în Republica Moldova în anul 2023
  33. BNS: Vоrsta medie a popula?iei dupa ani, medii ?i sexe [ permanent dead link ]
  34. "Durata medie a vietii оn Republica Moldova оn anul 2013". 17 July 2014.
  35. BNS: Speran?a de via?a la na?tere dupa ani, medii ?i sexe [ permanent dead link ]
  36. "Populația stabilă, la începutul anului după Ani, Medii și Sexe, 1970 – 2013".[ permanent dead link ]
  37. "Mortalitatea infantilă pe sexe și medii, 1980–2012". Archived from the original on 12 March 2016. Retrieved 25 August 2019.
  38. Populația și procesele demografice. Căsătorii și Divorțuri statistica.md
  39. "Popula?ia stabila pe sexe ?i medii, la оnceputul anului, 1970–2013". Archived from the original on 12 March 2016. Retrieved 25 August 2019.
  40. Structura popula?iei stabile a Republicii Moldova pe sexe ?i vоrste la 1 ianuarie 2014 statistica.md Accesat la 20.05.2014

General:

PD-icon.svg This article incorporates public domain material from The World Factbook. CIA.