Demographics of North Macedonia

Last updated

Demographic features of the population of North Macedonia include population density, ethnicity, education level, health of the populace, economic status, religious affiliations and other aspects of the population.

Contents

Demographics of North Macedonia
North Macedonia single age population pyramid 2020.png
North Macedonia population pyramid in 2020
PopulationDecrease2.svg 1,836,713 (2021) [1]
Growth rateDecrease2.svg -0.32% (2020) [1]
Birth rateDecrease2.svg 9.2 per 1,000 (2020) [1]
Death rateIncrease Negative.svg 12.4 per 1,000 (2020) [1]
Life expectancyIncrease2.svg 76.40 years (2020)
  maleIncrease2.svg 74.45 years (2020)
  femaleIncrease2.svg 78.41 years (2020)
Fertility rateIncrease2.svg 1.59 live births per woman (2020) [2] [1]
Infant mortality rateIncrease Negative.svg 6.7 per 1,000 (2020) [1]
Net migration rateIncrease2.svg −766 (2020) [2]
Age structure
0–14 yearsDecrease2.svg 17.1% (2012)
15–64 yearsIncrease2.svg 71.0% (2011)
65 and overIncrease2.svg 11.9% (2012)
Sex ratio
At birth1.08 male(s)/female (2012)
Under 151.08 male(s)/female (2004 est.)
15–64 years1.02 male(s)/female (2004 est.)
65 and over0.78 male(s)/female (2004 est.)
Nationality
Nationalitynoun: Macedonian(s)
adjective: Macedonian
Major ethnicDecrease2.svg Macedonians (58.44%) (2021)
Minor ethnicDecrease2.svg Albanians (24.3%) (2021)

Increase2.svg Administrative source (7.2%) (2021) [3]

Increase2.svg Turks 3.86% (2021)

Decrease2.svg Romani 2.53% (2021)

Decrease2.svg Serbs 1.30% (2021)

Increase2.svg Bosniaks 0.87% (2021)

Decrease2.svg Aromanians 0.47% (2021)
Language
Official Macedonian
SpokenDecrease2.svg Macedonian (61.38%) (2021) [4]

Decrease2.svg Albanian (24.34%) (2021) [5]

Increase2.svg Administrative sources (7.2%) (2021) [6]

Decrease2.svg Turkish (3.41%) (2021)

Decrease2.svg Romani (1.73%) (2021)

Increase2.svg Bosnian (0.85%) (2021)

Decrease2.svg Serbian (0.61%) (2021)

Decrease2.svg Aromanian (0.17%) (2021)

Decrease2.svg Other (0.15%) (2021)

Total population

YearResident populationGrowth ratePopulation density per km2
1921808,724-31.5
1931949,958+17.46%36.9
19481,152,986+21.37%44.8
19531,304,514+13.14%50.7
19611,406,003+7.78%54.7
19711,647,308+17.16%64.1
19811,909,136+15.89%74.2
19912,033,964+6.54%79.1
19941,945,932-4.33%75.7
20022,022,547+3.94%78.7
20211,836,713-9.19%71.4
Source: State Statistical Office, North Macedonia [7]

International statistics and estimates

According to statistics from the European Union, the actual population has been reduced by at least 230,000 people who emigrated into European Union member states between 1998 and 2011. [8] Further Albanian news sources estimated at October 2012 that the real population is closer to the sum of 1,744,237 people who are accounted within all of the health funds of the country. [9] [10] According to Bozhidar Dimitrov, the Bulgarian authorities have granted 87,000 to many of those emigrants a Bulgarian passport, as of 2012, which requires that they declare to be ethnic Bulgarians. [11] [12] Since Bulgaria's entry into the European Union, and under pressure from fellow European Union members, Bulgaria imposed more stringent rules and measures for the acquisition of a Bulgarian citizenship and passport.

The provisions of the Ohrid agreement to elevate any minority language if the minority in question is above 20% of the population of any municipality into a co-official language for that municipality has created friction within the government, and between officials of different political and ethnic interests, resulting in the indefinite postponement of the census for almost twenty years until it was finally conducted in 2021. [13]

Vital statistics

[14] [15]

Source: State Statistical Office of the Republic of North Macedonia [16]

Population Data for period 2003-2020 was revised by the Statistical Office of the Republic of North Macedonia [17]

Average populationLive birthsDeathsNatural changeCrude birth rate (per 1000)Crude death rate (per 1000)Natural change (per 1000)Crude migration rate (per 1000)Total fertility rateFemale fertile population (15–49 years)
19501,229,00049,56018,02331,53740.314.725.75.70294,931
19511,262,00045,32920,74724,58235.916.419.57.45.14301,089
19521,280,00051,05417,97833,07639.914.025.8-11.55.64307,247
19531,310,00049,66519,31230,35337.914.723.20.25.26313,405
19541,338,00050,98416,72234,26238.112.525.6-4.25.27317,457
19551,355,00049,09317,91931,17436.213.223.0-10.34.95321,509
19561,357,00047,48615,38632,10035.011.323.7-22.24.63325,561
19571,364,00046,10717,34128,76633.812.721.1-15.94.21341,923
19581,375,00044,61913,91730,70232.510.122.3-14.24.27324,023
19591,382,00044,63814,99829,64032.310.921.4-16.34.21326,697
19601,391,92744,05914,00730,05231.710.121.6-14.44.11330,666
19611,408,30242,18213,14129,04130.09.320.6-8.83.87334,636
19621,427,77140,61516,15524,46028.411.317.1-3.33.68339,207
19631,449,93241,28413,22928,05528.59.119.3-3.83.70346,815
19641,473,99642,89713,28629,61129.19.020.1-3.53.79355,915
19651,499,72942,43312,75829,67528.38.519.8-2.33.67364,762
19661,525,84141,43412,30729,12727.28.119.1-1.73.55374,067
19671,550,45340,76312,52328,24026.38.118.2-2.13.44385,649
19681,575,71440,12312,46127,66225.57.917.6-1.33.35385,966
19691,602,99340,34213,11127,23125.28.217.00.33.24407,438
19701,629,06137,86212,43025,43223.27.615.60.72.98414,466
19711,654,07637,90412,44725,45722.97.515.402.93421,227
19721,679,45638,18713,09625,09122.77.814.90.42.85433,922
19731,704,60237,47812,21725,26122.07.214.80.22.72441,858
19741,729,93538,38212,14326,23922.27.015.2-0.32.70449,166
19751,756,33539,57912,62926,95022.57.215.302.70459,158
19761,783,51839,80912,37727,43222.36.915.40.12.68460,430
19771,810,14838,93212,89926,03321.57.114.40.52.54471,191
19781,836,27038,79012,57726,21321.16.814.30.12.49477,743
19791,863,72839,40712,65326,75421.16.814.40.62.49485,717
19801,891,31939,78413,54226,24221.07.213.90.92.46493,691
19811,916,71339,48813,38326,10520.67.013.6-0.22.48491,236
19821,941,91439,78913,51026,27920.57.013.5-0.42.45494,342
19831,967,55639,21014,39124,81919.97.312.60.62.40506,961
19841,992,42438,86114,06624,79519.57.112.40.22.35510,613
19852,016,94238,72214,40824,31419.27.112.10.22.32516,226
19862,041,06438,23414,43823,79618.77.111.70.32.27521,084
19872,065,00538,57214,64423,92818.77.111.60.12.27529,021
19882,088,65137,87914,56523,31418.17.011.20.32.22530,321
19892,070,91235,92714,59221,33517.37.010.3-18.82.09538,168
19902,053,17235,40114,64320,75817.27.110.1-18.72.06547,749
19912,035,43334,83014,78920,04117.17.39.8-18.42.30512,254
19922,017,69433,23816,02217,21616.57.98.5-17.22.20507,575
19931,999,95532,37415,59116,78316.27.88.4-17.22.15502,896
1994 [18] 1,945,93231,42115,64915,77216.18.08.1-35.12.09501,788
19951,966,03329,88616,16913,71715.28.27.03.31.98505,349
19961,983,00928,94615,88213,06414.68.06.62.01.90511,941
19971,996,86926,83016,37310,45713.48.25.21.81.75517,392
19982,007,52326,63916,62810,01113.38.35.00.31.73520,862
19992,017,14224,96416,6228,34212.48.24.10.71.61523,687
20002,026,35026,16817,0859,08312.98.44.50.11.68526,563
20012,034,88224,18316,7907,39311.98.33.60.61.55529,374
20022,020,15724,15417,8666,28812.08.83.1-10.31.59522,016
20032,022,72523,59617,8135,78311.78.82.9-1.61.55523,044
20042,016,18623,36117,9445,41711.68.92.7-5.91.54520,696
20052,005,33022,48218,4064,07611.29.22.0-7.41.49516,960
20061,994,28722,58518,6303,95511.39.32.0-7.51.51513,243
20071,982,93322,68819,5943,09411.49.91.6-7.31.53509,072
20081,971,49322,94518,9823,96311.69.62.0-7.81.56504,139
20091,958,78223,68419,0604,62412.19.72.4-8.81.63498,130
20101,946,29824,29619,1135,18312.59.82.7-9.11.70490,751
20111,937,39822,77019,4653,30511.810.01.7-6.31.62483,441
20121,929,82123,56820,1343,43412.210.41.8-5.71.71476,635
20131,922,71623,13819,2083,93012.010.02.0-5.71.70469,371
20141,917,55723,59619,7183,87812.310.32.0-4.71.76461,769
20151,912,43023,07520,4612,61412.110.71.4-4.11.76454,398
20161,906,31323,00220,4212,58112.110.71.4-4.61.78447,443
20171,898,65721,75420,3181,43611.510.70.8-4.81.72440,271
2018 [19] 1,889,05121,33319,7271,60611.310.40.9-6.01.73432,640
2019 [20] [21] 1,876,26219,84520,446-60110.610.9-0.3-6.51.65424,658
2020 [22] [23] 1,856,12419,03125,755-6,72410.313.9-3.6-7.11.62416,741
2021 [24] [25] 1,837,11418,64828,516-9,86810.215.5-5.4-4.81.62410,912
20221,831,71218,07322,459-4,3869.912.3-2.4-0.51.59407,934
p2023 [26] 16,31319,738-3,425

Current vital statistics

Life expectancy in North Macedonia since 1950 Life expectancy in North Macedonia.svg
Life expectancy in North Macedonia since 1950
Life expectancy in North Macedonia since 1960 by gender Life expectancy by WBG -North Macedonia -diff.png
Life expectancy in North Macedonia since 1960 by gender

[27]

PeriodLive birthsDeathsNatural increase
January - February 20232.3773.400-1.023
January - February 20242.4593.616-1.157
DifferenceIncrease2.svg +82 (+3.45%)Increase Negative.svg +216 (+6.35%)Decrease2.svg -134

Marriages and divorces

Ethnic groups

The process of industrialization and urbanization after the Second World War that caused the population growth to decrease involved the ethnic Macedonians to a greater extent than Muslims. Rates of increase were very high among rural Muslims: Turks and Torbesh (Macedonian Muslims) had rates 2.5 times those of the Macedonian majority, while Roma had rates 3 times as high. In 1994, Macedonians had a TFR of 2.07, while the TFR of others were: Albanian (2.10), Turkish (3.55), Roma (4.01), Serb (2.07), Vlachs (1.88) and Others (3.05). The TFR by religions was: Christian (2.17, with 2.20 for Catholics and 2.06 for Orthodox), Islam (4.02) and others (2.16). [29]

However, it is unlikely that this high minority TFR has continued since then in North Macedonia, as Balkan fertility elsewhere (Albania, Bosnia and Herzegovina, Kosovo) has dropped sharply toward the European average. A more recent survey [30] pegs Muslim fertility in North Macedonia at 1.7, versus 1.5 for non-Muslims.

Population of North Macedonia according to ethnic group 1948–2021 [31]
Ethnic
group
census 1948census 1953census 1961census 1971census 1981census 1991census 19941census 2002census 2021
Number %Number %Number %Number %Number %Number %Number %Number %Number%
Macedonians 789,64868.5860,69966.01,000,85471.21,142,37569.31,281,19567.01,328,18765.31,295,96466.61,297,98164.181,073,29958.44
Albanians 197,38917.1162,52412.5183,10813.0279,87117.0377,72619.8441,98721.7441,10422.7509,08325.17446,24524.30
Turks 95,9408.3203,93815.6131,4819.4108,5526.686,6914.577,0803.878,0194.077,9593.8570,9613.86
Romani 19,5001.720,4621.620,6061.524,5051.543,2232.352,1032.643,7072.253,8792.6646,4332.53
Serbs 29,7212.635,1122.742,7283.046,4652.844,6132.342,7752.140,2282.135,9391.7823,8471.30
Bosniaks 6,8290.317,0180.8416,0420.87
Aromanians 9,5110.88,6680.78,0460.67,1900.46,3920.37,7640.48,6010.49,6950.488,7140.47
Torbeshi4,1740.23
Bulgarians 8890.19200.13,0870.23,3340.21,9840.11,3700.11,6820.11,4170.073,5040.19
Ashkali2,4060.13
Croats 2,0900.22,7700.23,8010.33,8820.23,3490.22,8780.12,2480.12,6860.132,1450.12
Muslims 1,5600.11,5910.13,0020.21,2480.139,5552.131,3561.515,4180.82,5530.131,1870.06
Montenegrins 2,3480.22,5260.23,4140.23,2460.23,9400.23,2250.12,3180.12,0030.101,0230.06
Yugoslavs 1,2600.13,6520.214,2400.73440.02
other/unspecified [32] 4,3900.45,3040.44,6160.322,9881.46,2280.345,2392.29,8140.514,88720.74136,38937.42
Total1,152,9861,304,5141,406,0031,647,3081,909,1362,033,9641,945,9322,022,5471,836,713
1 Since 1994 residents who were permanently living abroad were no longer included

2 Ashkali: 3,713 or 0.184%, Greeks: 422 or 0.021%, Russians: 368 or 0.018%, Slovenes: 365 or 0.018%, Poles: 162 or 0.008%, Ukrainians: 136 or 0.007%, Germans: 88 or 0.004%, Czechs: 60 or 0.005%, Slovaks: 60 or 0.005%, Jews: 53 or 0.003%, Italians: 46 or 0.002%, Austrians: 35 or 0.002%, Rusyns: 24 or 0.001%, Regionally affiliated: 829 or 0.041%, Non-declared: 404 or 0.02%, Others: 5332 or 0.264%

3 Regionally affiliated: 110 or 0.01%, Non-declared: 450* or 0.02%, Citizens for whom the data are taken from administrative sources, not included directly in the census (without ethnic declaration) 132,260 or 7.20%.*[ clarification needed ]

In 2017, 21,754 children were born in North Macedonia. The ethnic affiliation of these newborns was: 11,260 (51.76%) Macedonian; 7,404 (34.03%) Albanian; 940 (4.32%) Turkish; 1,276 (5.87%) Roma; 40 (0.18%) Vlach; 129 (0.59%) Serbian; 213 (0.98%) Bosniaks; 492 (2,26%) other ethnic affiliation and unknown. [33] [34] In the school year 2016/2017 there were 192 715 students in elementary schools from which 104,756 (55%) were Macedonian, and 60,971 (32%) were Albanian, and in High schools there were 72 482 students from which 43,658 (60.1%) were Macedonian and 22 419 (30.9%) were Albanians. Furthermore, in 1999 Albanians accounted for 34.6% of newborns and 26.1% of students who finished high school in 2016, which was regulated by the Ministry of Education.

Newborns in North Macedonia according to ethnic group
Ethnic group1994 [35] 2002 [36] 2012 [37] 2021 [38] 2022 [39]
Number %Number %Number %Number %Number %
Macedonians 16,70449.8813,63949.1311,99550.909,33850.089,10250.36
Albanians 12,01035.8610,11836.458,03534.096,66335.736,57736.39
Romani 1,3784.121,6786.041,5526.591,2676.791,0946.05
Turks 1,6164.831,2024.331,0924.638354.487564.18
Bosniaks 2511.071770.951861.03
Serbs 4031.201680.611250.531230.661170.65
Vlach (Aromanians) 250.07230.08370.16170.09260.14
other/unspecified1,3514.039333.364812.042281.222151.19
Total33,48727,76123,56818,64818,073

Languages

Source: [40]

Language, census 2021Number %
Total     1,836,713100.00%
Macedonian     1,127,39461.38%
Albanian       447,00124.34%
Turkish        62,7233.41%
Romani        31,7211.73%
Vlach         3,1510.17%
Serbian        11,2520.61%
Bosnian        15,6150.85%
Bulgarian         1,5190.08%
Croatian           9580.05%
Other languages         2,7170.15%
Unknown           4020.02%
Persons for whom data are taken from administrative sources [41]        132,2607.20%

Religion

Source: [42]

Religion, census 2021Number %
Total Christians1,109,90860.43%
   Orthodox847,39046.14%
   Christians (unspecified)242,57913.21%
   Evangelical Protestant Christians8,7640.48%
   Catholics6,7460.37%
   Protestants1,3130.07%
   Jehovah's Witnesses1,1370.06%
   Evangelical Methodists8890.05%
   Evangelists6780.04%
   Adventists3710.02%
   Baptists700.00%
   Reformists500.00%
Islam590,87832.17%
Buddhists8940.05%
Hare Krishna960.01%
Members of the Jewish (Moses) community740.00%
Members of an unlisted religion1130.01%
Non-believers (atheists)8,7640.48%
Undeclared160.00%
Unknown760.00%
Agnostics1,9640.11%
Persons for whom data are taken from administrative sources [43] 132,2607.20%
Total population1,836,713100.00%

CIA World Factbook demographic statistics

The following demographic statistics are from the CIA World Factbook , unless otherwise indicated.

Age structure

Sex ratio

Infant mortality rate

Life expectancy at birth

Total fertility rate

HIV/AIDS

Nationality

See also

Related Research Articles

<span class="mw-page-title-main">Demographics of Bosnia and Herzegovina</span>

Demographic features of the population of Bosnia and Herzegovina include population density, ethnicity, education level, health of the populace, economic status, religious affiliations and other aspects of the population.

<span class="mw-page-title-main">Demographics of Cyprus</span>

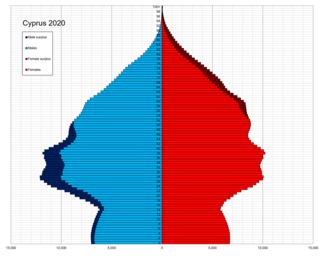
The people of Cyprus are broadly divided into two main ethnic communities, Greek Cypriots and Turkish Cypriots, who share many cultural traits but maintain distinct identities based on ethnicity, religion, language, and close ties with Greece and Turkey respectively. Before the dispute started in 1964 the peoples of Cyprus were dispersed over the entire island.

<span class="mw-page-title-main">Demographics of Greece</span>

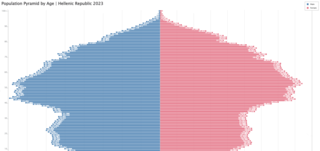
The Demographics of Greece refer to the demography of the population that inhabits the Greek peninsula. The population of Greece was estimated by the United Nations to be 10,445,365 in 2021.

<span class="mw-page-title-main">Demographics of Indonesia</span>

The population of Indonesia was 270.20 million according to the 2020 national census, an increase from 237.64 million in 2010. The official estimate as at mid 2022 was 275,773,800, increasing at a rate of 1.17% per year. Indonesia is the fourth most populous country in the world. Approximately 55% of Indonesia's population resides on Java, which is the most populous island in the world.

<span class="mw-page-title-main">Demographics of Slovenia</span>

Demographic features of the population of Slovenia include population density, ethnicity, education level, health of the populace, economic status, religious affiliations and other aspects of the population.

<span class="mw-page-title-main">Demographics of Turkey</span>

Demographic features of the population of Turkey include population density, ethnicity, education level, health of the populace, economic status, religious affiliations and other aspects of the population.

<span class="mw-page-title-main">Demographics of Azerbaijan</span>

This is a demography of the population of Azerbaijan including population density, ethnicity, education level, health of the populace, economic status, religious affiliations and other aspects of the population.

<span class="mw-page-title-main">Demographics of the Czech Republic</span>

Demographic features of the population of the Czech Republic include population density, ethnicity, education level, health of the populace, economic status, and religious affiliations.

<span class="mw-page-title-main">Demographics of Bulgaria</span> Demographics of Bulgaria

The demography of the Republic of Bulgaria is monitored by the National Statistical Institute of Bulgaria. Demographic features of the population of Bulgaria include population density, ethnicity, education level, health of the populace, economic status, religious affiliations and others.

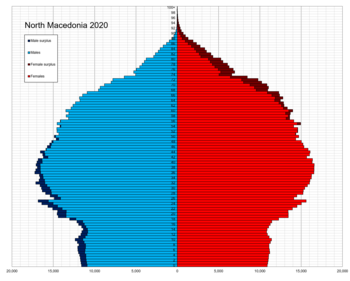
Albanians in North Macedonia are the second largest ethnic group in North Macedonia, forming 446,245 individuals or 24.3% of the resident population. Of the 2,097,319 total population in the 2021 census, 619,187 or 29.52% are Albanians.

<span class="mw-page-title-main">Demographics of the Socialist Federal Republic of Yugoslavia</span> Yugoslavia demographics for 1945 to 1991

Demographics of the Socialist Federal Republic of Yugoslavia, during its existence from 1945 until 1991, include population density, ethnicity, education level, health of the populace, economic status, religious affiliations and other aspects. During its last census in 1991, Yugoslavia enumerated 23,528,230 people. Serbs had a plurality, followed by Croats, Bosniaks, Albanians, Slovenes and Macedonians.

<span class="mw-page-title-main">Demographics of Serbia</span>

Demographic features of the population of Serbia include vital statistics, ethnicity, religious affiliations, education level, health of the populace, and other aspects of the population.

This article presents the demographic history of Serbia through census results. See Demographics of Serbia for a more detailed overview of the current demographics from 2011 census.

<span class="mw-page-title-main">Islam in North Macedonia</span>

Muslims in North Macedonia represent just under one-third of the nation's total population according to the 2021 census, making Islam the second most widely professed religion in the country. Muslims in North Macedonia follow Sunni Islam of the Hanafi madhhab. Some northwestern and western regions of the country have Muslim majorities. A large majority of all the Muslims in the country are ethnic Albanians, with the rest being primarily Turks, Romani, Bosniaks or Torbeš.

<span class="mw-page-title-main">Religion in North Macedonia</span> Overview of religion in North Macedonia

In North Macedonia, the most common religion is Eastern Orthodox Christianity, practiced mainly by ethnic Macedonians, Serbians, Vlakhs, and Romanis. The vast majority of the Eastern Orthodox in the country belong to the Macedonian Orthodox Church, which declared autocephaly from the Serbian Orthodox Church in 1967.

This article presents the Demographic history of North Macedonia through census results since 1948.

<span class="mw-page-title-main">Demographics of Kosovo</span>

The Kosovo Agency of Statistics monitors various demographic features of the population of Kosovo, such as population density, ethnicity, education level, health of the populace, economic status, religious affiliations and other aspects of the population. Censuses, normally conducted at ten-year intervals, record the demographic characteristics of the population. According to the first census conducted after the 2008 declaration of independence in 2011, the permanent population of Kosovo had reached 1,810,366.

<span class="mw-page-title-main">Podgorci, Struga</span> Village in Southwestern, North Macedonia

Podgorci is a small village in the municipality of Struga, North Macedonia.

<span class="mw-page-title-main">Oktisi</span> Village in Southwestern, North Macedonia

Oktisi is a village in the municipality of Struga, North Macedonia.

<span class="mw-page-title-main">Adžievci</span> Village in Polog, North Macedonia

Adžievci is a village in the municipality of Mavrovo and Rostuša, North Macedonia.

References

  1. 1 2 3 4 5 6 "Address by the Director of the State Statistical Office on the completion of the Census 2021".
  2. 1 2 "Индикатори".
  3. "State Statistical Office - Census Law - Article 5 (2)" (PDF). State Statistical Office (in Macedonian). 2022-04-08.
  4. "Census of Population, Households and Dwellings in Macedonia 2002" (PDF). Stat.gov.mk. Retrieved 2017-08-29.
  5. "Census of Population, Households and Dwellings in the Republic of North Macedonia, 2021 - first dataset" (PDF). Stat.gov.mk. Retrieved 2023-08-13.
  6. "State Statistical Office - Census Law Article 5 (2)" (PDF). State Statistical Office (in Macedonian). 2022-04-08.
  7. "MakStat database".
  8. "Macedonia Population Drained by Emigration, Report Says". Balkan Insight . 15 May 2013. Retrieved 2017-08-29.
  9. "Fall in the number of population in FYROM". Balkaneu.com. Retrieved 2017-08-29.
  10. "Σκόπια: Σημαντική μείωση του πληθυσμού". Echedoros-a.gr. Retrieved 2017-08-29.
  11. "Божидар Димитров: 86.000 Македонци извадиле бугарски пасош". 11 January 2013. Archived from the original on 11 January 2013. Retrieved 15 December 2017.
  12. "Димитров: 86.000 Македонци досега извадиле бугарски пасош". A1on.mk. 8 January 2013. Archived from the original on 2016-03-04. Retrieved 2017-08-29.
  13. Trkanjec, Zeljko (2021-10-04). "North Macedonia 2021 census is over". www.euractiv.com. Retrieved 2021-10-23.
  14. "Latest publications".
  15. "Eurostat database".
  16. "State Statistical Office of the Republic of Macedonia".
  17. "State Statistical Office of the Republic of Macedonia"./
  18. "Demographics statistics by regions, 1994-2004" (PDF).
  19. "Statistical Yearbook, 2019".
  20. "Natality in the Republic of North Macedonia, 2019".
  21. "Mortality in the Republic of North Macedonia, 2019".
  22. "Natality in the Republic of North Macedonia, 2020".
  23. "Mortality in the Republic of North Macedonia, 2020".
  24. "Natality in the Republic of North Macedonia, 2021".
  25. "Mortality in the Republic of North Macedonia, 2021".
  26. "State Statistical Office: Natural change in population in the Republic of North Macedonia, fourth quarter of 2023 - provisional data". www.stat.gov.mk. Retrieved 2024-02-28.
  27. "Monthly Statistical Bulletin" (PDF).
  28. "Мarriages and divorces in Republic of North Macedonia, in 2019 - final data" (PDF).
  29. "New Balkan Politics - Issue 2". Archived from the original on 2007-09-28. Retrieved 2010-05-15.
  30. "FactCheck: Will Britain have a Muslim majority by 2050? | the FactCheck Blog". Archived from the original on 2013-06-17. Retrieved 2013-06-14.
  31. "Dabase". Archived from the original on 2011-03-09. Retrieved 2011-02-24.
  32. "State Statistical Office - Census Law - Article 5 (2)" (PDF). State Statistical Office (in Macedonian). 2022-04-08.
  33. "Statistical Yearbook of the Republic of Macedonia, 2018, p. 83" (PDF). North Macedonia, State Statistical Office. 2016. Retrieved 20 October 2018.
  34. "Државен завод за статистика - публикација: Основни и средни училишта на крајот на учебната година". www.stat.gov.mk (in Macedonian). Retrieved 2018-11-24.
  35. "Statistical Yearbook of the Republic of Macedonia, 1999, p. 21". North Macedonia, State Statistical Office. 1999. Retrieved 20 October 2018.
  36. "Statistical Yearbook of the Republic of Macedonia, 2004, p. 65". North Macedonia, State Statistical Office. 2004. Retrieved 20 October 2018.
  37. "Statistical Yearbook of the Republic of Macedonia, 2014, p. 79" (PDF). North Macedonia, State Statistical Office. 2014. Retrieved 20 October 2018.
  38. "North Macedonia in figures, 2021" (PDF).
  39. "State Statistical Office - Publication: North Macedonia in Figures". www.stat.gov.mk. Retrieved 2023-06-30.
  40. "Total resident population in the Republic of North Macedonia by mother tongue and sex, Census 2021". Archived from the original on 2022-03-31. Retrieved 2022-03-31.
  41. "State Statistical Office - Census Law - Article 5 (2)" (PDF). State Statistical Office (in Macedonian). 2022-04-08.
  42. "Total resident population in the Republic of North Macedonia by religious affiliation and sex, Census 2021". Archived from the original on 2022-12-27. Retrieved 2022-03-31.
  43. "State Statistical Office - Census Law - Article 5 (2)" (PDF). State Statistical Office (in Macedonian). 2022-04-08.
  44. "Eurostat - Tables, Graphs and Maps Interface (TGM) table". ec.europa.eu. Retrieved 15 December 2017.
  45. 1 2 Under the terms of the Prespa agreement, the nationality of the country will be called "Macedonian/citizen of the Republic of North Macedonia" in full.

Other sources