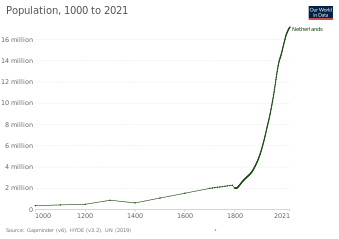
The Netherlands is the 67th most populated country in the world. As of January 2023, the Netherlands has a population of 17,821,419.[1]
Between 1900 and 1950 the population almost doubled from 5.14 to 10.11 million people. From 1950 to 2000 the population increased from 10.11 to 15.92 million people, increasing by a smaller proportion but, still, at an impressive pace for a European country, recording a growth of 57.45% over a 50-year time span.[2]
Of countries with at least 7.5 million people, The Netherlands is the 4th most densely populated, and is the 33rd most densely populated in the world overall. It is the 5th most densely populated country in Europe; the first four are microstates. The 17,821,419 million Dutch inhabitants are concentrated on an area of 41,543km2 (16,040sqmi) including water surface, the land surface being 33,895km2 (13,087sqmi). This means that the country has a population density of 526/km2 (1,360/sqmi). The density of 500 inhabitants/km2 was reached in the first half of 2014.
As a result of these demographic characteristics, the Netherlands has had to plan its land use strictly. Since 1946 the Ministry of Housing, Spatial Planning and the Environment has been occupied with the national coordination of land use. Because of its high population density the Netherlands has also reclaimed land from the sea by poldering. Between 1927 and 1968 an entire province - Flevoland - was created. As of May 2023 it houses 447,193 people.[3] Because of these policies, the Dutch have been able to combine high levels of population density with extremely high levels of agricultural production.
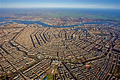
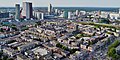
Even though the Netherlands is so densely populated, it has no municipalities with a population over one million. Nevertheless, the two largest municipalities of the country do score well over a million if the complete city region is counted, thus including the neighbouring satellite towns that often are physically connected to the main municipality. Moreover, the "four big cities" (Amsterdam, Rotterdam, The Hague and Utrecht) can in many ways be regarded as a single metropolitan area, the Randstad ("rim city" or "edge city") with over 7.5 million inhabitants around an agricultural "green heart" (Groene Hart).
Demographic statistics according to the World Population Review in 2019.[4]
One birth every 3 minutes
One death every 4 minutes
One net migrant every 31 minutes
Net gain of one person every 11 minutes
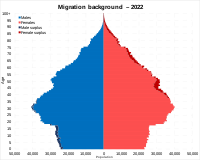
Graphs are unavailable due to technical issues. There is more info on Phabricator and on MediaWiki.org.
Graphs are unavailable due to technical issues. There is more info on Phabricator and on MediaWiki.org.
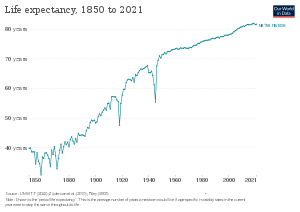
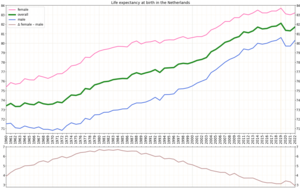
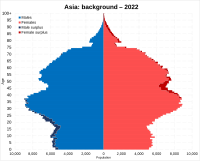
The Dutch population is ageing. Furthermore, life expectancy has increased because of developments in medicine, and in addition to this, the Netherlands has seen increasing immigration. Despite these developments combined with the population boom after the Second World War, the low birth rate has caused extremely low population growth: 2005 saw the lowest absolute population growth since 1900.
This demographic development has consequences for health care and social security policy. As the Dutch population ages, the proportion of people of working age, as a percentage of the entire population, decreases. Important policy advisors like the CBS (Statistical Office) and the CPB (Planning Office) have pointed out that this will cause problems with the current system of old age pensions: fewer people will work to pay for old age pensions, while there will be more people receiving those pensions. Furthermore, the costs of health care are also projected to increase. These developments have caused several cabinets, notably the second Balkenende cabinet to reform the system of health care and social security to increase participation in the labour market and make people more conscious of the money they spend on health care.
In 2003, the annual birth rate per thousand was highest in the province of Flevoland (15.9). The overall lifelong Total fertility rate (TFR), was highest in the province of Flevoland (2.0) and lowest in the province of Limburg (1.6). The municipality with the highest TFR was Urk (3.23) followed by Valkenburg (2.83), Graafstroom (2.79) and Staphorst (2.76). The lowest TFRs were recorded in Vaals (1.11) and Thorn (1.21).[8]
The total population at December 31, 2006 was 16,356,914. The population loss due to net emigration was 35,502 (an estimated 40-50% of emigrants were ethnic non-Dutch).
In 2007, there were 117,000 immigrants (including 7000 Germans, 6000 Poles, 5000 Bulgarians, 3000 Turks and 2000 Moroccans) and 123,000 emigrants. Nearly half the emigrants were native Dutch, followed at a distance by nearly 5000 Poles and more than 3000 Germans. There was an observable increase in net immigration from the former USSR, Bulgaria and Romania.[9]
The annual death rate was lowest in the municipalities of Valkenburg (2.9 per 1000), Zeewolde (3.2), Renswoude (3.4), Westervoort and Zeevang (both 3.9). The highest annual death rates were recorded in Warmond (22.3 per 1000), Laren (19.9) and Doorn (18.8).[10]
16.4% of the total births in 2003 were to parents of non-European origin, although they account for only 12.4% of the population in the 25-34 age group. For example, 3.8% of the births were ethnic Moroccan, although they were only 2.26% of the 25-34 age group. Respective figures were 3.27% and 3.0% for Turks. The TFR for Moroccans in 2003 was 3.3 while the general TFR was 1.73. TFR was 2.3 for Turks, 1.7 for Surinamese, 1.8 for Arubans, 3.0 for Africans and 1.8 for Americans.[11] (These figures compare with a figure of around 2.1 required to maintain a stable overall population figure.)
According to Statistics Netherlands, for the year 2007, the TFR for those born in Netherlands was 1.72[12] (1.65 in 2000). TFR of Moroccan immigrants was 2.87 (3.22 in 2000) and that of Turkish immigrants was 1.88 (2.18 in 2000).[13]
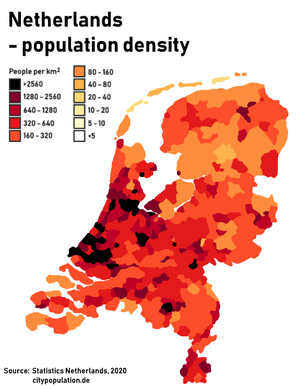
Population density in the Netherlands by municipality. The largest urban area, the Randstad is clearly visible along the west coast.
"Functional urban areas"[17] are a type of urban areas with large populations where commuters from nearby areas work in the core area. There are several functional urban areas officially identified in the Netherlands. The largest ones (with populations over 300,000) are listed below, which count the populations of the core city and their "commuting zones".[18]
Between 1590 and 1800 the estimated share of foreign-born population was consistently above 5%.[23]
According to Eurostat, in 2010 there were 1,800,000 foreign-born residents in the Netherlands, corresponding to 11.1% of the total population. Of these, 1,400,000 (8.5%) were born outside the EU (including those from Dutch colonies) and 428,000 (2.6%) were born in another EU member state. The most common countries of birth being: Belgium, Germany, Poland and the United Kingdom.[24] On 1 January 2016, 26,2% of persons aged 0–50 had at least one parent born in a foreign country. 11,4% of persons aged 0–50 of 'Dutch background' belonged to the 'third generation', the majority descending from Western immigrants. The third generation constitutes persons born from two second generation immigrants or one second generation immigrant and one person with a Dutch background. First and second generation immigrants and the third generation were 34,5% of the population aged 0–50.[25]
As the result of immigration from overseas, the Netherlands have a sizeable minority of non-indigenous peoples. There is also a considerable level of emigration, in majority consisting of former immigrants. In 2005, some 121,000 people left the country, while 94,000 entered it. Out of a total of 101,150 people immigrating into the Netherlands in 2006, 66,658 were from Europe, Oceania, the Americas or Japan, and 34,492 were from other (mostly developing) countries. Out of a total of 132,470 emigrants, 94,834 were going to Europe, Oceania, the Americas or Japan and 37,636 to other countries.[26]
A large number[23] of immigrants come from countries in Western Europe, mostly from the neighbouring countries of Germany and Belgium. There were five subsequent waves of immigration to the Netherlands in recent history.
In the late-1940s and into the 1950s, following the end of the Second World War, people from the newly independent Republic of Indonesia repatriated or emigrated to the Netherlands - mainly Indo-European (people of mixed European and Indonesian ancestry of Dutch nationality) and supporters of the Republic of South Maluku.
Between 1960 and 1974, migrants from Greece, Portugal, Spain, Turkey and Morocco came to work in the Netherlands as guest workers. They were expected to return to their own country and many did, but others remained and in the 1970s and 1980s were joined by their families. Until 2004, when marriage immigration was restricted, their children usually married others from their home country.[citation needed]
After 1974, people emigrated from the newly independent Suriname and from the Netherlands Antilles, which remained part of the Kingdom of the Netherlands. In 1974, about forty thousand Surinamese migrated while still retaining Dutch citizenship; between 1975 and 1980 there was a transitional arrangement allowing migration. Antilleans have the Dutch nationality and behave like typical labour migrants, travelling to and from the country in response to the employment available.
During the 1970s and 1980s, the number of asylum seekers was low, consisting e.g. of Chileans fleeing from political oppression and/or persecution. In the 1990s, asylum migration sharply increased,[27] largely consisting of Yugoslavs, Somalis, Iraqis, Iranians, Ethiopians, Eritreans, Afghans and Vietnamese, fleeing war or famine.[28] Between 2000 and 2014 asylum migration strongly decreased due to the strict "Cohen Law". However, the Syrian Civil War from 2011 resulted in a large influx of Syrian asylum seekers in 2015 and 2016; about ninety thousand Syrians had been granted asylum by 2018.
Since the 2000s, migrant workers and their families from the newly joined EU member states in Central and Eastern Europe, including: Poland, Romania and Bulgaria, and non-EU states Moldova, Ukraine and the former Yugoslavia.[citation needed] In addition, a number of Spaniards, Greeks, Italians, and Portuguese also migrated due to the impact of the Great Recession in those countries. In 2005, non-Western ethnic population comprised 1.7 million individuals, about 10% of the population in the country.[29]
Illegal immigration to the Netherlands results in automatic deportation[30] but this is often not enforced for various reasons such as unknown country of origin, etc. Many Dutch provinces in 2012 had quotas for deporting illegal immigrants.[31][32][33][34]
By 2017, persons with an immigration background, both western and non-western, formed a majority in Amsterdam (2011), Rotterdam (2013) and The Hague, the three largest cities of the Netherlands.[35]
In 2005, the governmental Sociaal en Cultureel Planbureau in its annual report, noted recurring integration problems for ethnic minorities. While during the economic boom of the 1990s their unemployment and dependence on welfare had strongly decreased, the economic downturn between 2001 and 2004 disproportionally affected immigrant groups. This would be explained by their functioning as a labour reserve, by their lower educational levels and by lower language skills. The report also noted that per capita social interactions between native Dutch and immigrant populations tended to decline over time, partly explainable by the size growth of immigrant groups. Integration levels strongly varied between groups. Surinamese and Antilleans were well economically integrated, but the latter less so culturally. Cultural integration was limited for Turks, but better for Moroccans. Of the asylum seekers, Somalis were among the least integrated into Dutch society, while Iranians were the best integrated with the highest education levels and modern lifestyles. Though the educational levels of the second generation were a significant improvement over those of the first generation, they still lagged behind the native Dutch who themselves on average had been attending ever higher school types. While half of all native Dutch pupils in 2005 proceeded to higher secondary education (HAVO and VWO), for Turks and Moroccans the share was a fifth and for Somali pupils even lower.[29]
In 2007, non-Western groups were generally socio-economically disadvantaged and of the four largest non-Western groups, Turks and Moroccans were the most disadvantaged. In 2006 38.7% of Moroccans and 43.9% of Turks aged 15–64 were in employment, their unemployment rate was about four times the level of the native Dutch (17.2% for Moroccans and 15.1% for Turks), and 30% received some type of social welfare.[23]
After 2008, the financial crisis and the eurocrisis again hit immigrant groups particularly hard. In 2012, at 12% non-Western migrants were six times more likely than native Dutch to receive social welfare benefits, with 2% for the Dutch.[36]
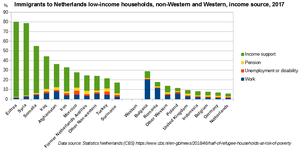
Western and non-Western fraction of low-income households and source of income. Data sourced from Statistics Netherlands.
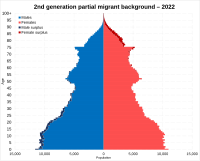
According to a 2010 Statistics Netherlands report, the third generation of non-Western immigrants was predominantly young with 80% being younger than 15, while growing with 10% each year. The third generation have a similar employment rate as the native Dutch and receive a similar amount of social benefits. The third non-Western generation follow adult education more frequently than both the native Dutch and non-Western immigrants. The non-Western immigrant population as a whole has 1.5 to 2 times the benefit dependence compared to the natives. The non-Western third generation had a rate slightly higher than the native Dutch as crime suspects, but lower than for non-Western immigrants as a whole.[38][39]
According to Statistics Netherlands, nearly 53% of refugee households have a low income, six times the Netherlands average (8.2%).[37] For Syrian and Eritrean households the share is about 80%. At 33% the poverty risk is lowest among Iranian refugee households. The group of Syrian households at risk of poverty grew from ten thousand (76% of all Syrian households in 2016) to eighteen thousand (79% of all Syrian households) in 2018. Households of Polish, Romanian or Bulgarian origin have a greater than average risk of poverty even though households from these Eastern European countries generally depend on work for their income. Migrant workers from Eastern Europe generally perform low-skilled work while migrants from Western Europe are often highly educated.[37]
Immigrants from foreign countries are divided into several ethnic groups. For example, there are both Russians and Chechens from Russia, Turks and Kurds from Turkey, Serbs and Albanians from Serbia and immigrants from Iran are divided into Persians, Azeris and Kurds.[40]
National origins
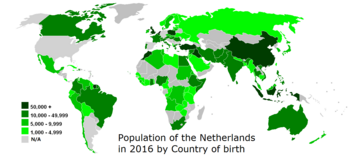
Population of the Netherlands by country of birth
Pie chart showing the breakdown of the Netherlands by national origin (2022)
As of 1January2022[update], 4 438 900 citizens are of non-Dutch/Frisian origin. A majority of these (50,86%) are from seven backgrounds alone: Turks (inc. Kurds), Moroccans (inc. Berbers), Surinamese, Indonesians (inc. Moluccans), Germans, Poles and Curaçao.[41]
With the huge expansion of the European Union during the 2000s, the Netherlands has seen a rise in the number of immigrants coming from new member states. Migrant workers from these countries are estimated to be about 100,000 as of 2007.[42] Legal migrants from new EU-member states doubled between 2007–11 to 200,000,[43] with estimates totaling up to 300,000. Of the Poles who initially moved to the Netherlands in 2004, about a quarter had returned to Poland by 2006.[44] In addition, a large number of Syrians moved to the Netherlands in the 2010s mostly as refugees, with the population increasing seven-fold between 2014 and 2019. Both Poles and Syrians have overtaken the population of Antilleans during the decade.[41] More than 36,000 Roma live in the Netherlands.[45] Dutch Roma, Sinti and Dutch Jews were decimated by the Holocaust.[46][47] However, the Jewish population has seen growth in the Netherlands in recent years.[48]
The Netherlands has seen considerable emigration. In the 1950s, 560,000[citation needed] people migrated to the United States, South Africa, Australia, Canada and New Zealand, leaving their war-torn and overpopulated home country behind. At least 60,000 of these migrants were Indo-European (mixed Dutch-Indonesian) repatriates that moved on, mostly to the United States, after being repatriated to the Netherlands from the former Dutch East Indies during and after the Indonesian Revolution.
In 2005, some 121,000 people migrated from the Netherlands. There is considerable migration towards neighbouring states, Belgium, Germany and the United Kingdom and to the Netherlands Antilles. Furthermore, almost half of the current emigration consists of people returning to their country of birth, including rejected asylum seekers, after the more stringent migration laws were implemented.
Education by background
According to a 2016 study by Statistics Netherlands, students with a non-western background generally study at a lower level of secondary education. 48 percent of those with a Dutch background were at HAVO or VWO level at third year, compared to 23 percent for Dutch Turks, 28 percent for Dutch Moroccans, 35 percent for Dutch Surinamese and 31 percent for Dutch Antilleans. Some backgrounds fared better: over 40 percent of Dutch Afghans studied at HAVO/VWO level, and for Dutch Iranians the rate was 50 percent, which was above native Dutch students.[53]
Employment and income
Unemployment, youth ages 15–24
total: 7.2%. Country comparison to the world: 130th
In 2013, Statistics Netherlands found that 26% of the population identified as Roman Catholic, 16% as Protestant, 5% as Muslim, and 6% as "other" (the last includes other Christian denominations, Hindus 0.6%, Jews 0.1%, and Buddhists 0.4%). The agency interviewed 355,237 people in the period 2010–2013. [54] In 2019, the Central Bureau of Statistics reported that for the first time non-religious people were in the majority in the Netherlands. Only 49% of people older than 15 years reported to be religious; in 2012 that was still 54%. The largest religion was still Catholicism (24%), while 5% identified with Islam.[55]
The main language is Dutch, while Frisian (known as West Frisian outside of the Netherlands) is also a recognized language in the province of Friesland and is used by the government and schools there. Several dialects of Low Saxon (Nedersaksisch in Dutch) are spoken in much of the north and east and are recognized by the Netherlands as regional languages according to the European Charter for Regional or Minority Languages. Another group of dialects granted the status of regional language is Limburgish, which is spoken in the south-eastern province of Limburg. Major immigrant languages are Indonesian, Turkish, Arabic, Berber, Papiamento, German and Polish.
Kapelle is a municipality and a town in the southwestern Netherlands on Zuid-Beveland. In 2023 the municipality's population amounts to 13,051.
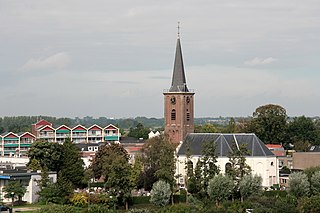
Rozendaal is a municipality and a town in the eastern Netherlands, in the province of Gelderland. The town, next to Arnhem and Velp, is known for the Rozendaal Castle and its water fountain follies (bedriegertjes).
Islam is the second largest religion in the Netherlands, after Christianity, and is practised by 5% of the population according to 2018 estimates. The majority of Muslims in the Netherlands belong to the Sunni denomination. Many reside in the country's four major cities: Amsterdam, Rotterdam, The Hague and Utrecht.
Mijdrecht is a town in the Netherlands with about 16,000 residents. It is located in the municipality of De Ronde Venen, about 7 kilometres (4.3 mi) west of the main A2 motorway, between Utrecht and Amsterdam.
Allochtoon is a Dutch word, literally meaning "emerging from another soil". It is the opposite of the word autochtoon, literally meaning "emerging from this soil".
Turks in the Netherlands refers to people of full or partial Turkish ethnicity living in the Netherlands. They form the largest ethnic minority group in the country; thus, the Turks are the second-largest ethnic group in the Netherlands after the ethnic Dutch. The majority of Dutch Turks descend from the Republic of Turkey; however, there has also been significant Turkish migration waves from other post-Ottoman countries including ethnic Turkish communities which have come to the Netherlands from the Balkans, the island of Cyprus, as well as from other parts of the Levant. More recently, during the European migrant crisis significant waves of Turkish minorities from Syria and Kosovo have also arrived in the Netherlands. In addition, there has been migration to the Netherlands from the Turkish diaspora; many Turkish-Belgians and Turkish-Germans have arrived in the country as Belgian and German citizens.
Cape Verdeans in the Netherlands consist of migrants from Cape Verde to the Netherlands and their descendants. As of 2022, figures from Statistics Netherlands showed 23,150 people of Cape Verdean origin in the Netherlands.
Moroccans in the Netherlands are Dutch citizens of Moroccan origin. They consist of immigrants from Morocco and their descendants, and form the second largest ethnic group in the Netherlands.
Dutch Pakistanis formed a population of 27,261 individuals according to the latest official statistics published by the Netherlands Centraal Bureau voor de Statistiek on 1 January 2022.
Dutch Afghans are Dutch citizens and non-citizen residents born in, or with ancestors from, Afghanistan. In 2015 there were 44,000 Dutch Afghans, which form one of the largest Afghan diaspora communities as well as one of the main Asian communities in the Netherlands. Most of the first generation population originally settled in the Netherlands between 1992 and 2001.
Somalis in the Netherlands are residents or naturalized citizens of the Netherlands who are of Somali ancestry. They form one of the larger Somali communities in Europe and amongst the second largest African foreign community in the Netherlands. The Somalis form the second largest African community in The Netherlands and are one of the fastest growing communities.
There is a small population of Angolans in the Netherlands numbering around 10,000 people, largely consisting of refugees from the Angolan Civil War.
There is a small community of Nigerians in the Netherlands, which began to grow in the late 1980s.
Arab Dutch, also referred to as Dutch Arabs, are citizens or residents of the Netherlands whose ancestry traces back to the Arab World.
Surinamese people are people who identify with the country of Suriname. This connection may be residential, legal, historical or cultural. For most Surinamese, several of these connections exist and are collectively the source of their being Surinamese.
Indians in the Netherlands are residents of Indian origin in the Netherlands. The majority of the people of Indian descent in the Netherlands are of Indo-Surinamese origin. More recently the flow of emigrants from India has increased, as well as from Guyana and Trinidad and Tobago, mostly those married to Indo-Surinamese.
Portuguese in the Netherlands are the citizens or residents of the Netherlands whose ethnic origins lie in Portugal.
Nepalese in the Netherlands consists of immigrants, expatriates and international students from Nepal to the Netherlands as well as Dutch people of Nepalese origin. As of 2010, statistics of the Dutch Centraal Bureau voor de Statistiek shows that there are about 1,505 people of Nepalese origin living in the country.
Despite the historic usage of wind power to drain water and grind grain, the Netherlands today lags 21 of the 26 other member states of the European Union in the consumption of energy from renewable sources. In 2022, the Netherlands consumed just 15% of its total energy from renewables. According to statistics published by Eurostat, it was the last among the EU countries in the shift away from global warming-inducing energy sources. The leading renewable sources in the country are biomass, wind, solar and both geothermal and aerothermal power. In 2018 decisions were made to replace natural gas as the main energy source in the Netherlands with increased electrification being a major part of this process.
Hongkongers in the Netherlands are people in the Netherlands originated from Hong Kong or having at least once such parent.
↑ Note: Crude migration change% is a trend analysis, an extrapolation, based average population change (current year minus previous) minus natural change of the current year (see table vital statistics). As average population is an estimate of the population in the middle of the year and not end of the year.
This page is based on this Wikipedia article Text is available under the CC BY-SA 4.0 license; additional terms may apply. Images, videos and audio are available under their respective licenses.