Demographics of Kazakhstan

Last updated

Demographics of Kazakhstan
Kazakhstan Population Pyramid.svg
Kazakhstan population pyramid as of January 1, 2023
Population20,095,963 (1 April, 2024) [1]
Density7.29531/km2
Growth rate13.5/1,000 population (2010 est.)
Birth rate22.4 births/1,000 population (2010 est.)
Death rate8.9 deaths/1,000 population (2010 est.)
Life expectancy72.25 years
  male67.12 years
  female77.06 years (2021 est.)
Fertility rate3.3 children born/woman (2021 est.) [2]
Infant mortality rate18.4 deaths/1,000 live births
Age structure
0–14 years29.5% (male 3,001,983/female 2,833,471)
15–64 years62.0% (male 6,028,354/female 6,224,431)
65 and over8.5% (male 617,364/female 1,061,204) (2023 Est.) [3]
Sex ratio
Total0.95
At birth1.06 male(s)/female
Under 151.05 male(s)/female
15–64 years0.95 male(s)/female
65 and over0.54 male(s)/female
Nationality
NationalityKazakh(s) or Kazakhstani(s)
Major ethnic Kazakh
Minor ethnicRussian, Uzbek, Ukrainian, Uyghur, Tatar, German
Language
OfficialKazakh
SpokenKazakh, Russian and others

The demographics of Kazakhstan enumerate the demographic features of the population of Kazakhstan, including population growth, population density, ethnicity, education level, health, economic status, religious affiliations, and other aspects of the population. Some use the word Kazakh to refer to the Kazakh ethnic group and language (autochthonous to Kazakhstan as well as parts of China and Mongolia) and Kazakhstani to refer to Kazakhstan and its citizens regardless of ethnicity, [4] [5] but it is common to use Kazakh in both senses. [6] [7] [8] It is expected that by 2050, the population will range from 23.5 to 27.7 million people. [9]

Contents

Overview

Official estimates put the population of Kazakhstan at 18,137,300 as of December 2017, of which 44% is rural and 56% urban population. [10] The 2009 population estimate is 6.8% higher than the population reported in the last census from January 1999 (slightly less than 15 million). These estimates have been confirmed by the 2009 population census, and this means that the decline in population that began after 1989 has been arrested and reversed.

In a report released by the United Nations Department of Economic and Social Affairs (DESA) in September 2021, the level of urbanization in Kazakhstan is estimated to reach 69.1% by 2050. [11]

The proportion of men makes up 48.3%, the proportion of women 51.7%. The proportion of Kazakhs makes up 70.7%, Russians 15.2%, Uzbeks 2.9%, Ukrainians 2.1%, Uygur 1.4%, Tatars 1.3%, Germans 1.1%, others 3.9%. Note that a large percentage of the population are of mixed ethnicity.

The first census in Kazakhstan was conducted under Russian Imperial rule in 1897, which estimated population at round 4 million people. Following censuses showed a growth until 1939, where numbers showed a decrease to 6,081 thousand relative to the previous census done 13 years earlier, due to famines of 1922 and 1933.

But since 1939 population has steadily increased to 16.5 million in 1989, according to corresponding year census. Official estimates indicate that the population continued to increase after 1989, peaking out at 17 million in 1993 and then declining to 15 million in the 1999 census. The downward trend continued through 2002, when the estimated population bottomed out at 14.9 million, and then resumed its growth. [12] Significant numbers of Russians returned to Russia. Kazakhstan underwent significant urbanization during the first 50 years of the Soviet era, as the share of the rural population declined from more than 90% in the 1920s to less than 50% since the 1970s. [13] The fertility rate declined to amongst the lower rates in the world in 1999 and increased to again amongst the higher rates in the world in 2021.

Kazakhstanis on a Lake Jasybay beach, Pavlodar Region Dzhasybay beach.jpg
Kazakhstanis on a Lake Jasybay beach, Pavlodar Region

Population size and structure

Population of Kazakhstan 1897–2018

Year (January)Population (thousands)Rural, %Urban, %Source
18974,000n/an/acensus
19266,198n/an/acensus
19396,0817228census
19599,2955644census
197013,0015050census
197914,6854654census
198916,5374357census
199914,9534357census
200915,9824654census
202320,1373961estimate
Data sources: Population 1897 from Russian Empire Census. Population 1926 from First All-Union Census of the Soviet Union. Population 1939–1999 from demoscope.ru, [12] 2002–2008 from Kazakhstan Statistical Agency web site. [14] Rural/urban shares 1939–1993 from statistical yearbooks, print editions, [13] 2002–2008 from Kazakhstan Statistical Agency web site. [14] 2009–2014 from Kazakhstan Statistical Agency web site. [15]

As of 2003, there were discrepancies between Western sources regarding the population of Kazakhstan. United States government sources, including the CIA World Fact Book and the US Census Bureau International Data Base, listed the population as 15,340,533, [16] while the World Bank gave a 2002 estimate of 14,858,948. [17] This discrepancy was presumably due to difficulties in measurement caused by the large migratory population in Kazakhstan, emigration, and low population density – only about 5.5 persons per km2 in an area the size of Western Europe.

Structure of the population

Population Estimates by Sex and Age Group (01.VII.2021) (Data refer to resident population.): [18]

Age GroupMaleFemaleTotal%
Total9 223 5899 777 39919 000 988100
0223 552209 539433 0902.28
1–4818 257766 7881 585 0458.34
5–9982 270927 1081 909 37710.05
10–14857 617811 6961 669 3138.76
15–19643 879610 9431 254 8216.60
20–24568 174544 6341 112 8085.86
25–29699 428680 0331 379 4617.26
30–34793 785815 7811 609 5668.47
35–39690 052709 5801 399 6317.37
40–44586 612615 2371 201 8496.33
45–49525 164576 3471 101 5105.80
50–54475 079532 0771 007 1565.30
55–59449 996534 713984 7095.18
60–64375 734486 204861 9384.54
65–69241 436361 664603 0993.17
70–74149 026263 406412 4322.17
75–7960 581122 881183 4620.97
80–8457 026141 863198 8891.05
85–8917 02947 32064 3480.34
90–945 91515 74721 6620.11
95–991 9803 0134 9930.03
100+1 0028311 8320.01
Age groupMaleFemaleTotalPercent
0–142 881 6962 715 1295 596 82529.46
15–645 807 8986 105 54811 913 44662.70
65+533 995956 7221 490 7177.84

Structure of the population (01.01.2021) (Estimates): [19]

Age GroupMaleFemaleTotal%
Total9 160 3999 719 15318 879 552100
0–152 980 2972 809 2365 789 53330.7
16–62(59)5 524 1375 485 23511 009 37258.3
63(60)+655 9651 424 6822 080 64711.0

The age group under 15 is considered below the working age, while the age group over 63(60) is above the working age (63 years for men, 60 for women).

Vital statistics

Births and deaths

[20] [21] [22] [23]

Average populationLive births1Deaths1Natural change1Crude birth rate (per 1000)Crude death rate (per 1000)Natural change (per 1000)Fertility rates
19506,703,000254,16979,005175,16437.911.826.1
19516,946,000272,35480,553191,80139.211.627.6
19527,133,000265,23585,241179,99437.212.025.2
19537,271,000262,75873,930188,82836.110.226.0
19547,528,000278,42076,092202,32837.010.126.9
19557,992,000299,85473,283226,57137.59.228.3
19568,426,000305,43064,807240,62336.37.728.6
19578,722,000326,76668,050258,71637.57.829.7
19589,077,000336,02062,680273,34037.06.930.1
19599,516,000349,79469,602280,19236.87.329.4
19609,996,000372,59565,667306,92837.26.630.7
196110,480,000377,78968,610309,17936.16.529.5
196210,958,000369,00270,952298,05033.76.527.2
196311,321,000346,08467,218278,86630.65.924.6
196411,610,000324,41266,197258,21527.95.722.2
196511,909,000314,53369,803244,73026.45.920.6
196612,185,000307,90569,402238,50325.35.719.6
196712,456,000301,71571,824229,89124.25.818.5
196812,694,000296,88273,496223,38623.45.817.6
196912,901,000297,12978,660218,46923.06.116.9
197013,106,000301,45177,619223,83223.05.917.1
197113,321,000317,42379,881237,54223.86.017.8
197213,534,000318,55185,122233,42923.56.317.2
197313,742,000321,07590,282230,79323.46.616.8
197413,955,000338,29193,582244,70924.26.717.5
197514,136,000343,668101,865241,80324.37.217.1
197614,279,000350,362103,892246,47024.57.317.3
197714,425,000349,379105,376244,00324.27.316.9
197814,589,000355,337107,293248,04424.47.417.0
197914,743,000354,320113,687240,63324.07.716.3
198014,884,000356,013119,078236,93523.98.015.9
198115,033,000367,950120,974246,97624.58.016.4
198215,185,000373,416120,165253,25124.67.916.7
198315,334,000378,577123,807254,77024.78.116.6
198415,481,000399,403129,796269,60725.88.417.43.04
198515,623,000396,929126,786270,14325.48.117.33.02
198615,776,000410,846119,149291,69726.07.618.53.13
198715,948,000417,139122,835294,30426.27.718.53.19
198816,188,000407,116126,898280,21825.37.917.43.13
198916,243,000382,269126,378255,89123.57.815.82.81
199016,328,000362,081128,576233,50522.27.914.32.72
199116,405,000353,174134,324218,85021.58.213.32.67
199216,439,000337,612137,518200,09420.58.412.22.62
199316,381,000315,482156,070159,41219.39.59.72.54
199416,146,000305,624160,339145,28518.99.99.02.43
199515,816,000276,125168,656107,46917.510.76.82.21
199615,578,000253,175166,02887,14716.310.75.62.02
199715,334,000232,356160,13872,21815.210.44.71.93
199815,072,000222,380154,31468,06614.810.24.51.81
199914,939,000217,578147,41670,16214.69.94.71.80
200014,883,626222,054149,77872,27614.910.14.91.88
200114,858,335221,487147,87673,61114.99.95.01.84
200214,858,948227,171149,38177,79015.310.15.21.88
200314,909,018247,946155,27792,66916.610.46.22.03
200415,012,985273,028152,250120,77818.210.18.12.21
200515,147,029278,977157,121121,85618.410.48.12.22
200615,308,084301,756157,210144,54619.710.39.42.36
200715,484,192321,963158,297163,66620.810.210.62.47
200815,674,000357,555152,878204,67722.89.813.02.68
200916,092,822356,261142,883213,37822.18.913.32.55
201016,321,872367,707146,027221,68022.59.013.62.59
201116,557,201372,690144,323228,36722.58.713.82.59
201216,792,089381,153143,411237,74222.78.514.22.62
201317,035,550387,256136,368250,88822.78.014.72.64
201417,288,285399,309132,287267,02223.17.715.52.73
201517,542,806398,458130,811267,64722.77.515.32.74
201617,794,055400,694131,231269,46322.57.415.22.77
201718,037,775390,262129,009261,25321.67.214.52.75
201818,276,452397,799130,448267,35121.87.114.62.84
201918,513,673402,310133,128269,18221.77.214.52.90
202018,755,665426,824161,333265,49122.88.614.23.13
202119,000,987446,491182,403264,08823.59.613.93.32
202219,634,983403,893133,523270,37020.66.813.83.05
202319,900,325388,428130,686257,74219.56.613.02.96

1Births and deaths until 1979 are estimates.

Current vital statistics

[24] [25]

PeriodLive birthsDeathsNatural increase
January - March 202393,50032,600+60,900
January - March 202491,85133,416+58,435
DifferenceDecrease2.svg -1,649Increase Negative.svg +816Steady2.svg -2,465

Total fertility rate

Total Fertility Rate of Kazakhstan by region (2021) Total Fertility Rate of Kazakhstan by region - 2021.svg
Total Fertility Rate of Kazakhstan by region (2021)

Total fertility rate by regions of Kazakhstan: Mangystau – 3.80, South Kazakhstan – 3.71, Kyzylorda – 3.42, Atyrau – 3.29, Jambyl – 3.20, Aqtobe – 2.70, Almaty (province) – 2.65, Almaty (city) – 2.65, City of Astana – 2.44, West Kazakhstan – 2.29, Aqmola – 2.19, East Kazakhstan – 2.07, Qaragandy – 2.04, Pavlodar – 1.98, North Kazakhstan – 1.72, Qostanay – 1.70, Republic of Kazakhstan – 2.65. Thus it can be seen that fertility rate is higher in more traditionalist and religious south and west, and lower in the north and east, where the percentage of Slavic and German population is still relatively high. [26] [27] [28]

According to the Kazakhstan Demographic and Health Survey in 1999, the TFR for Kazakhs was 2.5 and that for Russians was 1.38. TFR in 1989 for Kazakhs & Russians were 3.58 and 2.24 respectively. [29]

Total fertility rate per woman by ethnicity1989199519992000200120022003200420052006
Kazakh women3.583.112.502.122.112.142.302.522.542.73
Russian women2.241.691.381.181.171.211.301.361.351.38
Ukrainian women1.601.591.601.711.761.731.80
Uzbek women2.902.922.883.103.393.323.43

[30]

Life expectancy at birth

Life expectancy in Kazakhstan since 1868 Life expectancy in Kazakhstan.svg
Life expectancy in Kazakhstan since 1868
Life expectancy in Kazakhstan since 1960 by gender Life expectancy by WBG -Kazakhstan -diff.png
Life expectancy in Kazakhstan since 1960 by gender
PeriodLife expectancy in
Years
PeriodLife expectancy in
Years
1950–195555.11985–199067.5
1955–196057.31990–199565.5
1960–196559.51995–200063.0
1965–197061.72000–200564.6
1970–197563.32005–201066.0
1975–198064.32010–201569.1
1980–198565.9

Source: UN World Population Prospects [31]

Ethnic groups

The share of Kazakhs in Kazakhstan by districts at the beginning of 2022 Kazakhi v Kazakhstane.png
The share of Kazakhs in Kazakhstan by districts at the beginning of 2022
The share Russians by districts and cities of regional and republican subordination Kazakhstan in 2021 Russians in Kazakhstan Rus.png
The share Russians by districts and cities of regional and republican subordination Kazakhstan in 2021
Kazakhstan demographics 1897-1970. Major ethnic groups. Famines marked in dark. Kazakhstan demographics 1897-1970 en.png
Kazakhstan demographics 1897–1970. Major ethnic groups. Famines marked in dark.
Ethnic groups in Kazakhstan (2024) [32]
Ethnic groups
Kazakh
71.0%
Russian
14.9%
Uzbek
3.3%
Ukrainian
1.9%
Uyghur
1.5%
German
1.1%
Tatar
1.1%
Other
5.2%

Kazakhstan's dominant ethnic group, the Kazakhs, traces its origins to the 15th century, when after the disintegration of Golden Horde, numbers of Turkic and Turco-Mongol tribes united to establish the Kazakh Khanate. With a cohesive culture and national identity, they constituted an absolute majority on the land until colonization by the Russian empire.
Russian advances into the territory of Kazakhstan began in the late 18th century, when the Kazakhs nominally accepted Russian rule in exchange for protection against repeated attacks by the western Mongolian Kalmyks. In the 1890s, Russian peasants began to settle on the fertile lands of northern Kazakhstan, causing many Kazakhs to move eastwards into Chinese territory in search of new grazing grounds. The 1906 completion of the Trans-Aral Railway between Orenburg and Tashkent further facilitated Russian colonization. [33] [34]

The first collective farms were formed in Kazakhstan in 1921, populated primarily by Russians and Soviet deportees. In 1930, as part of the first Five Year Plan, the Kazakh Central Committee decreed the sedentarization of nomads and their incorporation into collectivized farms. This movement resulted in devastating famines, claiming the lives of an estimated 40% of ethnic Kazakhs (1.5 million), between 1930 and 1933. [35] Hundreds of thousands also fled to China, Iran and Afghanistan. The famine made Kazakhs a minority of the population of Kazakhstan, and only after the republic gained independence in 1991 did Kazakhs have a slim demographic majority within Kazakhstan. [33]

Demographics did shift in the 1950s and 1960s, when, as part of Nikita Khrushchev's Virgin Lands Campaign, hundreds of thousands of Soviet citizens relocated to the Kazakh steppes in order to farm. As recognized in the 1959 census, the Kazaks became the second-largest ethnic group in Kazakhstan for the first time in recorded history, comprising just 30% of the total population of Kazakhstan. Russians numbered 42.7%. [36]

Since the Soviet Union's collapse, the numbers of members of European ethnic groups has been falling and Asian groups have been continuously rising. According to 2023 estimates, the ethnic composition of Kazakhstan was approximately: 70.7% Kazakh, 15.2% Russian, 3.3% Uzbek, 1.9% Ukrainian, 1.5% Uyghur, 1.1% Tatar, 1.1% German, and <1% Korean, Turkish, Azerbaijani, Belarusian, Dungan, Kurdish, Tajik, Polish, Kyrgyz, Chechen. [32]

Population of Kazakhstan according to ethnic group 1897–1999
Ethnic
group
census 18971census 19262census 19393census 19594census 19705census 19796census 19897census 19998
Number %Number %Number %Number %Number %Number %Number %Number %
Kazakhs 3,392,75182.93,627,61258.52,327,62537.82,794,96630.04,161,16432.45,289,34936.06,534,61639.78,011,45253.5
Russians 454,40211.11,275,05520.62,458,68740.03,974,22942.75,499,82642.85,991,20540.86,227,54937.84,480,67529.9
Uzbeks 29,5641.3129,4072.1120,6552.0136,5701.5207,5141.6263,2951.8332,0172.0370,7652.5
Ukrainians 860,20113.9658,31910.7762,1318.2930,1587.2897,9646.1896,2405.4547,0653,7
Uygurs 11,6310.235,4090.659,8400.6120,7840.9147,9431.0185,3011.1210,3771.4
Tatars 55,9841.179,7581.3108,1271.8191,8022.1281,8492.2312,6262.1327,9822.0249,0521,7
Germans 51,0940.892,5711.5659,8007.1839,6496.5900,2076.1957,5185.8353,4622,4
Koreans 420.096,4531.674,0190.878,0780.691,9840.6103,3150.699,9440.7
Turks 460.05230.09,9160.118,3970.125,8200.249,5670.375,9500.5
Azerbaijanis 200.012,9960.238,3620.456,1660.473,3450.590,0830.578,3250.5
Belarusians 25,5840.431,6140.5107,4631.2197,5921.5181,4911.2182,6011.1111,9240.7
Poles 3,7420.154,8090.953,1020.661,3550.561,1360.459,9560.447,3020.3
Chechens 30.02,6390.0130,2321.434,4920.338,2560.349,5070.331,8020.2
Dungans 8,4550.17,4150.19,9800.117,2830.122,4910.230,1650.236,9450.2
Tajiks 7,5990.111,2290.28,0750.17,1660.119,2930.125,5140.225,6730.2
Kurds 2,3870.06,1090.112,2990.117,6920.125,4250.232,7640.2
Kyrgyz 10,2000.25,0330.16,8100.19,4740.19,3520.114,1120.110,9250.1
Others108,0161.7124,6112.0286,4413.1315,3472.5340,8342.3372,9962.3206,8791,4
Total6,198,4656,151,1029,309,84712,848,57314,684,28316,464,46414,981,281
1 Excluding the Kara-Kalpak AO; source: [37] 2 Source:. [38] 3 Source:. [39] 4 Source:. [40] 5 Source:. [41] 6 Source:. [42] 7 Source: [43]
Population of Kazakhstan according to ethnic group 2009–2024
Ethnic
group
census 20098census 20219estimate 202410
Number %Number %Number %
Kazakhs 10,096,76363.113,497,89170.414,220,32171.0
Russians 3,793,76423.72,981,94615.52,983,31714.9
Uzbeks 456,9972.9614,0473.2660,5643.3
Ukrainians 333,0312.1387,3272.0375,9141.9
Uygurs 224,7131.4290,3371.5301,5841.5
Germans 178,4091.1226,0921.2224,3431.1
Tatars 204,2291.3197,4891.0219,2011.1
Azerbaijanis 85,2920.5145,6150.8152,8470.8
Koreans 100,3850.6107,5690.6120,2620.6
Turks 97,0150.685,4780.590,0150.4
Dungans 51,9440.378,8170.483,9480.4
Belarusians 66,4760.476,4840.475,0480.4
Tajiks 36,2770.249,8270.355,8730.3
Kurds 38,3250.247,8800.350,2640.3
Poles 34,0570.235,3190.234,5690.2
Kyrgyz 23,2740.234,1840.238,5960.2
Chechens 31,4310.233,5570.234,6980.2
Others157,2151.0285,2751.5312,4781.6
Total16,009,59719,186,01520,033,842
8 Source: 9 Source: [44] 10 Source: [32]

Religion

Religion in Kazakhstan, 2021 [45] [46]
Islam
69.3%
Christianity
17.2%
No Response
11.01%
Atheism
2.25%
Other religions
0.2%

See also

Related Research Articles

<span class="mw-page-title-main">Demographics of Kyrgyzstan</span>

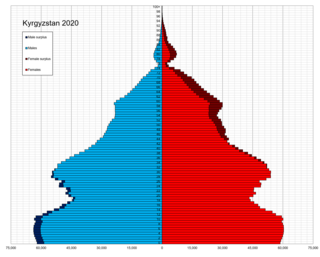
The Demographics of Kyrgyzstan is about the demographic features of the population of Kyrgyzstan, including population growth, population density, ethnicity, education level, health, economic status, religious affiliations, and other aspects of the population. The name Kyrgyz, both for the people and the country, means "forty tribes", a reference to the epic hero Manas who unified forty tribes against the Oirats, as symbolized by the 40-ray sun on the flag of Kyrgyzstan.

<span class="mw-page-title-main">Demographics of Latvia</span>

Demographic features of the population of the historical territory of Latvia include population density, ethnic background, education level, health of the populace, economic status, religious affiliations and other aspects of the population.

<span class="mw-page-title-main">1989 Soviet census</span> Last census to take place in the USSR

The 1989 Soviet census, conducted between 12 and 19 January of that year, was the final census carried out in the Soviet Union. The census found the total population to be 286,730,819 inhabitants. In 1989, the Soviet Union ranked as the third most populous in the world, above the United States, although it was well below China and India.

<span class="mw-page-title-main">Demographics of Saint Petersburg</span>

Saint Petersburg is the second largest city in Russia, after Moscow and the fourth most populous city in Europe.

Turks in Ukraine are people of Turkish ethnicity living in Ukraine. The first Turkish settlement started during the Ottoman rule of Ukraine. In addition, there has been modern migration to the country largely formed of Meskhetian Turks, followed by immigrants from Turkey and Turkish communities from other post-Ottoman territories, such as Turkish Cypriots from Northern Cyprus.

The Chechen diaspora is a term used to collectively describe the communities of Chechen people who live outside of Chechnya; this includes Chechens who live in other parts of Russia. There are also significant Chechen populations in other subdivisions of Russia.

<span class="mw-page-title-main">Turks in Kazakhstan</span> Ethnic Turks live in Kazakhstan

Turks in Kazakhstan are ethnic Turks who live in Kazakhstan, mostly from Meskheti after the Deportation of the Meskhetian Turks.

Turks in Uzbekistan are ethnic Turks who live in Uzbekistan.

<span class="mw-page-title-main">Kurds in Azerbaijan</span> Ethnic group

The Kurds in Azerbaijan form a part of the historically significant Kurdish population in the post-Soviet space. Kurds established a presence in the Caucasus with the establishment of the Kurdish Shaddadid dynasty in the 10th and 11th centuries. Some Kurdish tribes were recorded in Karabakh by the end of the sixteenth century. However, virtually the entire contemporary Kurdish population in the modern Azerbaijan descends from migrants from 19th-century Qajar Iran.

Turks in the former Soviet Union were a relatively small minority within the Soviet Union when excluding Turks of Azerbaijan, Oguz Turks and other Turkish groups. However, their presence is considered important within Turkology due to the deportation of thousands of Turks from their home countries. Under the Ottoman Empire, Samtskhe-Javakheti was heavily Islamised producing a Turkish ethnicity within the southwestern region of Georgia. In November 1944, up to 120,000 of these Turks were deported to Central Asia under the rule of Joseph Stalin.

Ingiloys are an ethnographic subgroup of Georgians who speak the Ingiloy dialect of Georgian. Ingiloys are indigenous to Saingilo, a cultural and historical region located in the northwest of present-day Azerbaijan.

<span class="mw-page-title-main">Russians in Azerbaijan</span> Ethnic group in Azerbaijan

Russians in Azerbaijan are the second largest ethnic minority in Azerbaijan and is also the largest Russian community in the South Caucasus and one of the largest outside of Russia. Although in decline, the community still numbers 71,000 people as of 2019. Since their arrival at the beginning of the 19th century, the Russians have played an important role in all spheres of life, particularly during the Czarist and Soviet period, especially in the capital city of Baku.

<span class="mw-page-title-main">Kurds in Georgia</span> Ethnic group in Georgia

The Kurds in Georgia form a major part of the historically significant Kurdish population in the post-Soviet space, and are members of the eponymous ethnic group that are citizens of Georgia. In the 20th century, most Kurds fled religious persecution in the Ottoman Empire to the Russian Empire. The return of their Kurdish surnames needs effort according to a Kurdish activist in Georgia. The Kurds also have their own schools, school books and a printing press in Georgia. Illiteracy among them disappeared in the early 1900s. Kurds in Georgia are politically neutral; however, in 1999 they staged a huge demonstration in Tbilisi, demanding the release of the founder of the Kurdistan Workers' Party, Abdullah Öcalan. Kurds in Georgia today use Cyrillic script. Earlier, in the 1920s, they used the Latin script.

Armenians in the Baltic states of Estonia, Latvia, and Lithuania settled there mostly during the Soviet occupation of the Baltic States, although some of the first settlers arrived during the Russian Empire's rule in the Baltics.

<span class="mw-page-title-main">Kurds in Russia</span> Ethnic group in Russia

Kurds in Russia form a major part of the historically significant Kurdish population in the post-Soviet space, with close ties to the Kurdish communities in the Caucasus and Central Asia.

<span class="mw-page-title-main">Kurds in Turkmenistan</span> Ethnic group in Turkmenistan

The Kurds in Turkmenistan form a part of the historically significant Kurdish population in the post-Soviet space, and encompass people born in or residing in Turkmenistan who are of Kurdish origin. In the 17th century, Abbas I of Persia and Nader Shah settled Kurdish tribes from Khuzestan alongside the Iranian-Turkmen border. More Kurds arrived to Turkmenistan in the 19th century to find unclaimed land and to escape starvation.

Azerbaijanis in Kazakhstan are part of the Azerbaijani diaspora. They are Kazakh citizens and permanent residents of ethnic Azerbaijani background. According to the 2009 census, there were 85,292 ethnic Azerbaijanis living in Kazakhstan; Azerbaijanis comprised 0.5% of Kazakhstan's population and were the country's tenth-largest ethnic minority.

Tatars in Azerbaijan are Azerbaijani citizens and people of Tatar origin. According to the 2009 census, 25,882 Tatars live in the Republic of Azerbaijan. This is 0.29% of the total population.

Accurate or reliable data for historical populations of Armenians is scarce, but scholars and institutions have proposed estimates for different periods.

<span class="mw-page-title-main">1939 Soviet census</span> 1939 Census in the Soviet Union

The 1939 Soviet census, conducted from January 17 to January 26, succeeded the 1937 Soviet census that was declared invalid. It happened only two years after the previous census, due to the failure of the preceding one.

References

  1. "Agency for Strategic planning and reforms of the Republic of Kazakhstan Bureau of National statistics - Main". stat.gov.kz. Retrieved 2023-07-02.
  2. "World Bank Open Data". World Bank Open Data. Retrieved 2023-07-13.
  3. "Spreadsheets - Agency for Strategic planning and reforms of the Republic of Kazakhstan Bureau of National statistics". stat.gov.kz. Retrieved 2023-07-13.
  4. Schreiber, Dagmar and Tredinnick, Jeremy. Kazakhstan. Odyssey Publications, 2010, p. 82.
  5. "Kazakhstan". U.S. Department of State. Retrieved 18 March 2015.
  6. UK Foreign and Commonwealth Office, Kazakhstan, 2 Feb 2011 Archived 6 October 2011 at the Wayback Machine .
  7. "News & featured articles". Archived from the original on 16 March 2015. Retrieved 18 March 2015.
  8. Ambassador Erlan A Idissov, Embassy of the Republic of Kazakhstan to the USA.
  9. Division, United Nations Population. "Total population by sex: Kazakhstan". Population Division Data Portal. Retrieved 2023-05-21.
  10. "2017 жылдың басынан 2018 жылдың 1 қаңтарына дейінгі Қазақстан Республикасы халық санының өзгеруі туралы". Archived from the original on 2018-11-24. Retrieved 2018-02-12., Statistical Agency of the Republic of Kazakhstan (in Russian)
  11. September 2021, Saniya Bulatkulova in Nation on 8 (2021-09-08). "7 out of 10 People in Kazakhstan Are Expected to Live in Cities By 2050, According to UN". The Astana Times. Retrieved 2021-12-10.{{cite web}}: CS1 maint: numeric names: authors list (link)
  12. 1 2 Population dynamics and ethnic composition of Kazakhstan in the second half of the 20th century, Demoscope Weekly, No. 103-104, 3–16 March 2003 (in Russian)
  13. 1 2 Statistical Yearbook of Kazakhstan, Almaty, various years since 1980 (in Russian)
  14. 1 2 Population and social policy Archived 2009-07-13 at the Wayback Machine , Statistical Agency of the Republic of Kazakhstan (in Russian)
  15. Statistical Agency of the Republic of Kazakhstan (in Russian)
  16. CIA Factbook (Kazakhstan) Retrieved on May 2, 2008
  17. "World DataBank>World Development Indicators". databank.worldbank.org. Retrieved 31 January 2017.
  18. "UNSD — Demographic and Social Statistics".
  19. "stat.gov.kz". Archived from the original on 2021-05-13. Retrieved 2021-05-12.
  20. "Demographic Yearbook". United Nations Statistics Division .[ not specific enough to verify ]
  21. "Халық". Archived from the original on 14 January 2015. Retrieved 18 March 2015.
  22. Естественное движение населения республик СССР, 1935 [Natural population growth of the Republics of the USSR, 1935] (in Russian). Demoscope.ru. Archived from the original on 2 April 2015. Retrieved 31 March 2015.
  23. "О демографической ситуации в Республике Казахстан". www.stat.gov.kz. Archived from the original on 2017-08-16. Retrieved 2017-08-16.
  24. "Bureau of National Statistics".
  25. "Bureau of National Statistics".
  26. "Население". Archived from the original on 2009-07-13. Retrieved 2009-07-28.
  27. Spoorenberg, Thomas (2013). "Fertility changes in Central Asia since 1980". Asian Population Studies. 9 (1): 50–77. doi:10.1080/17441730.2012.752238. S2CID   154532617.
  28. Spoorenberg, Thomas (2015). "Explaining recent fertility increase in Central Asia". Asian Population Studies. 11 (2): 115–133. doi:10.1080/17441730.2015.1027275. S2CID   153924060.
  29. "Kazakhstan: Demographic and Health Survey, 1999 – Final Report, Chapter 4: Fertility" (PDF).
  30. "ETHNIC DIFFERENTIATION OF FERTILITY IN KAZAKHSTAN" (PDF).
  31. "World Population Prospects – Population Division – United Nations". Archived from the original on 2016-09-19. Retrieved 2017-07-15.
  32. 1 2 3 "Қазақстан Республикасы халқының жекелеген этностары бойынша саны" [Population of Kazakhstan by ethnic group] (in Kazakh).
  33. 1 2 Olcott, M. B. (1995). The Kazakhs. Stanford, California: Stanford University Press.
  34. Pierce, A. R. (1960) Russian Central Asia, 1867–1917: A study in colonial rule. Berkeley: University of California Press.
  35. Pianciola, N. (2001). The collectivization famine in Kazakhstan, 1931–1933. Harvard Ukrainian Studies, 25(3/4), 237–251. Retrieved from https://www.jstor.org/stable/41036834
  36. Zardykhan, Z. (2004). Russians in Kazakhstan and demographic change: Imperial legacy and the Kazakh way of nation building. Asian Ethnicity, 5(1), 61–79.
  37. "Всесоюзная перепись населения 1926 года. Национальный состав населения по регионам РСФСР" [All-Union census of the population of 1926. National composition of the population by regions of the RSFSR.]. Retrieved 18 March 2015.
  38. "Всесоюзная перепись населения 1939 года. Национальный состав населения по республикам СССР" [All-Union census of the population of 1939. National composition of the population by republics of the USSR]. Retrieved 18 March 2015.
  39. "Всесоюзная перепись населения 1959 года. Национальный состав населения по республикам СССР" [All-Union population census of 1959. National composition of the population by republics of the USSR]. Retrieved 18 March 2015.
  40. "Всесоюзная перепись населения 1970 года. Национальный состав населения по республикам СССР" [All-Union population census of 1970. National composition of the population by republics of the USSR]. Retrieved 18 March 2015.
  41. "Всесоюзная перепись населения 1979 года. Национальный состав населения по республикам СССР" [All-Union population census of 1979. National composition of the population by republics of the USSR]. Retrieved 18 March 2015.
  42. "Всесоюзная перепись населения 1989 года. Национальный состав населения по республикам СССР" [All-Union population census of 1989. National composition of the population by republics of the USSR]. Retrieved 18 March 2015.
  43. http://www.stat.kz/p_perepis/Documents/Перепись%20рус.pdf [ dead link ]
  44. "2021 жылғы Қазақстан Республикасы халқының ұлттық санағының қорытындылары" [Results of the 2021 national census of the Republic of Kazakhstan]. Archived from the original on 2022-09-02. Retrieved 2022-10-17.
  45. "2021 жылғы Қазақстан Республикасы халқының ұлттық санағының қорытындылары" [Results of the 2021 Population Census of the Republic of Kazakhstan] (in Kazakh). Agency of Strategic Planning and Reforms of the Republic of Kazakhstan National Bureau of Statistics. Archived from the original on 2 September 2022. Retrieved 19 September 2022.
  46. "How the Number of Believers Changed in Kazakhstan". 30 November 2022.

Bibliography

For current data, use these sites.