List of countries by seafood consumption

Last updated

World map of fish and seafood consumption Fish-and-seafood-consumption-per-capita-map.svg
World map of fish and seafood consumption
Historical development of seafood consumption Fish-and-seafood-consumption-per-capita-historical.svg
Historical development of seafood consumption

The List of countries by seafood consumption gives a comprehensive overview that ranks nations worldwide based on their annual seafood consumption per capita. Seafood includes fish and other important marine animals. While the List of countries by meat consumption correlates strongly with indicators like GDP per capita, this correlation is less intense with seafood consumption. Seafood plays a vital role in some poorer states, serving as a significant source of protein and essential nutrients. [1] Please note that the data presented here is based on the most recently available information, and consumption patterns may evolve.

Seafood consumption by country

Countries (some territories like Hong Kong are also included) are ranked by the available per capita supply of fish and other seafood at the consumer level. It does not account for food loss and waste at the consumer level (like in gastronomy or in households). [2]

Countries by seafood consumption per capita
RankCountryConsumption in kg/person (2020)
1Flag of Maldives.svg  Maldives 87.30
2Flag of Iceland.svg  Iceland 84.30
3Flag of Macau.svg  Macau 70.26
4Flag of Kiribati.svg  Kiribati 69.22
5Flag of Hong Kong.svg  Hong Kong 65.79
6Flag of Portugal.svg  Portugal 59.36
7Flag of Antigua and Barbuda.svg  Antigua and Barbuda 57.12
8Flag of South Korea.svg  South Korea 54.66
9Flag of Malaysia 23px.svg  Malaysia 53.33
10Flag of Seychelles.svg  Seychelles 52.89
11Flag of Norway.svg  Norway 50.57
12Flag of the Federated States of Micronesia.svg  Federated States of Micronesia 48.61
13Flag of Japan.svg  Japan 46.65
14Flag of Cambodia.svg  Cambodia 46.65
15Flag of Myanmar.svg  Myanmar 45.85
16Flag of Nauru.svg  Nauru 44.75
17Flag of Indonesia.svg  Indonesia 44.71
18Flag of Samoa.svg  Samoa 43.97
19Flag of French Polynesia.svg  French Polynesia 43.95
20Flag of Barbados.svg  Barbados 43.88
21Flag of Saint Kitts and Nevis.svg  Saint Kitts and Nevis 43.35
22Flag of the People's Republic of China.svg  China 40.33
23Flag of Spain.svg  Spain 40.30
24Flag of Vietnam.svg  Vietnam 39.84
25Flag of Saint Lucia.svg  Saint Lucia 34.44
26Flag of France.svg  France 33.64
27Flag of Finland.svg  Finland 33.52
28Flag of Lithuania.svg  Lithuania 31.89
29Flag of Luxembourg.svg  Luxembourg 31.47
30Flag of Sweden.svg  Sweden 31.34
31Flag of Grenada.svg  Grenada 30.78
32Flag of the Republic of China.svg  Taiwan 29.75
33Flag of Italy.svg  Italy 29.64
34Flag of Oman.svg  Oman 29.30
35Flag of Fiji.svg  Fiji 28.89
36Flag of Sri Lanka.svg  Sri Lanka 28.57
37Flag of Vanuatu.svg  Vanuatu 28.57
38Flag of Thailand.svg  Thailand 28.48
39Flag of the Philippines.svg  Philippines 28.39
40Flag of the Solomon Islands.svg  Solomon Islands 27.88
41Flag of Gabon.svg  Gabon 27.86
42Flag of Dominica.svg  Dominica 27.85
43Flag of Sao Tome and Principe.svg  São Tomé and Príncipe 27.71
44Flag of the United Arab Emirates.svg  United Arab Emirates 27.02
45Flag of Peru.svg  Peru 26.83
46Flag of Jamaica.svg  Jamaica 26.42
47Flag of Denmark.svg  Denmark 26.30
48Flag of Bangladesh.svg  Bangladesh 26.27
49Flag of Egypt.svg  Egypt 25.80
50Flag of New Zealand.svg  New Zealand 25.15
51Flag of Latvia.svg  Latvia 24.87
52Flag of Cyprus.svg  Cyprus 24.86
53Flag of Sierra Leone.svg  Sierra Leone 24.70
54Flag of Guyana.svg  Guyana 24.64
55Flag of Israel.svg  Israel 24.43
56Flag of Ghana.svg  Ghana 24.08
57Flag of Laos.svg  Laos 24.01
58Flag of Australia (converted).svg  Australia 23.94
59Flag of the Republic of the Congo.svg  Republic of the Congo 23.67
60Flag of The Gambia.svg  Gambia 23.64
61Flag of Mauritius.svg  Mauritius 23.51
62Flag of the Bahamas.svg  Bahamas 23.42
63Flags of New Caledonia.svg  New Caledonia 23.34
64Flag of Cote d'Ivoire.svg  Ivory Coast 22.80
65Flag of Belgium (civil).svg  Belgium 22.75
66Flag of Ireland.svg  Ireland 22.52
67Flag of the United States (23px).png  United States 22.45
68Flag of Qatar.svg  Qatar 21.98
69Flag of Russia.svg  Russia 21.76
70Flag of Trinidad and Tobago.svg  Trinidad and Tobago 21.75
71Flag of Greece.svg  Greece 21.54
72Flag of the Netherlands.svg  Netherlands 21.48
73Flag of Canada (Pantone).svg  Canada 20.65
74Flag of Saint Vincent and the Grenadines.svg  Saint Vincent and the Grenadines 20.59
75Flag of Malta.svg  Malta 19.57
76Flag of Cameroon.svg  Cameroon 19.18
77Flag of Croatia.svg  Croatia 19.14
78Flag of Bahrain.svg  Bahrain 18.75
79Flag of Morocco.svg  Morocco 18.48
80Flag of the United Kingdom.svg  United Kingdom 18.13
81Flag of Costa Rica.svg  Costa Rica 17.85
82Flag of Switzerland (Pantone).svg  Switzerland 16.03
83Flag of Suriname.svg  Suriname 15.94
84Flag of Montenegro.svg  Montenegro 15.56
85Flag of Benin.svg  Benin 15.55
86Flag of the Comoros.svg  Comoros 15.44
87Flag of Moldova.svg  Moldova 15.25
88Flag of Uganda.svg  Uganda 14.77
89Flag of Libya.svg  Libya 14.73
90Flag of Chile.svg  Chile 14.63
91Flag of Estonia.svg  Estonia 14.62
92Flag of Austria.svg  Austria 14.45
93Flag of Mexico.svg  Mexico 13.95
94Flag of Angola.svg  Angola 13.90
95Flag of Panama.svg  Panama 13.74
96Flag of Ukraine.svg  Ukraine 13.70
97Flag of Kuwait.svg  Kuwait 13.69
98Flag of Tunisia.svg  Tunisia 13.65
99Flag of Mozambique.svg  Mozambique 13.46
100Flag of Papua New Guinea.svg  Papua New Guinea 13.41
101Flag of Belize.svg  Belize 13.35
102Flag of Slovenia.svg  Slovenia 12.97
103Flag of Zambia.svg  Zambia 12.68
104Flag of Germany.svg  Germany 12.66
105Flag of Poland.svg  Poland 12.27
106Flag of Iran.svg  Iran 12.14
107Flag of Senegal.svg  Senegal 12.12
108Flag of Namibia.svg  Namibia 12.11
109Flag of Belarus.svg  Belarus 11.62
110Flag of Togo.svg  Togo 11.46
111Flag of Saudi Arabia.svg  Saudi Arabia 11.35
112Flag of North Korea.svg  North Korea 10.96
113Flag of the Czech Republic.svg  Czech Republic 10.64
114Flag of Georgia.svg  Georgia 10.61
115Flag of Lebanon.svg  Lebanon 10.51
116Flag of Cape Verde.svg  Cape Verde 10.31
117Flag of Slovakia.svg  Slovakia 10.21
118Flag of Venezuela.svg  Venezuela 10.18
119Flag of Malawi.svg  Malawi 10.01
120Flag of Guinea.svg  Guinea 9.65
121Flag of Uruguay.svg  Uruguay 9.26
122Flag of Colombia.svg  Colombia 8.88
123Flag of Mauritania.svg  Mauritania 8.72
124Flag of Albania.svg  Albania 8.68
125Flag of Burkina Faso.svg  Burkina Faso 8.66
126Flag of the Dominican Republic.svg  Dominican Republic 8.37
127Flag of Ecuador.svg  Ecuador 8.25
128Flag of Romania.svg  Romania 8.23
129Flag of Mali.svg  Mali 8.15
130Flag of Brazil.svg  Brazil 8.06
131Flag of Serbia.svg  Serbia 7.96
132Flag of India.svg  India 7.89
133Flag of Bulgaria.svg  Bulgaria 7.33
134Flag of Bhutan.svg  Bhutan 7.31
135Flag of Bosnia and Herzegovina.svg  Bosnia and Herzegovina 7.19
136Flag of Argentina.svg  Argentina 6.80
137Flag of El Salvador.svg  El Salvador 6.74
138Flag of Nigeria.svg  Nigeria 6.68
139Flag of the Central African Republic.svg  Central African Republic 6.66
140Flag of South Africa.svg  South Africa 6.52
141Flag of Chad.svg  Chad 6.51
142Flag of East Timor.svg  Timor-Leste 6.51
143Flag of Nicaragua.svg  Nicaragua 6.50
144Flag of Hungary.svg  Hungary 6.29
145Flag of Tanzania.svg  Tanzania 6.23
146Flag of North Macedonia.svg  North Macedonia 6.13
147Flag of Cuba.svg  Cuba 6.07
148Flag of Armenia.svg  Armenia 5.79
149Flag of Turkey.svg  Turkey 5.53
150Flag of Haiti.svg  Haiti 5.03
151Flag of Jordan.svg  Jordan 4.79
152Flag of Rwanda.svg  Rwanda 4.49
153Flag of Paraguay.svg  Paraguay 4.32
154Flag of Liberia 23px.svg  Liberia 4.27
155Flag of Eswatini.svg  Eswatini 4.21
156Flag of Uzbekistan.svg  Uzbekistan 4.02
157Flag of the Democratic Republic of the Congo.svg  Democratic Republic of the Congo 4.02
158Flag of Madagascar.svg  Madagascar 3.89
159Flag of Algeria.svg  Algeria 3.81
160Flag of Nepal.svg  Nepal 3.49
161Flag of Djibouti.svg  Djibouti 3.19
162Flag of South Sudan.svg  South Sudan 3.08
163Flag of Guatemala.svg  Guatemala 3.07
164Flag of Kenya.svg  Kenya 2.98
165Flag of Iraq.svg  Iraq 2.92
166Flag of Lesotho.svg  Lesotho 2.85
167Flag of Zimbabwe.svg  Zimbabwe 2.82
168Bandera de Bolivia (Estado).svg  Bolivia 2.74
169Flag of Yemen.svg  Yemen 2.73
170Flag of Kazakhstan.svg  Kazakhstan 2.73
171Flag of Turkmenistan.svg  Turkmenistan 2.71
172Flag of Burundi.svg  Burundi 2.53
173Flag of Honduras.svg  Honduras 2.53
174Flag of Botswana.svg  Botswana 2.39
175Flag of Azerbaijan.svg  Azerbaijan 2.01
176Flag of Niger.svg  Niger 1.85
177Flag of Syria.svg  Syria 1.84
178Flag of Pakistan.svg  Pakistan 1.58
179Flag of Guinea-Bissau.svg  Guinea-Bissau 1.14
180Flag of Sudan.svg  Sudan 1.12
181Flag of Kyrgyzstan (2023).svg  Kyrgyzstan 1.10
182Flag of Tajikistan.svg  Tajikistan 0.66
183Flag of Mongolia.svg  Mongolia 0.57
184Flag of Ethiopia.svg  Ethiopia 0.53
185Flag of the Taliban.svg  Afghanistan 0.36

Related Research Articles

<span class="mw-page-title-main">Seafood</span> Food from the sea

Seafood is any form of sea life regarded as food by humans, prominently including fish and shellfish. Shellfish include various species of molluscs (e.g., bivalve molluscs such as clams, oysters, and mussels.

Purchasing power parity (PPP) is a measure of the price of specific goods in different countries and is used to compare the absolute purchasing power of the countries' currencies. PPP is effectively the ratio of the price of a market basket at one location divided by the price of the basket of goods at a different location. The PPP inflation and exchange rate may differ from the market exchange rate because of tariffs, and other transaction costs.

The ecological footprint measures human demand on natural capital, i.e. the quantity of nature it takes to support people and their economies. It tracks human demand on nature through an ecological accounting system. The accounts contrast the biologically productive area people use to satisfy their consumption to the biologically productive area available within a region, nation, or the world (biocapacity). Biocapacity is the productive area that can regenerate what people demand from nature. Therefore, the metric is a measure of human impact on the environment. As Ecological Footprint accounts measure to what extent human activities operate within the means of our planet, they are a central metric for sustainability.

<span class="mw-page-title-main">Fishery</span> Raising or harvesting fish

Fishery can mean either the enterprise of raising or harvesting fish and other aquatic life or, more commonly, the site where such enterprise takes place. Commercial fisheries include wild fisheries and fish farms, both in freshwater waterbodies and the oceans. About 500 million people worldwide are economically dependent on fisheries. 171 million tonnes of fish were produced in 2016, but overfishing is an increasing problem, causing declines in some populations.

<span class="mw-page-title-main">Fishing industry</span> Economic branch

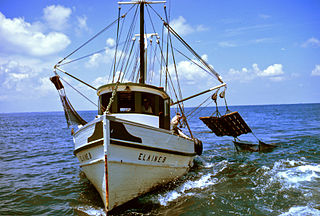
The fishing industry includes any industry or activity that takes, cultures, processes, preserves, stores, transports, markets or sells fish or fish products. It is defined by the Food and Agriculture Organization as including recreational, subsistence and commercial fishing, as well as the related harvesting, processing, and marketing sectors. The commercial activity is aimed at the delivery of fish and other seafood products for human consumption or as input factors in other industrial processes. The livelihood of over 500 million people in developing countries depends directly or indirectly on fisheries and aquaculture.

<span class="mw-page-title-main">Orange roughy</span> Species of fish

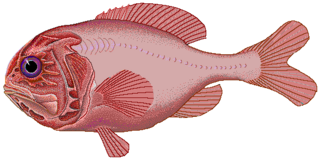
The orange roughy, also known as the red roughy, slimehead and deep sea perch, is a relatively large deep-sea fish belonging to the slimehead family (Trachichthyidae). The UK Marine Conservation Society has categorized orange roughy as "vulnerable to exploitation". It is bathypelagic, found in cold, deep waters of the Western Pacific Ocean, eastern Atlantic Ocean, Indo-Pacific, and in the eastern Pacific off Chile. The orange roughy is notable for its extraordinary lifespan, attaining over 200 years. It is important to commercial deep-trawl fisheries. The fish is a bright, brick-red color, fading to a yellowish-orange after death.

<span class="mw-page-title-main">Energy intensity</span> Measure of an economys energy inefficiency

Energy intensity is a measure of the energy inefficiency of an economy. It is calculated as units of energy per unit of GDP or some other measure of economic output. High energy intensities indicate a high price or cost of converting energy into GDP. On the other hand, Low energy intensity indicates a lower price or cost of converting energy into GDP.

<span class="mw-page-title-main">Carbon footprint</span> Concept to quantify greenhouse gas emissions from activities or products

A carbon footprint (or greenhouse gas footprint) is a calculated value or index that makes it possible to compare the total amount of greenhouse gases that an activity, product, company or country adds to the atmosphere. Carbon footprints are usually reported in tonnes of emissions (CO2-equivalent) per unit of comparison. Such units can be for example tonnes CO2-eq per year, per kilogram of protein for consumption, per kilometer travelled, per piece of clothing and so forth. A product's carbon footprint includes the emissions for the entire life cycle. These run from the production along the supply chain to its final consumption and disposal.

<span class="mw-page-title-main">Fish as food</span> Fish eaten by humans

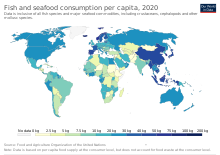
Many species of fish are caught by humans and consumed as food in virtually all regions around the world. Fish has been an important dietary source of protein and other nutrients.

<span class="mw-page-title-main">Fish factory</span> Facility where fish processing is performed

A fish factory, also known as a fish plant orfish processing facility, is a facility in which fish processing is performed. They are commonly located near bodies of water but can be located inland and on fishing vessels. The availability and variety of fish influences the scale of fish factories and the processing methods they utilize. The modernization of these facilities has promoted the use of machinery to increase production speed in order to meet the increasing global demand. Heightened demand has led to the increased production of fish and fish products which after processed result in large quantities of pollutants namely fish waste. Fish factories are held accountable for their product quality and are subject to a variety of health and safety regulations. Most regulations applicable to fish factories are limited, there are no universal regulations. Byproduct recovery is a method of waste mitigation that utilizes the waste produced by fish factories to produce other products and reduce the percentage of a fish's overall weight that becomes waste.

Sustainable seafood is seafood that is caught or farmed in ways that consider the long-term vitality of harvested species and the well-being of the oceans, as well as the livelihoods of fisheries-dependent communities. It was first promoted through the sustainable seafood movement which began in the 1990s. This operation highlights overfishing and environmentally destructive fishing methods. Through a number of initiatives, the movement has increased awareness and raised concerns over the way our seafood is obtained.

<span class="mw-page-title-main">Mercury in fish</span>

The presence of mercury in fish is a health concern for people who eat them, especially for women who are or may become pregnant, nursing mothers, and young children. Fish and shellfish concentrate mercury in their bodies, often in the form of methylmercury, a highly toxic organomercury compound. This element is known to bioaccumulate in humans, so bioaccumulation in seafood carries over into human populations, where it can result in mercury poisoning. Mercury is dangerous to both natural ecosystems and humans because it is a metal known to be highly toxic, especially due to its neurotoxic ability to damage the central nervous system.

Seafood in Australia comes from local and international commercial fisheries, aquaculture and recreational anglers. It is an economically important sector, and along with agriculture and forestry contributed $24,744 million to Australia's GDP in year 2007–2008, out of a total GDP of $1,084,146 million. Commercial fisheries in Commonwealth waters are managed by the Australian Fisheries Management Authority, while commercial and recreational fishing in state waters is managed by various state-level agencies.

Dietary exposure assessments in the United States involve the evaluation of dietary consumption and chemical residue data while taking into consideration additional factors that may affect a specified population of interest or sensitive population. The process of conducting a dietary exposure assessment involves the determination of the chemical residues on a particular food or foods and the calculation of the dietary exposure to these chemicals based on consumption data for the specified food or foods. A dietary exposure assessment allows a comparison to a relevant health standard such as the acceptable daily intake(ADI), the acute reference dose.

<i>Surimi</i> Meat paste, usually made from fish

Surimi is a paste made from fish or other meat. The term can also refer to a number of East Asian foods that use that paste as their primary ingredient. It is available in many shapes, forms, and textures, and is often used to mimic the texture and color of the meat of lobster, crab, grilled Japanese eel or shellfish.

<span class="mw-page-title-main">World energy supply and consumption</span> Global production and usage of energy

World energy supply and consumption refers to the global supply of energy resources and its consumption. The system of global energy supply consists of the energy development, refinement, and trade of energy. Energy supplies may exist in various forms such as raw resources or more processed and refined forms of energy. The raw energy resources include for example coal, unprocessed oil & gas, uranium. In comparison, the refined forms of energy include for example refined oil that becomes fuel and electricity. Energy resources may be used in various different ways, depending on the specific resource, and intended end use. Energy production and consumption play a significant role in the global economy. It is needed in industry and global transportation. The total energy supply chain, from production to final consumption, involves many activities that cause a loss of useful energy.

References

  1. "Fish and Overfishing". Our World in Data. Retrieved 2023-07-10.
  2. "Fish and seafood consumption per capita". Our World in Data. Retrieved 2023-07-10.