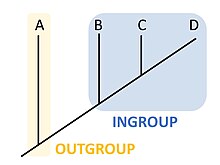
Cladistics is an approach to biological classification in which organisms are categorized in groups ("clades") based on hypotheses of most recent common ancestry. The evidence for hypothesized relationships is typically shared derived characteristics (synapomorphies) that are not present in more distant groups and ancestors. However, from an empirical perspective, common ancestors are inferences based on a cladistic hypothesis of relationships of taxa whose character states can be observed. Theoretically, a last common ancestor and all its descendants constitute a (minimal) clade. Importantly, all descendants stay in their overarching ancestral clade. For example, if the terms worms or fishes were used within a strict cladistic framework, these terms would include humans. Many of these terms are normally used paraphyletically, outside of cladistics, e.g. as a 'grade', which are fruitless to precisely delineate, especially when including extinct species. Radiation results in the generation of new subclades by bifurcation, but in practice sexual hybridization may blur very closely related groupings.
In biology, phylogenetics is the study of the evolutionary history and relationships among or within groups of organisms. These relationships are determined by phylogenetic inference, methods that focus on observed heritable traits, such as DNA sequences, protein amino acid sequences, or morphology. The result of such an analysis is a phylogenetic tree—a diagram containing a hypothesis of relationships that reflects the evolutionary history of a group of organisms.
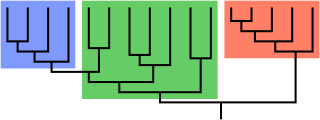
Paraphyly is a taxonomic term describing a grouping that consists of the grouping's last common ancestor and some but not all of its descendant lineages. The grouping is said to be paraphyletic with respect to the excluded subgroups. In contrast, a monophyletic grouping includes a common ancestor and all of its descendants.

A cladogram is a diagram used in cladistics to show relations among organisms. A cladogram is not, however, an evolutionary tree because it does not show how ancestors are related to descendants, nor does it show how much they have changed, so many differing evolutionary trees can be consistent with the same cladogram. A cladogram uses lines that branch off in different directions ending at a clade, a group of organisms with a last common ancestor. There are many shapes of cladograms but they all have lines that branch off from other lines. The lines can be traced back to where they branch off. These branching off points represent a hypothetical ancestor which can be inferred to exhibit the traits shared among the terminal taxa above it. This hypothetical ancestor might then provide clues about the order of evolution of various features, adaptation, and other evolutionary narratives about ancestors. Although traditionally such cladograms were generated largely on the basis of morphological characters, DNA and RNA sequencing data and computational phylogenetics are now very commonly used in the generation of cladograms, either on their own or in combination with morphology.
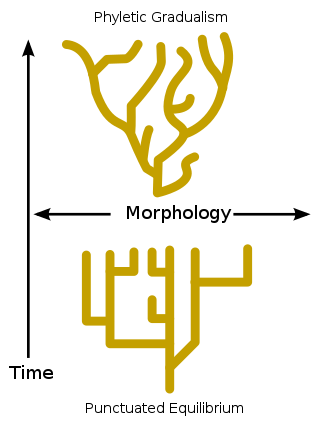
A phylogenetic tree, phylogeny or evolutionary tree is a graphical representation which shows the evolutionary history between a set of species or taxa during a specific time. In other words, it is a branching diagram or a tree showing the evolutionary relationships among various biological species or other entities based upon similarities and differences in their physical or genetic characteristics. In evolutionary biology, all life on Earth is theoretically part of a single phylogenetic tree, indicating common ancestry. Phylogenetics is the study of phylogenetic trees. The main challenge is to find a phylogenetic tree representing optimal evolutionary ancestry between a set of species or taxa. Computational phylogenetics focuses on the algorithms involved in finding optimal phylogenetic tree in the phylogenetic landscape.
Molecular phylogenetics is the branch of phylogeny that analyzes genetic, hereditary molecular differences, predominantly in DNA sequences, to gain information on an organism's evolutionary relationships. From these analyses, it is possible to determine the processes by which diversity among species has been achieved. The result of a molecular phylogenetic analysis is expressed in a phylogenetic tree. Molecular phylogenetics is one aspect of molecular systematics, a broader term that also includes the use of molecular data in taxonomy and biogeography.
Phylogenesis is the biological process by which a taxon appears. The science that studies these processes is called phylogenetics.
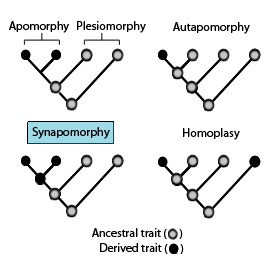
In phylogenetics, an apomorphy is a novel character or character state that has evolved from its ancestral form. A synapomorphy is an apomorphy shared by two or more taxa and is therefore hypothesized to have evolved in their most recent common ancestor. In cladistics, synapomorphy implies homology.
In phylogenetics and computational phylogenetics, maximum parsimony is an optimality criterion under which the phylogenetic tree that minimizes the total number of character-state changes. Under the maximum-parsimony criterion, the optimal tree will minimize the amount of homoplasy. In other words, under this criterion, the shortest possible tree that explains the data is considered best. Some of the basic ideas behind maximum parsimony were presented by James S. Farris in 1970 and Walter M. Fitch in 1971.

In biology, a substitution model, also called models of sequence evolution, are Markov models that describe changes over evolutionary time. These models describe evolutionary changes in macromolecules, such as DNA sequences or protein sequences, that can be represented as sequence of symbols. Substitution models are used to calculate the likelihood of phylogenetic trees using multiple sequence alignment data. Thus, substitution models are central to maximum likelihood estimation of phylogeny as well as Bayesian inference in phylogeny. Estimates of evolutionary distances are typically calculated using substitution models. Substitution models are also central to phylogenetic invariants because they are necessary to predict site pattern frequencies given a tree topology. Substitution models are also necessary to simulate sequence data for a group of organisms related by a specific tree.
In phylogenetics, long branch attraction (LBA) is a form of systematic error whereby distantly related lineages are incorrectly inferred to be closely related. LBA arises when the amount of molecular or morphological change accumulated within a lineage is sufficient to cause that lineage to appear similar to another long-branched lineage, solely because they have both undergone a large amount of change, rather than because they are related by descent. Such bias is more common when the overall divergence of some taxa results in long branches within a phylogeny. Long branches are often attracted to the base of a phylogenetic tree, because the lineage included to represent an outgroup is often also long-branched. The frequency of true LBA is unclear and often debated, and some authors view it as untestable and therefore irrelevant to empirical phylogenetic inference. Although often viewed as a failing of parsimony-based methodology, LBA could in principle result from a variety of scenarios and be inferred under multiple analytical paradigms.

Laurasiatheria is a superorder of placental mammals that groups together true insectivores (eulipotyphlans), bats (chiropterans), carnivorans, pangolins (pholidotes), even-toed ungulates (artiodactyls), odd-toed ungulates (perissodactyls), and all their extinct relatives. From systematics and phylogenetic perspectives, it is subdivided into order Eulipotyphla and clade Scrotifera. It is a sister group to Euarchontoglires with which it forms the magnorder Boreoeutheria. Laurasiatheria was discovered on the basis of the similar gene sequences shared by the mammals belonging to it; no anatomical features have yet been found that unite the group, although a few have been suggested such as a small coracoid process, a simplified hindgut and allantoic vessels that are large to moderate in size. The Laurasiatheria clade is based on DNA sequence analyses and retrotransposon presence/absence data. The superorder originated on the northern supercontinent of Laurasia, after it split from Gondwana when Pangaea broke up. Its last common ancestor is supposed to have lived between ca. 76 to 90 million years ago.
A grade is a taxon united by a level of morphological or physiological complexity. The term was coined by British biologist Julian Huxley, to contrast with clade, a strictly phylogenetic unit.
Computational phylogenetics, phylogeny inference, or phylogenetic inference focuses on computational and optimization algorithms, heuristics, and approaches involved in phylogenetic analyses. The goal is to find a phylogenetic tree representing optimal evolutionary ancestry between a set of genes, species, or taxa. Maximum likelihood, parsimony, Bayesian, and minimum evolution are typical optimality criteria used to assess how well a phylogenetic tree topology describes the sequence data. Nearest Neighbour Interchange (NNI), Subtree Prune and Regraft (SPR), and Tree Bisection and Reconnection (TBR), known as tree rearrangements, are deterministic algorithms to search for optimal or the best phylogenetic tree. The space and the landscape of searching for the optimal phylogenetic tree is known as phylogeny search space.
Ancestral reconstruction is the extrapolation back in time from measured characteristics of individuals, populations, or specie to their common ancestors. It is an important application of phylogenetics, the reconstruction and study of the evolutionary relationships among individuals, populations or species to their ancestors. In the context of evolutionary biology, ancestral reconstruction can be used to recover different kinds of ancestral character states of organisms that lived millions of years ago. These states include the genetic sequence, the amino acid sequence of a protein, the composition of a genome, a measurable characteristic of an organism (phenotype), and the geographic range of an ancestral population or species. This is desirable because it allows us to examine parts of phylogenetic trees corresponding to the distant past, clarifying the evolutionary history of the species in the tree. Since modern genetic sequences are essentially a variation of ancient ones, access to ancient sequences may identify other variations and organisms which could have arisen from those sequences. In addition to genetic sequences, one might attempt to track the changing of one character trait to another, such as fins turning to legs.
Bayesian inference of phylogeny combines the information in the prior and in the data likelihood to create the so-called posterior probability of trees, which is the probability that the tree is correct given the data, the prior and the likelihood model. Bayesian inference was introduced into molecular phylogenetics in the 1990s by three independent groups: Bruce Rannala and Ziheng Yang in Berkeley, Bob Mau in Madison, and Shuying Li in University of Iowa, the last two being PhD students at the time. The approach has become very popular since the release of the MrBayes software in 2001, and is now one of the most popular methods in molecular phylogenetics.
Phylogenetic comparative methods (PCMs) use information on the historical relationships of lineages (phylogenies) to test evolutionary hypotheses. The comparative method has a long history in evolutionary biology; indeed, Charles Darwin used differences and similarities between species as a major source of evidence in The Origin of Species. However, the fact that closely related lineages share many traits and trait combinations as a result of the process of descent with modification means that lineages are not independent. This realization inspired the development of explicitly phylogenetic comparative methods. Initially, these methods were primarily developed to control for phylogenetic history when testing for adaptation; however, in recent years the use of the term has broadened to include any use of phylogenies in statistical tests. Although most studies that employ PCMs focus on extant organisms, many methods can also be applied to extinct taxa and can incorporate information from the fossil record.
Wayne Paul Maddison, is a professor and Canada Research Chair in Biodiversity at the departments of zoology and botany at the University of British Columbia, and the Director of the Spencer Entomological Collection at the Beaty Biodiversity Museum.

Character evolution is the process by which a character or trait evolves along the branches of an evolutionary tree. Character evolution usually refers to single changes within a lineage that make this lineage unique from others. These changes are called character state changes and they are often used in the study of evolution to provide a record of common ancestry. Character state changes can be phenotypic changes, nucleotide substitutions, or amino acid substitutions. These small changes in a species can be identifying features of when exactly a new lineage diverged from an old one.
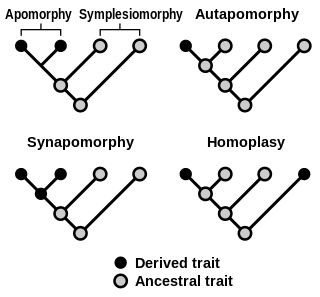
Homoplasy, in biology and phylogenetics, is the term used to describe a feature that has been gained or lost independently in separate lineages over the course of evolution. This is different from homology, which is the term used to characterize the similarity of features that can be parsimoniously explained by common ancestry. Homoplasy can arise from both similar selection pressures acting on adapting species, and the effects of genetic drift.