Wimbledon | |
---|---|
Borough constituency for the House of Commons | |
County | Greater London |
Electorate | 65,936 (December 2010) [1] |
Major settlements | Wimbledon, Raynes Park, Morden, Motspur Park |
Current constituency | |
Created | 1885 |
Member of Parliament | Stephen Hammond (Conservative) |
Seats | One |
Created from | Mid Surrey (northern half of) |
During its existence contributed to new seat(s) of: | Mitcham Merton and Morden (later consolidated) |
Wimbledon is a constituency [n 1] in Greater London represented in the House of Commons of the UK Parliament. [n 2] Since 2005, the seat has been held by Stephen Hammond of the Conservative Party.
The area was created by the Redistribution of Seats Act 1885 and had lay in Mid Surrey that elected two MPs. The constituency covered great bounds, skirting around Croydon to its south to reach Caterham, Warlingham, Chelsham and Farleigh in the North Downs and bearing formal alternate titles of the Wimbledon Division (of Surrey) and the North East Division of Surrey which in all but the most formal legal writing was written as North East Surrey. [2]
An Act reduced the seat in 1918 to create the Mitcham seat in the south-east; another in 1950 created Merton and Morden in the south. [n 3]
Since 1885 the seat has elected Conservative MPs except from 1945 to 1950 and 1997–2005, when the Labour candidate won the seat during that party's national landslide years. While the 2005 Conservative majority was marginal, the 2010 majority was 24.1% of the vote, so on the percentage of majority measure, but not on the longevity measure, it bore a safe seat hallmark. [n 4]
In elections to the London Borough of Merton, the seat returns all of the council's Conservative and Liberal Democrat councillors. Since 1990 the ward of Merton Park has only ever returned councillors for Merton Park Ward Residents Association. [3] Since 1994 the ward of West Barnes, which contains Merton's half of the town of Motspur Park, has swung between the Conservatives and the Liberal Democrats; the latter presently hold all three seats in the ward. [4] [5] [6] [7] In the local elections in 2018, Liberal Democrat councillors were elected for the wards of Trinity and Dundonald for the first time in the borough's history, with a further first time win for the Liberal Democrats in a by-election in the Cannon Hill ward in 2019.
In 2010, the second-placed candidate was a Liberal Democrat. The national collapse in the Liberal Democrat vote at the 2015 election meant that the Liberal Democrats did not return to 2nd place until 2019, when they did so with a 22.7% upswing in their vote. The seat is now one of the most marginal in the country [8] and a top Liberal Democrat target and Conservative defence for the next general election.
In the 2016 referendum on the UK's membership of the European Union, the London Borough of Merton, of which the constituency is a part, voted to remain by 62.9%, and 70.6% of this constituency itself voted to remain in the European Union. [9] In September 2019 the incumbent, Stephen Hammond lost his party's whip for rebelling on a key Brexit vote. He briefly sat as an Independent and the whip was restored on 29 October 2019, with 9 of 21 other rebels of the same party.
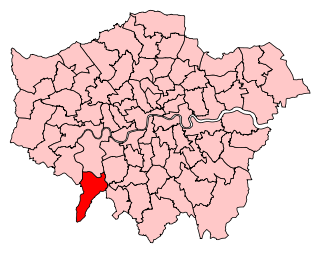
1885–1918: The Sessional Division of Croydon except so much as is within a district of the Metropolis, the parishes of Caterham, Chelsham, Farley, Warlingham, Merton, and Wimbledon, so much of the Parliamentary Borough of Deptford as is in Surrey, and the area of the Parliamentary Boroughs of Battersea and Clapham, Camberwell, Lambeth, Newington, Southwark, and Wandsworth.
1918–1950: The Municipal Borough of Wimbledon, and the Urban District of Merton and Morden.
1950–1955: The Municipal Boroughs of Wimbledon, and Malden and Coombe.
1955–1974: The Municipal Borough of Wimbledon.
1974–1983: The London Borough of Merton wards of Cannon Hill, Priory, West Barnes, Wimbledon East, Wimbledon North, Wimbledon South, and Wimbledon West.
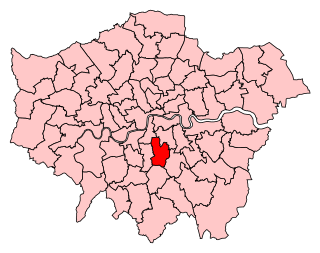
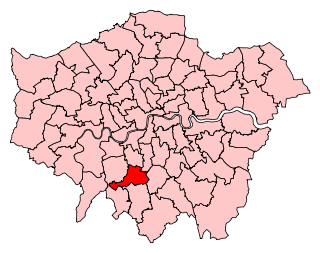
1983–2010: The London Borough of Merton wards of Abbey, Cannon Hill, Dundonald, Durnsford, Hillside, Merton Park, Raynes Park, Trinity, Village, and West Barnes.
2010–present: As above except Durnsford ward had been replaced by Wimbledon Park ward following a local authority boundary review.
Further to the 2023 Periodic Review of Westminster constituencies, enacted by the Parliamentary Constituencies Order 2023, the composition of the constituency from the next general election, due by January 2025, will be:
The Merton Borough wards reflect the local authority boundary review which became effective on 4 May 2022, with the Cannon Hill ward being moved to Mitcham and Morden. The wards of Old Malden and St. James (as they existed on 1 December 2020) will be transferred from Kingston and Surbiton. [11]
A local government boundary review becoming effective in May 2022 was also carried out in Kingston upon Thames, [12] but the Electoral Changes Order was not passed until 1 April 2021. [13] Consequently, the parts in Kingston upon Thames will now comprise the Hotspur Park & Old Malden East ward, nearly all of the Old Malden ward, and parts of the Green Lane & St James, and New Malden Village wards. [14]
According to analysis by the New Statesman the Liberal Democrats, rather than the Conservatives, would have won the seat if the 2019 election had been held on the new boundaries. [15]
The seat has a commuter-sustained suburban economy with an imposing shopping centre, overwhelmingly privately built and owned or rented homes and a range of open green spaces, ranging in value from elevated Wimbledon Village - sandwiched between Wimbledon Common and Wimbledon Park [n 5] - where a large tranche of homes exceed £1,000,000 - to Merton Abbey ruins and South Wimbledon, with more social housing in its wards.
Wimbledon station is a southern terminus of the District line, as well as a station on the South West main line. It is also the western terminus of the Croydon Tramlink. South Wimbledon is a station on the Northern line branch to Morden.
Workless claimants who were registered jobseekers were in November 2012 significantly lower than the national average of 3.8%, at 1.5% of the population based on a statistical compilation by The Guardian . [16]
Wards in this area often see a minority of Liberal Democrat and Labour councillors. Voters have quite high median and mean incomes, with an above-average public sector workforce which together means the seat resembles similar Tory-strong seats for London with other party traditions also followed: Richmond Park, Kingston and Surbiton and Putney. As widely touted in opinion polls the runner-up of the 2019 election became the Liberal Democrat.
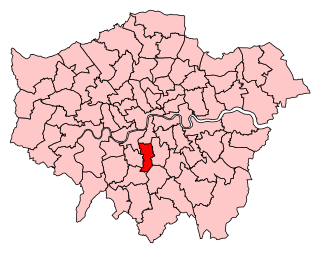
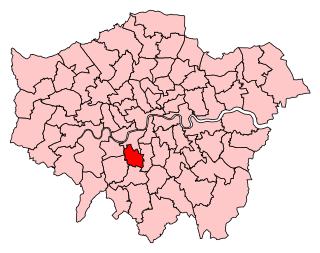
Party | Candidate | Votes | % | ±% | |
---|---|---|---|---|---|
Green | Rachel Brooks [18] | ||||
Reform UK | Ben Cronin [19] | ||||
Conservative | Danielle Dunfield-Prayero [20] | ||||
Liberal Democrats | Paul Kohler [21] | ||||
Labour | Eleanor Stringer [22] | ||||
Majority | |||||
Turnout | |||||
Registered electors | |||||
Swing | |||||
Party | Candidate | Votes | % | ±% | |
---|---|---|---|---|---|
Conservative | Stephen Hammond | 20,373 | 38.4 | –8.1 | |
Liberal Democrats | Paul Kohler | 19,745 | 37.2 | +22.7 | |
Labour | Jackie Schneider | 12,543 | 23.7 | –11.9 | |
Independent | Graham Hadley | 366 | 0.7 | New | |
Majority | 628 | 1.2 | –9.7 | ||
Turnout | 53,027 | 77.7 | +0.5 | ||
Registered electors | 68,232 | ||||
Conservative hold | Swing | –15.4 | |||
Party | Candidate | Votes | % | ±% | |
---|---|---|---|---|---|
Conservative | Stephen Hammond | 23,946 | 46.5 | –5.6 | |
Labour | Imran Uddin [n 6] | 18,324 | 35.6 | +9.6 | |
Liberal Democrats | Carl Quilliam | 7,472 | 14.5 | +1.8 | |
Green | Charles Barraball | 1,231 | 2.4 | –1.7 | |
UKIP | Strachan McDonald | 553 | 1.1 | –4.0 | |
Majority | 5,622 | 10.9 | –15.2 | ||
Turnout | 51,526 | 77.2 | +3.7 | ||
Registered electors | 66,780 | ||||
Conservative hold | Swing | –7.6 | |||
Party | Candidate | Votes | % | ±% | |
---|---|---|---|---|---|
Conservative | Stephen Hammond | 25,225 | 52.1 | +3.0 | |
Labour | Andrew Judge | 12,606 | 26.0 | +3.7 | |
Liberal Democrats | Shas Sheehan | 6,129 | 12.7 | –12.3 | |
UKIP | Peter Bucklitsch | 2,476 | 5.1 | +3.2 | |
Green | Charles Barraball | 1,986 | 4.1 | +2.9 | |
Majority | 12,619 | 26.1 | +2.0 | ||
Turnout | 48,422 | 73.5 | +0.5 | ||
Registered electors | 65,853 | ||||
Conservative hold | Swing | –0.4 | |||
Party | Candidate | Votes | % | ±% | |
---|---|---|---|---|---|
Conservative | Stephen Hammond | 23,257 | 49.1 | +7.7 | |
Liberal Democrats | Shas Sheehan | 11,849 | 25.0 | +6.8 | |
Labour | Andrew Judge | 10,550 | 22.3 | –13.4 | |
UKIP | Mark McAleer | 914 | 1.9 | +1.0 | |
Green | Rajeev Thacker | 590 | 1.2 | –1.9 | |
Christian | David Martin | 235 | 0.5 | New | |
Majority | 11,408 | 24.1 | +18.8 | ||
Turnout | 47,395 | 73.0 | +5.2 | ||
Registered electors | 65,723 | ||||
Conservative hold | Swing | +0.4 | |||
Party | Candidate | Votes | % | ±% | |
---|---|---|---|---|---|
Conservative | Stephen Hammond | 17,886 | 41.2 | +4.6 | |
Labour | Roger Casale | 15,585 | 35.9 | –9.8 | |
Liberal Democrats | Stephen M. Gee | 7,868 | 18.1 | +5.1 | |
Green | Giles T. Barrow | 1,374 | 3.2 | +0.8 | |
UKIP | Andrew T. Mills | 408 | 0.9 | –0.1 | |
Independent | Christopher J. Coverdale | 211 | 0.5 | New | |
Tiger's Eye - the Party for Kids | Alastair P. Wilson | 50 | 0.1 | New | |
Rainbow Dream Ticket | George Weiss | 22 | 0.1 | New | |
Majority | 2,301 | 5.3 | N/A | ||
Turnout | 43,404 | 68.1 | +3.8 | ||
Registered electors | 63,696 | ||||
Conservative gain from Labour | Swing | +7.2 | |||
Party | Candidate | Votes | % | ±% | |
---|---|---|---|---|---|
Labour | Roger Casale | 18,806 | 45.7 | +2.9 | |
Conservative | Stephen Hammond | 15,062 | 36.6 | 0.0 | |
Liberal Democrats | Martin D. Pierce | 5,341 | 13.0 | –3.6 | |
Green | Rajeev K. Thacker | 1,007 | 2.4 | +1.4 | |
CPA | Roger E. Glencross | 479 | 1.2 | New | |
UKIP | Mariana Bell | 414 | 1.0 | New | |
Majority | 3,744 | 9.1 | +2.9 | ||
Turnout | 41,109 | 64.3 | –11.1 | ||
Registered electors | 63,930 | ||||
Labour hold | Swing | +1.5 | |||
Party | Candidate | Votes | % | ±% | |
---|---|---|---|---|---|
Labour | Roger Casale | 20,674 | 42.8 | +19.5 | |
Conservative | Charles Goodson-Wickes | 17,684 | 36.6 | –16.4 | |
Liberal Democrats | Alison L. Willott | 8,014 | 16.6 | +4.7 | |
Referendum | Abid Hameed | 993 | 2.1 | New | |
Green | Rajeev K. Thacker | 474 | 1.0 | –0.7 | |
ProLife Alliance | Sophie A.H. Davies | 346 | 0.7 | New | |
Mongolian Barbeque Great Place to Party | Matthew G. Kirby | 112 | 0.2 | New | |
Rainbow Dream Ticket | Graham L. Stacey | 47 | 0.1 | New | |
Majority | 2,990 | 6.2 | N/A | ||
Turnout | 48,344 | 75.4 | –2.8 | ||
Registered electors | 64,113 | ||||
Labour gain from Conservative | Swing | –17.9 | |||
Party | Candidate | Votes | % | ±% | |
---|---|---|---|---|---|
Conservative | Charles Goodson-Wickes | 26,331 | 53.0 | +2.1 | |
Labour | Kingsley J. Abrams | 11,570 | 23.3 | +1.8 | |
Liberal Democrats | Alison L. Willott | 10,569 | 21.3 | –6.2 | |
Green | Vaughan H. Flood | 860 | 1.7 | New | |
Natural Law | Hugh R.A. Godfrey | 181 | 0.4 | New | |
Independent | Graham W. Hadley | 170 | 0.3 | New | |
Majority | 14,761 | 29.7 | +6.3 | ||
Turnout | 49,681 | 80.2 | +4.1 | ||
Registered electors | 61,917 | ||||
Conservative hold | Swing | ||||
Party | Candidate | Votes | % | ±% | |
---|---|---|---|---|---|
Conservative | Charles Goodson-Wickes | 24,538 | 50.9 | –1.3 | |
Liberal | Adrian Slade | 13,237 | 27.5 | +0.3 | |
Labour | Christine Bickerstaff | 10,428 | 21.6 | +2.7 | |
Majority | 11,301 | 23.4 | –1.5 | ||
Turnout | 48,203 | 76.1 | +3.7 | ||
Registered electors | 63,353 | ||||
Conservative hold | Swing | ||||
Party | Candidate | Votes | % | ±% | |
---|---|---|---|---|---|
Conservative | Michael Havers | 24,169 | 52.1 | –3.0 | |
Liberal | David J. Twigg | 12,623 | 27.2 | +12.0 | |
Labour | Rock Tansey | 8,806 | 19.0 | –9.5 | |
Ecology | Antony Jones | 717 | 1.5 | New | |
Party of Associates with Licensees | E.J. Weakner | 114 | 0.3 | New | |
Majority | 11,546 | 24.9 | –1.7 | ||
Turnout | 46,429 | 72.4 | –4.0 | ||
Registered electors | 64,132 | ||||
Conservative hold | Swing | ||||
Party | Candidate | Votes | % | ±% | |
---|---|---|---|---|---|
Conservative | Michael Havers | 27,567 | 55.10 | +6.57 | |
Labour | Rock Tansey [36] | 14,252 | 28.48 | –2.64 | |
Liberal | David J. Twigg | 7,604 | 15.20 | –5.63 | |
National Front | Anthony Bailey [36] | 612 | 1.22 | New | |
Majority | 13,315 | 26.62 | +8.73 | ||
Turnout | 50,035 | 76.42 | +7.62 | ||
Registered electors | 65,471 | ||||
Conservative hold | Swing | ||||
Party | Candidate | Votes | % | ±% | |
---|---|---|---|---|---|
Conservative | Michael Havers | 23,615 | 48.53 | –0.09 | |
Labour | K. Bill | 14,909 | 30.64 | +2.39 | |
Liberal | K. Searby | 10,133 | 20.83 | –3.86 | |
Majority | 8,706 | 17.89 | –4.48 | ||
Turnout | 48,657 | 68.80 | –8.95 | ||
Registered electors | 70,726 | ||||
Conservative hold | Swing | ||||
Party | Candidate | Votes | % | ±% | |
---|---|---|---|---|---|
Conservative | Michael Havers | 26,542 | 48.62 | –4.85 | |
Labour | K. Bill | 14,329 | 26.25 | –3.67 | |
Liberal | K. Searby | 13,478 | 24.69 | +8.08 | |
Independent | Bill Boaks | 240 | 0.44 | New | |
Majority | 12,213 | 22.37 | –1.18 | ||
Turnout | 54,589 | 77.75 | +11.92 | ||
Registered electors | 70,210 | ||||
Conservative hold | Swing | ||||
Party | Candidate | Votes | % | ±% | |
---|---|---|---|---|---|
Conservative | Michael Havers | 15,285 | 53.47 | +3.14 | |
Labour | Ralph C. Holmes | 8,554 | 29.92 | –1.61 | |
Liberal | John Reginald MacDonald | 4,749 | 16.61 | –2.19 | |
Majority | 6,731 | 23.55 | +4.75 | ||
Turnout | 28,588 | 66.83 | –8.16 | ||
Registered electors | 42,774 | ||||
Conservative hold | Swing | ||||
Party | Candidate | Votes | % | ±% | |
---|---|---|---|---|---|
Conservative | Cyril Black | 15,191 | 50.33 | –1.70 | |
Labour | Tom Braddock | 9,517 | 31.53 | +2.53 | |
Liberal | John Reginald MacDonald | 5,475 | 18.14 | –0.83 | |
Majority | 5,674 | 18.80 | –4.22 | ||
Turnout | 30,183 | 74.99 | +0.11 | ||
Registered electors | 40,248 | ||||
Conservative hold | Swing | ||||
Party | Candidate | Votes | % | ±% | |
---|---|---|---|---|---|
Conservative | Cyril Black | 15,952 | 52.03 | –14.83 | |
Labour | John R. Daly | 8,891 | 29.00 | –4.15 | |
Liberal | George Scott | 5,817 | 18.97 | New | |
Majority | 7,061 | 23.02 | –10.69 | ||
Turnout | 30,660 | 74.88 | –3.55 | ||
Registered electors | 40,947 | ||||
Conservative hold | Swing | ||||
Party | Candidate | Votes | % | ±% | |
---|---|---|---|---|---|
Conservative | Cyril Black | 21,538 | 66.86 | +1.31 | |
Labour | Lawrence M. Kershaw | 10,678 | 33.15 | –1.31 | |
Majority | 10,860 | 33.71 | +2.61 | ||
Turnout | 32,216 | 78.43 | +0.16 | ||
Registered electors | 42,151 | ||||
Conservative hold | Swing | ||||
Party | Candidate | Votes | % | ±% | |
---|---|---|---|---|---|
Conservative | Cyril Black | 22,112 | 65.55 | –0.98 | |
Labour | Greville Janner | 11,622 | 34.45 | +0.98 | |
Majority | 10,490 | 31.10 | –1.96 | ||
Turnout | 33,734 | 78.27 | –4.07 | ||
Registered electors | 43,099 | ||||
Conservative hold | Swing | ||||
Party | Candidate | Votes | % | ±% | |
---|---|---|---|---|---|
Conservative | Cyril Black | 42,218 | 66.53 | +5.20 | |
Labour | Charles Ford | 21,242 | 33.47 | +2.61 | |
Majority | 20,976 | 33.06 | +2.59 | ||
Turnout | 63,460 | 82.34 | –3.38 | ||
Registered electors | 77,067 | ||||
Conservative hold | Swing | ||||
Party | Candidate | Votes | % | ±% | |
---|---|---|---|---|---|
Conservative | Cyril Black | 40,339 | 61.33 | +18.94 | |
Labour | George Leonard Deacon | 20,296 | 30.86 | –13.55 | |
Liberal | Ian Forester Gibson | 5,136 | 7.81 | –1.75 | |
Majority | 20,043 | 30.47 | N/A | ||
Turnout | 65,771 | 85.72 | +7.65 | ||
Registered electors | 76,728 | ||||
Conservative gain from Labour | Swing | ||||
Substantial loss of territory to create Mitcham and Morden
Party | Candidate | Votes | % | ±% | |
---|---|---|---|---|---|
Labour | Arthur Palmer | 30,188 | 44.41 | +12.25 | |
Conservative | Geoffrey Paul Hardy-Roberts [37] | 28,820 | 42.39 | –25.45 | |
Liberal | Alick Dudley Kay | 6,501 | 9.56 | New | |
Common Wealth | K. Horne | 2,472 | 3.64 | New | |
Majority | 1,368 | 2.02 | N/A | ||
Turnout | 67,981 | 78.07 | +10.47 | ||
Registered electors | 89,363 | ||||
Labour gain from Conservative | Swing | ||||
Party | Candidate | Votes | % | ±% | |
---|---|---|---|---|---|
Conservative | John Power | 36,816 | 67.84 | –12.54 | |
Labour | Tom Braddock | 17,452 | 32.16 | +12.54 | |
Majority | 19,364 | 35.68 | –25.08 | ||
Turnout | 54,268 | 67.60 | –3.35 | ||
Registered electors | 80,283 | ||||
Conservative hold | Swing | ||||
Party | Candidate | Votes | % | ±% | |
---|---|---|---|---|---|
Conservative | John Power | 39,643 | 80.38 | +26.98 | |
Labour | Tom Braddock | 9,674 | 19.62 | –4.58 | |
Majority | 29,969 | 60.76 | +41.56 | ||
Turnout | 49,317 | 70.95 | +2.15 | ||
Registered electors | 69,508 | ||||
Conservative hold | Swing | ||||
Party | Candidate | Votes | % | ±% | |
---|---|---|---|---|---|
Unionist | John Power | 21,902 | 53.4 | –20.8 | |
Labour | Tom Braddock | 9,924 | 24.2 | –1.6 | |
Liberal | Arthur Peters | 9,202 | 22.4 | New | |
Majority | 11,978 | 29.2 | –19.2 | ||
Turnout | 41,028 | 68.8 | –3.4 | ||
Registered electors | 59,654 | ||||
Unionist hold | Swing | –9.6 | |||
Party | Candidate | Votes | % | ±% | |
---|---|---|---|---|---|
Unionist | John Power | 21,209 | 74.2 | +4.4 | |
Labour | Mark Starr | 7,386 | 25.8 | –4.4 | |
Majority | 13,823 | 48.4 | +8.8 | ||
Turnout | 28,595 | 72.2 | +14.9 | ||
Registered electors | 39,604 | ||||
Unionist hold | Swing | +4.4 | |||
Party | Candidate | Votes | % | ±% | |
---|---|---|---|---|---|
Unionist | Joseph Hood | 15,495 | 69.8 | –1.9 | |
Labour | Mark Starr | 6,717 | 30.2 | New | |
Majority | 8,778 | 39.6 | –3.8 | ||
Turnout | 22,212 | 57.3 | –4.7 | ||
Registered electors | 38,793 | ||||
Unionist hold | Swing | –1.9 | |||
Party | Candidate | Votes | % | ±% | |
---|---|---|---|---|---|
Unionist | Joseph Hood | 16,751 | 71.7 | –9.9 | |
Liberal | Robert Oswald Moon | 6,627 | 28.3 | New | |
Majority | 10,124 | 43.4 | –19.8 | ||
Turnout | 23,378 | 62.0 | +15.9 | ||
Registered electors | 37,677 | ||||
Unionist hold | Swing | –9.9 | |||
Party | Candidate | Votes | % | ±% | |
---|---|---|---|---|---|
C | Unionist | Joseph Hood | 13,652 | 81.6 | N/A |
Independent | G.M. Edwardes Jones | 3,079 | 18.4 | New | |
Majority | 10,573 | 63.2 | N/A | ||
Turnout | 16,731 | 46.1 | N/A | ||
Registered electors | 36,258 | ||||
Unionist hold | Swing | N/A | |||
Cindicates candidate endorsed by the coalition government. |
Party | Candidate | Votes | % | ±% | |
---|---|---|---|---|---|
Conservative | Stuart Coats | 8,970 | 55.6 | N/A | |
Independent | Kennedy Jones | 7,159 | 44.4 | New | |
Majority | 1,811 | 11.2 | N/A | ||
Turnout | 16,129 | 46.5 | N/A | ||
Registered electors | 34,719 | ||||
Conservative hold | Swing | N/A | |||
Party | Candidate | Votes | % | ±% | |
---|---|---|---|---|---|
Conservative | Henry Chaplin | Unopposed | |||
Registered electors | 27,810 | ||||
Conservative hold | |||||
Party | Candidate | Votes | % | ±% | |
---|---|---|---|---|---|
Conservative | Henry Chaplin | 14,445 | 61.8 | +5.6 | |
Liberal | Arthur Holland | 8,930 | 38.2 | –5.6 | |
Majority | 5,515 | 23.6 | +11.2 | ||
Turnout | 23,375 | 84.1 | +6.8 | ||
Registered electors | 27,810 | ||||
Conservative hold | Swing | +5.6 | |||
Party | Candidate | Votes | % | ±% | |
---|---|---|---|---|---|
Conservative | Henry Chaplin | 10,263 | 75.7 | +19.5 | |
Independent Liberal | Bertrand Russell | 3,299 | 24.3 | New | |
Majority | 6,694 | 51.4 | +39.0 | ||
Turnout | 13,562 | 57.2 | –20.1 | ||
Registered electors | 23,702 | ||||
Conservative hold | Swing | N/A | |||
Party | Candidate | Votes | % | ±% | |
---|---|---|---|---|---|
Conservative | Eric Hambro | 9,523 | 56.2 | N/A | |
Liberal | St. George Lane Fox-Pitt | 7,409 | 43.8 | New | |
Majority | 2,114 | 12.4 | N/A | ||
Turnout | 16,932 | 77.3 | N/A | ||
Registered electors | 21,899 | ||||
Conservative hold | Swing | N/A | |||
Party | Candidate | Votes | % | ±% | |
---|---|---|---|---|---|
Conservative | Eric Hambro | Unopposed | |||
Registered electors | |||||
Conservative hold | |||||
Party | Candidate | Votes | % | ±% | |
---|---|---|---|---|---|
Conservative | Cosmo Bonsor | Unopposed | |||
Registered electors | |||||
Conservative hold | |||||
Party | Candidate | Votes | % | ±% | |
---|---|---|---|---|---|
Conservative | Cosmo Bonsor | 7,397 | 74.0 | N/A | |
Liberal | Thomas Arthur Meates | 2,602 | 26.0 | New | |
Majority | 4,795 | 48.0 | N/A | ||
Turnout | 9,999 | 64.2 | N/A | ||
Registered electors | 15,582 | ||||
Conservative hold | Swing | N/A | |||
Party | Candidate | Votes | % | ±% | |
---|---|---|---|---|---|
Conservative | Cosmo Bonsor | Unopposed | |||
Registered electors | |||||
Conservative hold | |||||
Party | Candidate | Votes | % | ±% | |
---|---|---|---|---|---|
Conservative | Cosmo Bonsor | 6,189 | 62.3 | ||
Liberal | John Cooper [40] | 3,745 | 37.7 | ||
Majority | 2,444 | 24.6 | |||
Turnout | 9,934 | 70.5 | |||
Registered electors | 14,086 | ||||
Conservative win (new seat) |
The London Borough of Merton is a London borough in London, England. The borough was formed under the London Government Act 1963 in 1965 by the merger of the Municipal Borough of Mitcham, the Municipal Borough of Wimbledon and the Merton and Morden Urban District, all formerly within Surrey.
Beckenham is a constituency in Greater London represented in the House of Commons of the UK Parliament since 2010 by Bob Stewart, an independent, formerly a member of the Conservative Party.
East Surrey is a constituency represented in the House of Commons of the UK Parliament since 2019 by Claire Coutinho, a Conservative serving as Secretary of State for Energy Security and Net Zero. The seat covers an affluent area in the English county of Surrey.
Crewe and Nantwich is a constituency in Cheshire represented in the House of Commons of the UK Parliament. It was created in 1983; since 2019 its Member of Parliament (MP) has been Kieran Mullan of the Conservative Party.
Southport is a constituency in Merseyside which has been represented in the House of Commons of the UK Parliament since 2017 by Damien Moore of the Conservative Party.
Dulwich and West Norwood is a constituency in South London created in 1997. It has been represented by Helen Hayes of Labour since her election in 2015.
Hornsey and Wood Green is a constituency in Greater London created in 1983 and represented in the House of Commons of the UK Parliament since 2015 by Catherine West, of the Labour Party. To date, it has drawn together for general elections parts of the London Borough of Haringey.
Kingston and Surbiton is a constituency in Greater London created in 1997 and represented in the House of Commons of the UK Parliament since 2017 by Ed Davey, the Leader of the Liberal Democrats. Davey previously held the seat from 1997 until losing reelection in 2015 to Conservative James Berry.
Mitcham and Morden is a constituency in Greater London represented in the House of Commons of the UK Parliament since 1997 by Dame Siobhain McDonagh of the Labour Party.
Richmond Park is a constituency in Greater London represented in the House of Commons of the UK Parliament. Since 2019, its Member of Parliament (MP) has been Sarah Olney of the Liberal Democrats.
Streatham is a constituency represented in the House of Commons of the UK Parliament since 2019 by Bell Ribeiro-Addy of the Labour Party.
Sutton and Cheam is a constituency in Greater London represented in the House of Commons of the UK Parliament since 2015 by Paul Scully, a Conservative.
Tooting is a constituency created in 1974 in Greater London. It is represented in the House of Commons of the UK Parliament since 2016 by Dr. Rosena Allin-Khan, a member of the Labour Party.
Twickenham is a constituency in Greater London represented in the House of Commons of the UK Parliament since 2019 by Munira Wilson of the Liberal Democrats.
Greenwich and Woolwich is a constituency represented in the House of Commons of the UK Parliament since 2015 by Matthew Pennycook of the Labour Party.
The region of Greater London, including the City of London, is divided into 73 parliamentary constituencies which are sub-classified as borough constituencies, affecting the type of electoral officer and level of expenses permitted.
Lewisham West and Penge is a constituency in Greater London created in 2010 and represented in the House of Commons of the UK Parliament since 2017 by Ellie Reeves of the Labour Party.
Ruislip, Northwood and Pinner is a constituency in Greater London represented in the House of Commons of the UK Parliament since 2019 by David Simmonds, a Conservative.
Kingston or Kingston-upon-Thames was a parliamentary constituency which covered the emerging southwest, outer London suburb of Kingston upon Thames and which existed between 1885 and 1997 and returned one Member of Parliament (MP) to the House of Commons of the UK Parliament. The Conservative candidate won each election during its 112-year existence.
Merton London Borough Council, which styles itself Merton Council, is the local authority for the London Borough of Merton in Greater London, England. It is a London borough council, one of 32 in London. The council has been under Labour majority control since 2014. The council is based at Merton Civic Centre in Morden.
{{cite journal}}
: Cite journal requires |journal=
(help){{cite web}}
: Missing or empty |url=
(help){{cite book}}
: |work=
ignored (help){{cite book}}
: |work=
ignored (help){{cite book}}
: |work=
ignored (help)