This article presents the historical demographics of Cardiff , capital city of Wales in the United Kingdom.
Contents
| Demographics of Cardiff | |
|---|---|
 Population pyramid of Cardiff | |
| Population | 361,468 (2016 estimate) |
This article presents the historical demographics of Cardiff , capital city of Wales in the United Kingdom.
| Demographics of Cardiff | |
|---|---|
| Population pyramid of Cardiff | |
| Population | 361,468 (2016 estimate) |
Following a period of decline during the 1970s and 1980s, Cardiff's population is growing. The local authority area had an estimated population of more than 324,800 in 2008, [1] compared to a 2001 Census figure of 305,353. [2] Between mid-2007 and mid-2008, Cardiff was the fastest-growing local authority in Wales with population growth rate of 1.2%. [1] According to Census 2001 data, Cardiff was the 14th largest settlement in the United Kingdom, [3] and the 21st largest urban area. [4] The Cardiff Larger Urban Zone (a Eurostat definition including the Vale of Glamorgan and a number of local authorities in the Valleys) has 841,600 people, the 10th largest LUZ in the UK. [5] The Cardiff and South Wales Valleys metropolitan area has a population of nearly 1.1 million people. [6]
Official estimates derived from the census regarding the city's total population have been disputed. The city council has published two articles that argue the 2001 census seriously under reports the population of Cardiff and, in particular, the ethnic minority population of some inner city areas. [7] [8]
The Welsh Government's official 2016 mid year estimate of the population of the Cardiff local authority was 361,468. [9]
| Year | Population of Cardiff | Change |
| 1801 | 6,342 | - |
| 1851 | 26,630 | 320% |
| 1861 | 48,965 | 184% |
| 1871 | 71,301 | 84% |
| 1881 | 93,637 | 31% |
| 1891 | 142,114 | 52% |
| 1901 | 172,629 | 21% |
| 1911 | 209,804 | 22% |
| 1921 | 227,753 | 9% |
| 1931 | 247,270 | 9% |
| 1941 | 257,112 | 4% |
| 1951 | 267,356 | 4% |
| 1961 | 278,552 | 4% |
| 1971 | 290,227 | 4% |
| 1981 | 274,500 | -5% |
| 1991 | 272,557 | -1% |
| 2001 | 292,150 | 7% |
| 2007 | 321,000* | 10% |
| 2008 | 324,800† | 1% |
source: Vision of Britain except *, which is estimated by the Office for National Statistics, and † which is estimated by National Statistics for Wales. Historical populations are calculated with the modern boundaries | ||


Cardiff has an ethnically diverse population due to its past trading connections, post-war immigration and the large numbers of foreign students who attend university in the city. The ethnic make-up of Cardiff's population at the time of the 2001 census was: 91.6% white, 2% mixed race, 4% South Asian, 1.3% black, 1.2% other ethnic groups. According to a report published in 2005, over 30,000 people from an ethnic minority live in Cardiff, around 8.4% of the city's total — many of these communities live in Butetown, where ethnic minorities make up around a third of the total population. [10] This diversity, and especially that of the city's long-established African and Arab communities, has been celebrated in a number of cultural exhibitions and events, along with a number of books which have been published on this subject. [11] [12]
| Ethnic group | Year | |||||||||
|---|---|---|---|---|---|---|---|---|---|---|
| 1950 estimations [13] | 1991 [14] | 2001 [15] | 2011 [16] | 2021 [17] | ||||||
| Population | % | Population | % | Population | % | Population | % | Population | % | |
| White: Total | 262,356 | 98.1% | 261,889 | 93.8% | 279,624 | 91.6% | 293,114 | 84.7% | 286,931 | 79.2% |
| White: British | – | – | – | – | 269,693 | 88.3% | 277,798 | 80.3% | 266,533 | 73.6% |
| White: Irish | – | – | – | – | 2,734 | 0.9% | 2,547 | 0.7% | 2,335 | 0.6% |
| White: Irish Traveller/White Gypsy [note 1] | – | – | – | – | – | – | 521 | 0.1% | 673 | 0.2% |
| White: Roma | – | – | – | – | – | – | – | – | 593 | 0.2% |
| White: Other | – | – | – | – | 7,197 | 2.4% | 12,248 | 3.5% | 16,797 | 4.6% |
| Asian or Asian British: Total | – | – | 9,247 | 3.3% | 13,924 | 4.5% | 27,885 | 8% | 34,983 | 9.7% |
| Asian or Asian British: Indian | – | – | 2,704 | 1.0% | 3,829 | 1.3% | 7,886 | 2.3% | 8,837 | 2.4% |
| Asian or Asian British: Pakistani | – | – | 2,679 | 1.0% | 4,264 | 1.4% | 6,354 | 1.8% | 8,615 | 2.4% |
| Asian or Asian British: Bangladeshi | – | – | 1,639 | 0.6% | 2,546 | 0.8% | 4,838 | 1.4% | 6,887 | 1.9% |
| Asian or Asian British: Chinese [note 2] | – | – | 1,099 | 0.4% | 1,844 | 0.6% | 4,168 | 1.2% | 5,017 | 1.4% |
| Asian or Asian British: Asian Other | – | – | 1,126 | 0.4% | 1,441 | 0.5% | 4,639 | 1.3% | 5,627 | 1.6% |
| Black or Black British: Total | – | – | 5,184 | 1.8% | 3,898 | 1.3% | 8,201 | 2.3% | 13,896 | 3.8% |
| Black or Black British: African | – | – | 1,730 | 0.6% | 2,189 | 0.7% | 5,213 | 1.5% | 10,587 | 2.9% |
| Black or Black British: Caribbean | – | – | 1,827 | 0.7% | 1,330 | 0.4% | 1,322 | 0.4% | 1,350 | 0.4% |
| Black or Black British: Other | – | – | 1,627 | 0.6% | 379 | 0.1% | 1,666 | 0.5% | 1,959 | 0.5% |
| British Mixed: Total | – | – | – | – | 6,084 | 2% | 10,031 | 2.9% | 14,506 | 4% |
| Mixed: White and Caribbean | – | – | – | – | 2,428 | 0.8% | 3,641 | 1.1% | 4,299 | 1.2% |
| Mixed: White and African | – | – | – | – | 1,035 | 0.3% | 1,742 | 0.5% | 2,611 | 0.7% |
| Mixed: White and Asian | – | – | – | – | 1,302 | 0.4% | 2,459 | 0.7% | 3,572 | 1.0% |
| Mixed: Other Mixed | – | – | – | – | 1,319 | 0.4% | 2,189 | 0.6% | 4,024 | 1.1% |
| Other: Total | – | – | 2,735 | 1% | 1,823 | 0.6% | 6,859 | 2% | 11,994 | 3.3% |
| Other: Arab [note 3] | – | – | – | – | – | – | 4,707 | 1.3% | 6,624 | 1.8% |
| Other: Any other ethnic group | – | – | 2,735 | 1% | 1,823 | 0.6% | 2,152 | 0.6% | 5,370 | 1.5% |
| Ethnic minority: Total | 5,000 | 1.9% | 17,166 | 6.2% | 25,729 | 8.4% | 52,976 | 15.3% | 75,379 | 20.8% |
| Total: | 267,356 | 100% | 279,055 | 100% | 305,353 | 100% | 346,090 | 100% | 362,310 | 100% |
Cardiff has a chequered linguistic history with Welsh, English, Latin, Norse and Anglo-Norman preponderant at different times. Welsh was the majority language in Cardiff from the 13th century until the city's explosive growth in the Victorian era. [18] As late as 1850, five of the twelve Anglican churches within the current city boundaries conducted their services exclusively in the Welsh language, while only two worshipped exclusively in English. [18] By 1891, the percentage of Welsh speakers had dropped to 27.9% and only Lisvane, Llanedeyrn and Creigiau remained as majority Welsh-speaking communities. [19] The Welsh language became grouped around a small cluster of chapels and churches, the most notable of which is Tabernacl in the city centre, one of four UK churches chosen to hold official services to commemorate the new millennium. Following the establishment of the city's first Welsh School (Ysgol Gymraeg Bryntaf) in the 1950s, Welsh has slowly regained some ground. [20] Aided by Welsh-medium education and migration from other parts of Wales, the number of Welsh speakers in Cardiff rose by 14,451 between 1991 and 2001; Welsh is now spoken by 11% of Cardiffians. The highest percentage of Welsh speakers is in Pentyrch, where 15.9% of the population speak the language. [21]
In addition to English and Welsh, the diversity of Cardiff's population (including foreign students) means that a large number of languages are spoken within the city. One study has found that Cardiff has speakers of at least 94 languages, with Somali, Urdu, Bengali and Arabic being the most commonly spoken foreign languages. [22]
The modern Cardiff accent is distinct from that of the nearby South Wales Valleys. It is marked primarily by:
Owing to its diversity, large student population, and convenient size and location, Cardiff has seen a rise in the number of people coming to the city to learn English. Foreign students are a common sight on the streets of Cardiff with a large percentage coming from Arabic and other European countries. [1] The British Council has an office in the city centre and there are six accredited schools in the area. [25]
At the 2011 census, there were the following national identities:


Since 1922 Cardiff has included the suburban cathedral City of Llandaff, whose bishop is also Archbishop of Wales since 2002. There is also a Roman Catholic cathedral in the city. Since 1916 Cardiff has been the seat of a Catholic archbishop, but there appears to have been a fall in the estimated Catholic population, with estimated numbers in 2006 being around 25,000 less than in 1980. [26] Likewise, the Jewish population of the city also appears to have fallen—there are two synagogues in Cardiff, one in Cyncoed and one in Moira Terrace, as opposed to seven at the turn of the 20th century. [27] There are a significant number of nonconformist chapels, an early-20th century Greek Orthodox church and 11 mosques. [28] [29] [30] In the 2001 census 66.9% of Cardiff's population described itself as Christian, a percentage point below the Welsh and UK averages.
In the 2001 census Cardiff's Muslim population stood at 3.7%, above the UK average (2.7%) and significantly above the Welsh average. Cardiff has one of the longest-established Muslim populations in the UK, started by Yemeni sailors who settled in the city during the 19th century. [31] The first mosque in the UK (on the site of what is now known as the Al-Manar Islamic Centre) opened in 1860 in the Cathays district of Cardiff. [32] Cardiff is now home to over 11,000 Muslims from many different nationalities and backgrounds, [33] nearly 52 per cent of the Welsh Muslim population. [34]

The oldest of the non-Christian communities in Wales is Judaism. Jews were not permitted to live in Wales between the 1290 Edict of Expulsion—given by Edward I of England—and the seventeenth century. A Welsh Jewish community was re-established in the eighteenth century. [35] There was once a fairly substantial Jewish population in South Wales, most of which has disappeared. The modern community is centred in the Cardiff United Synagogue.
The proportion of Cardiff residents declaring themselves to be Hindu, Sikh and Jewish were all considerably higher than the Welsh averages, but less than the UK figures. The city has been home to a sizeable Hindu community since Indian immigrants settled there during the 1950s and 1960s. The first Hindu temple in the city was opened in Grangetown on 6 April 1979 on the site of an abandoned printing press (which itself was the former site of a synagogue). [36] The 25th anniversary of the temple's founding was celebrated in September 2007 with a parade of over 3000 people through the city centre, including Hindus from across the United Kingdom and members of Cardiff's other religious communities. [37] Today, there are over 2000 Hindus in Cardiff, worshiping at three temples across the city. [33]
In the 2001 census, 18.8% of the city's population stated they had no religion, while 8.6% did not state a religion. [38]
| Religion | 2001 [39] | 2011 [40] | 2021 [41] | |||
|---|---|---|---|---|---|---|
| Number | % | Number | % | Number | % | |
| No religion | 57,440 | 18.8 | 109,960 | 31.8 | 155,589 | 42.9 |
| | 204,359 | 66.9 | 177,743 | 51.4 | 138,885 | 38.3 |
| | 11,261 | 3.7 | 23,656 | 6.8 | 33,650 | 9.3 |
| | 2,392 | 0.8 | 4,736 | 1.4 | 5,434 | 1.5 |
| | 1,004 | 0.3 | 1,690 | 0.5 | 1,630 | 0.4 |
| | 928 | 0.3 | 1,317 | 0.4 | 1,517 | 0.4 |
| | 941 | 0.3 | 802 | 0.2 | 690 | 0.2 |
| Other religion | 760 | 0.2 | 1,406 | 0.4 | 2,028 | 0.6 |
| Religion not stated | 26,268 | 8.6 | 24,780 | 7.2 | 22,888 | 6.3 |
| Total population | 305,353 | 100.0 | 346,090 | 100.0 | 362,400 | 100.0 |

Cardiff is the capital and largest city of Wales. Cardiff had a population of 362,310 in 2021 and forms a principal area officially known as the City and County of Cardiff. The city is the eleventh largest in the United Kingdom. Located in the southeast of Wales and in the Cardiff Capital Region, Cardiff is the county town of the historic county of Glamorgan and in 1974–1996 of South Glamorgan. It belongs to the Eurocities network of the largest European cities. A small town until the early 19th century, its prominence as a port for coal when mining began in the region helped its expansion. In 1905, it was ranked as a city and in 1955 proclaimed capital of Wales. Cardiff Built-up Area covers a larger area outside the county boundary, including the towns of Dinas Powys and Penarth.

Swansea is a coastal city and the second-largest city of Wales. It forms a principal area, officially known as the City and County of Swansea.
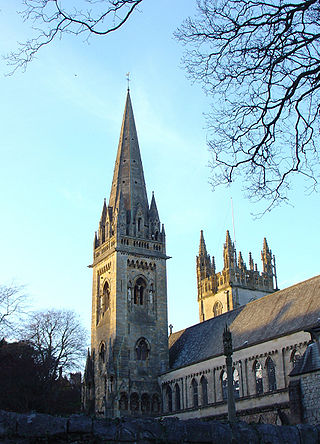
Llandaff is a district, community and coterminous electoral ward in the north of Cardiff, capital of Wales. It was incorporated into the city in 1922. It is the seat of the Bishop of Llandaff, whose diocese within the Church in Wales covers the most populous area of Wales.
Wales is a country that is part of the United Kingdom. It is bordered by the Irish Sea to the north and west, England to the east, the Bristol Channel to the south, and the Celtic Sea to the south-west. As of the 2021 census, it had a population of 3,107,494. It has a total area of 21,218 square kilometres (8,192 sq mi) and over 2,700 kilometres (1,680 mi) of coastline. It is largely mountainous with its higher peaks in the north and central areas, including Snowdon, its highest summit. The country lies within the north temperate zone and has a changeable, maritime climate. The capital and largest city is Cardiff.

Demographics of Wales include the numbers in population, place of birth, age, ethnicity, religion, and number of marriages in Wales.
A nationwide census, known as Census 2001, was conducted in the United Kingdom on Sunday, 29 April 2001. This was the 20th UK census and recorded a resident population of 58,789,194.

Butetown is a district and community in the south of the city of Cardiff, the capital of Wales. It was originally a model housing estate built in the early 19th century by the 2nd Marquess of Bute, for whose title the area was named.

British society is one of the most secularised in the world and in many surveys determining religious beliefs of the population agnosticism, nontheism, atheism, secular humanism, and non-affiliation are views shared by a majority of Britons. Historically, it was dominated for over 1,400 years by various forms of Christianity, which replaced preceding Romano-British religions, including Celtic and Anglo-Saxon paganism. Religious affiliations of United Kingdom citizens are recorded by regular surveys, the four major ones being the national decennial census, the Labour Force Survey, the British Social Attitudes survey and the European Social Survey.
The Welsh are an ethnic group native to Wales. Wales is one of the four countries of the United Kingdom. The majority of people living in Wales are British citizens.
The United Kingdom is an ethnically diverse society. The largest ethnic group in the United Kingdom is White British, followed by Asian British. Ethnicity in the United Kingdom is formally recorded at the national level through a census. The 2011 United Kingdom census recorded a reduced share of White British people in the United Kingdom from the previous 2001 United Kingdom census. Factors that are contributing to the growth of minority populations are varied in nature, including differing birth rates and Immigration.

The demography of London is analysed by the Office for National Statistics and data is produced for each of the Greater London wards, the City of London and the 32 London boroughs, the Inner London and Outer London statistical sub-regions, each of the Parliamentary constituencies in London, and for all of Greater London as a whole. Additionally, data is produced for the Greater London Urban Area. Statistical information is produced about the size and geographical breakdown of the population, the number of people entering and leaving country and the number of people in each demographic subgroup. The total population of London as of 2021 is 8,799,800.

Islam is a minority faith in Wales followed by 2.2 % of its population with about 64,000 adherents recorded as per 2021 Census up from about 46,000 adherents in the 2011 Census. The earliest recorded connections between Wales and the Muslim world dates back to the early 12th Century. There has been a Somali and Yemeni Islamic community in Cardiff since the mid-19th century, founded by seafarers to Cardiff Docks. The first purpose-built mosque was erected in Cardiff in 1947.
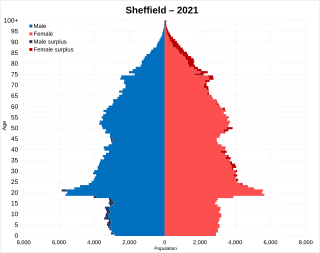
The latest (2021) population estimate for the City of Sheffield is 554,401 residents. This represents an increase of about 17,000 people since the last census in 2011.
Religion in Wales has, over the years, become increasingly diverse. Christianity was the religion of virtually all of the Welsh population until the late 20th century, but it has rapidly declined throughout the early 21st century. Today a plurality (46.5%) of people in Wales follow no religion at all.
British Iraqis are British citizens who originate from Iraq.

British Arabs are British citizens of Arab descent. They share a common Arab ethnicity, culture, language and identity from different Arab countries. Arabs also come from non-Arab countries as ethnic minorities.
Yemenis in the United Kingdom or Yemeni Britons include citizens and non-citizen immigrants in the United Kingdom of Yemeni ancestry, as well as their descendants. Yemenis have been present in the UK since at least the 1860s, with the first Yemenis arriving as sailors and dock workers in the port cities of Northern England and Wales, and despite a smaller population than other British Muslim groups, are likely the longest-established Muslim group in the United Kingdom, with many of these cities retaining a Yemeni population going back several generations.
A census of the population of the United Kingdom is taken every ten years. The 2011 census was held in all counties of the UK on 27 March 2011. It was the first UK census which could be completed online via the Internet. The Office for National Statistics (ONS) is responsible for the census in England and Wales, the General Register Office for Scotland (GROS) is responsible for the census in Scotland, and the Northern Ireland Statistics and Research Agency (NISRA) is responsible for the census in Northern Ireland.
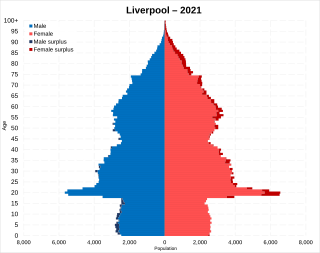
The demography of Liverpool is officially analysed by the Office for National Statistics. The Liverpool City Region is made up of Liverpool alongside the Metropolitan Boroughs of Halton, Knowsley, Sefton, St Helens, and the Wirral. With a population of around 496,784, Liverpool is the largest settlement in the region and the sixth largest in the United Kingdom.
The Butetown electoral ward of Cardiff covers the Cardiff Bay area of the city, electing a councillor to Cardiff Council.
{{cite web}}: Missing or empty |title= (help){{cite book}}: CS1 maint: location missing publisher (link)| Physical | |||||||
|---|---|---|---|---|---|---|---|
| Environment | |||||||
| Land use | |||||||
| Administrative |
| ||||||
| Social | |||||||
| Other | |||||||