| |||||||||||||||||||||||||||||||||
Turnout | 50.1% [1] | ||||||||||||||||||||||||||||||||
---|---|---|---|---|---|---|---|---|---|---|---|---|---|---|---|---|---|---|---|---|---|---|---|---|---|---|---|---|---|---|---|---|---|
| |||||||||||||||||||||||||||||||||
County and Independent City Results
| |||||||||||||||||||||||||||||||||
|
Elections in Virginia |
---|
The 1968 United States presidential election in Virginia took place on November 5, 1968. All 50 states and the District of Columbia were part of the 1968 United States presidential election. Virginia voters chose twelve electors to the Electoral College, which selected the president and vice president of the United States.
For over sixty years Virginia had had the most restricted electorate in the United States due to a cumulative poll tax and literacy tests. [2] Virginia would be almost entirely controlled by the conservative Democratic Byrd Organization for four decades, [3] although during the Organization’s last twenty years of controlling the state it would direct many Virginia voters away from the national Democratic Party due to opposition to black civil rights and to the fiscal liberalism of the New Deal. [4] After the Twenty-Fourth Amendment and Harper v. Virginia State Board of Elections the state’s electorate would substantially expand since the lower classes were no longer burdened by poll taxes. At the same time, the postwar Republican trend of the Northeast-aligned Washington D.C. and Richmond suburbs, which had begun as early as 1944, would accelerate [5] and become intensified by the mobilisation of working-class Piedmont whites against a national Democratic Party strongly associated with black interests. [6]
51% of white voters supported Nixon, 28% supported Wallace, and 21% supported Humphrey. [7] [8] [9]
The following newspapers gave these predictions about how Virginia would vote in the 1968 presidential election:
Source | Ranking | As of |
---|---|---|
Fort Worth Star-Telegram [10] | Tossup | September 14, 1968 |
Pensacola News Journal [11] | Tilt R (flip) | September 23, 1968 |
Daily Press [12] | Lean R (flip) | October 11, 1968 |
The Charlotte News [13] | Likely R (flip) | October 12, 1968 |
Shreveport Times [14] | Lean R (flip) | November 3, 1968 |
The Selma Times-Journal [15] | Likely R (flip) | November 3, 1968 |
The Roanoke Times [16] | Likely R (flip) | November 3, 1968 |
Fort Lauderdale News [17] | Likely R (flip) | November 4, 1968 |
Virginia was won by Republican nominee and former Vice President Richard Nixon of California with 43.41 percent of the vote, against incumbent Vice President Hubert Humphrey of Minnesota with 32.53 percent and former Alabama Governor George Wallace who gained 23.55 percent. Nixon also won the national election with 43.42 percent of the vote. Regardless, all candidates had strong regional support in the state; Nixon's votes came mostly from Northern Virginia and the Appalachian Mountain areas, while Humphrey's votes were mainly from the Tidewater region and unionized coal counties in Southwest Virginia, [18] which had both benefited from increased voter registration under the Voting Rights Act and been centres of opposition to the Byrd Organization in previous generations. Wallace received his core support in the Southern Virginia counties, [19] where the core of Byrd machine power had been located. [20]
As of the 2020 presidential election [update] , this is the last occasion when Powhatan County voted for a Democratic presidential candidate. It is also the last occasion when Lunenburg County, Mecklenburg County and Pittsylvania County have not voted for the Republican nominee. [21] Essex County would not vote Democratic again until 1996, and James City County would not vote Democratic again until 2020. [22]
Nixon’s victory was the first of ten consecutive Republican victories in the state, as Virginia would not vote for a Democratic candidate again until Barack Obama in 2008. Since 2008, Virginia has consistently voted for the Democratic presidential candidate. Nixon was the first Republican to ever carry Amherst and Craig counties, the first since Warren G. Harding in 1920 to carry Dickenson County and Russell County, and the first since Herbert Hoover in 1928 to carry Patrick County. [22]
1968 United States presidential election in Virginia [23] | |||||
---|---|---|---|---|---|
Party | Candidate | Votes | Percentage | Electoral votes | |
Republican | Richard Nixon | 590,319 | 43.41% | 12 | |
Democratic | Hubert Humphrey | 442,387 | 32.53% | 0 | |
American Independent | George Wallace | 320,272 | 23.55% | 0 | |
Socialist Labor | Henning A. Blomen | 4,671 | 0.34% | 0 | |
Peace and Freedom | Dick Gregory | 1,680 | 0.12% | 0 | |
Prohibition | E. Harold Munn | 599 | 0.04% | 0 | |
Totals | 1,359,928 | 100.00% | 12 |
1968 United States presidential election in Virginia by counties and independent cities | |||||||||||
---|---|---|---|---|---|---|---|---|---|---|---|
Richard Milhous Nixon Republican | Hubert Horatio Humphrey Democratic | George Corley Wallace American Independent | Various candidates Other parties | Margin | Total votes cast | ||||||
# | % | # | % | # | % | # | % | # | % | ||
Accomack County | 3,231 | 35.19% | 2,467 | 26.87% | 3,460 | 37.69% | 23 | 0.25% | -229 [lower-alpha 2] | -2.49% | 9,181 |
Albemarle County | 4,512 | 53.45% | 2,255 | 26.71% | 1,657 | 19.63% | 17 | 0.20% | 2,257 | 26.74% | 8,441 |
Alleghany County | 1,649 | 43.47% | 988 | 26.05% | 1,153 | 30.40% | 3 | 0.08% | 496 [lower-alpha 2] | 13.08% | 3,793 |
Amelia County | 857 | 33.90% | 830 | 32.83% | 832 | 32.91% | 9 | 0.36% | 25 [lower-alpha 2] | 0.99% | 2,528 |
Amherst County | 2,656 | 39.80% | 1,543 | 23.12% | 2,449 | 36.69% | 26 | 0.39% | 207 [lower-alpha 2] | 3.10% | 6,674 |
Appomattox County | 1,753 | 43.42% | 756 | 18.73% | 1,512 | 37.45% | 16 | 0.40% | 241 [lower-alpha 2] | 5.97% | 4,037 |
Arlington County | 28,163 | 45.92% | 26,107 | 42.57% | 6,746 | 11.00% | 310 | 0.51% | 2,056 | 3.35% | 61,326 |
Augusta County | 6,313 | 57.92% | 2,028 | 18.61% | 2,483 | 22.78% | 76 | 0.70% | 3,830 [lower-alpha 2] | 35.14% | 10,900 |
Bath County | 872 | 45.97% | 494 | 26.04% | 529 | 27.89% | 2 | 0.11% | 343 [lower-alpha 2] | 18.08% | 1,897 |
Bedford County | 2,807 | 35.80% | 1,574 | 20.08% | 3,316 | 42.30% | 143 | 1.82% | -509 [lower-alpha 2] | -6.49% | 7,840 |
Bland County | 938 | 50.38% | 560 | 30.08% | 361 | 19.39% | 3 | 0.16% | 378 | 20.30% | 1,862 |
Botetourt County | 2,598 | 50.54% | 1,272 | 24.75% | 1,267 | 24.65% | 3 | 0.06% | 1,326 | 25.80% | 5,140 |
Brunswick County | 1,139 | 22.13% | 1,910 | 37.11% | 2,088 | 40.57% | 10 | 0.19% | -178 [lower-alpha 3] | -3.46% | 5,147 |
Buchanan County | 3,699 | 37.68% | 5,003 | 50.97% | 1,067 | 10.87% | 47 | 0.48% | -1,304 | -13.28% | 9,816 |
Buckingham County | 1,027 | 32.05% | 984 | 30.71% | 1,185 | 36.99% | 8 | 0.25% | -158 [lower-alpha 2] | -4.93% | 3,204 |
Campbell County | 5,731 | 44.73% | 1,996 | 15.58% | 4,425 | 34.54% | 659 | 5.14% | 1,306 [lower-alpha 2] | 10.19% | 12,811 |
Caroline County | 1,162 | 26.25% | 2,165 | 48.92% | 1,084 | 24.49% | 15 | 0.34% | -1,003 | -22.66% | 4,426 |
Carroll County | 4,909 | 64.16% | 1,773 | 23.17% | 958 | 12.52% | 11 | 0.14% | 3,136 | 40.99% | 7,651 |
Charles City County | 320 | 16.33% | 1,457 | 74.34% | 176 | 8.98% | 7 | 0.36% | -1,137 | -58.01% | 1,960 |
Charlotte County | 1,042 | 24.43% | 1,045 | 24.50% | 2,163 | 50.72% | 15 | 0.35% | -1,118 [lower-alpha 3] | -26.21% | 4,265 |
Chesterfield County | 22,015 | 56.03% | 5,715 | 14.54% | 11,504 | 29.28% | 58 | 0.15% | 10,511 [lower-alpha 2] | 26.75% | 39,292 |
Clarke County | 1,127 | 42.62% | 768 | 29.05% | 742 | 28.06% | 7 | 0.26% | 359 | 13.58% | 2,644 |
Craig County | 581 | 46.18% | 419 | 33.31% | 256 | 20.35% | 2 | 0.16% | 162 | 12.88% | 1,258 |
Culpeper County | 2,229 | 47.49% | 1,239 | 26.40% | 1,217 | 25.93% | 9 | 0.19% | 990 | 21.09% | 4,694 |
Cumberland County | 844 | 34.70% | 978 | 40.21% | 602 | 24.75% | 8 | 0.33% | -134 | -5.51% | 2,432 |
Dickenson County | 3,412 | 46.01% | 3,355 | 45.25% | 639 | 8.62% | 9 | 0.12% | 57 | 0.77% | 7,415 |
Dinwiddie County | 1,451 | 27.60% | 1,551 | 29.50% | 2,245 | 42.70% | 10 | 0.19% | -694 [lower-alpha 3] | -13.20% | 5,257 |
Essex County | 791 | 36.55% | 897 | 41.45% | 468 | 21.63% | 8 | 0.37% | -106 | -4.90% | 2,164 |
Fairfax County | 57,462 | 48.98% | 44,796 | 38.18% | 14,805 | 12.62% | 256 | 0.22% | 12,666 | 10.80% | 117,319 |
Fauquier County | 2,845 | 43.76% | 2,099 | 32.29% | 1,536 | 23.63% | 21 | 0.32% | 746 | 11.48% | 6,501 |
Floyd County | 2,275 | 64.32% | 715 | 20.21% | 537 | 15.18% | 10 | 0.28% | 1,560 | 44.11% | 3,537 |
Fluvanna County | 913 | 42.56% | 569 | 26.53% | 660 | 30.77% | 3 | 0.14% | 253 [lower-alpha 2] | 11.79% | 2,145 |
Franklin County | 3,036 | 36.54% | 2,025 | 24.37% | 3,219 | 38.75% | 28 | 0.34% | -183 [lower-alpha 2] | -2.20% | 8,308 |
Frederick County | 3,696 | 49.58% | 1,612 | 21.63% | 2,137 | 28.67% | 9 | 0.12% | 1,559 [lower-alpha 2] | 20.91% | 7,454 |
Giles County | 2,722 | 43.36% | 2,045 | 32.58% | 1,372 | 21.86% | 138 | 2.20% | 677 | 10.79% | 6,277 |
Gloucester County | 1,619 | 37.10% | 1,210 | 27.73% | 1,526 | 34.97% | 9 | 0.21% | 93 [lower-alpha 2] | 2.13% | 4,364 |
Goochland County | 1,216 | 35.13% | 1,389 | 40.13% | 836 | 24.15% | 20 | 0.58% | -173 | -5.00% | 3,461 |
Grayson County | 3,563 | 54.09% | 1,926 | 29.24% | 1,090 | 16.55% | 8 | 0.12% | 1,637 | 24.85% | 6,587 |
Greene County | 856 | 55.26% | 255 | 16.46% | 433 | 27.95% | 5 | 0.32% | 423 [lower-alpha 2] | 27.31% | 1,549 |
Greensville County | 529 | 16.71% | 1,367 | 43.19% | 1,256 | 39.68% | 13 | 0.41% | 111 [lower-alpha 3] | 3.51% | 3,165 |
Halifax County | 2,634 | 28.94% | 2,199 | 24.16% | 4,235 | 46.53% | 34 | 0.37% | -1,601 [lower-alpha 2] | -17.59% | 9,102 |
Hanover County | 5,425 | 50.01% | 2,079 | 19.17% | 3,330 | 30.70% | 13 | 0.12% | 2,095 [lower-alpha 2] | 19.31% | 10,847 |
Henrico County | 34,212 | 62.52% | 8,600 | 15.71% | 11,868 | 21.69% | 46 | 0.08% | 22,344 [lower-alpha 2] | 40.83% | 54,726 |
Henry County | 3,946 | 25.92% | 4,175 | 27.42% | 6,802 | 44.68% | 301 | 1.98% | -2,627 [lower-alpha 3] | -17.26% | 15,224 |
Highland County | 619 | 57.90% | 284 | 26.57% | 166 | 15.53% | 0 | 0.00% | 335 | 31.34% | 1,069 |
Isle of Wight County | 1,312 | 23.28% | 1,977 | 35.08% | 2,328 | 41.31% | 18 | 0.32% | -351 [lower-alpha 3] | -6.23% | 5,635 |
James City County | 1,443 | 35.50% | 1,521 | 37.42% | 1,083 | 26.64% | 18 | 0.44% | -78 | -1.92% | 4,065 |
King and Queen County | 568 | 27.40% | 882 | 42.55% | 614 | 29.62% | 9 | 0.43% | 268 [lower-alpha 3] | 12.93% | 2,073 |
King George County | 829 | 37.77% | 730 | 33.26% | 632 | 28.79% | 4 | 0.18% | 99 | 4.51% | 2,195 |
King William County | 1,046 | 43.03% | 764 | 31.43% | 615 | 25.30% | 6 | 0.25% | 282 | 11.60% | 2,431 |
Lancaster County | 1,640 | 44.93% | 1,134 | 31.07% | 876 | 24.00% | 0 | 0.00% | 506 | 13.86% | 3,650 |
Lee County | 4,450 | 47.35% | 4,105 | 43.67% | 827 | 8.80% | 17 | 0.18% | 345 | 3.67% | 9,399 |
Loudoun County | 4,577 | 45.91% | 3,262 | 32.72% | 2,117 | 21.23% | 14 | 0.14% | 1,315 | 13.19% | 9,970 |
Louisa County | 1,510 | 38.09% | 1,290 | 32.54% | 1,149 | 28.99% | 15 | 0.38% | 220 | 5.55% | 3,964 |
Lunenburg County | 1,181 | 29.44% | 1,180 | 29.41% | 1,630 | 40.63% | 21 | 0.52% | -449 [lower-alpha 2] | -11.19% | 4,012 |
Madison County | 1,188 | 48.71% | 478 | 19.60% | 763 | 31.28% | 10 | 0.41% | 425 [lower-alpha 2] | 17.43% | 2,439 |
Mathews County | 1,309 | 47.14% | 691 | 24.88% | 773 | 27.84% | 4 | 0.14% | 536 [lower-alpha 2] | 19.30% | 2,777 |
Mecklenburg County | 2,750 | 29.01% | 2,667 | 28.14% | 4,022 | 42.44% | 39 | 0.41% | -1,272 [lower-alpha 2] | -13.42% | 9,478 |
Middlesex County | 809 | 39.62% | 575 | 28.16% | 655 | 32.08% | 3 | 0.15% | 154 [lower-alpha 2] | 7.54% | 2,042 |
Montgomery County | 7,098 | 61.47% | 2,700 | 23.38% | 1,712 | 14.83% | 37 | 0.32% | 4,398 | 38.09% | 11,547 |
Nansemond County | 2,101 | 20.94% | 4,174 | 41.60% | 3,723 | 37.11% | 35 | 0.35% | 451 [lower-alpha 3] | 4.50% | 10,033 |
Nelson County | 1,130 | 32.98% | 1,120 | 32.69% | 1,163 | 33.95% | 13 | 0.38% | -33 [lower-alpha 2] | -0.96% | 3,426 |
New Kent County | 526 | 27.63% | 765 | 40.18% | 609 | 31.99% | 4 | 0.21% | 156 [lower-alpha 3] | 8.19% | 1,904 |
Northampton County | 1,410 | 35.48% | 1,418 | 35.68% | 1,129 | 28.41% | 17 | 0.43% | -8 | -0.20% | 3,974 |
Northumberland County | 1,438 | 41.18% | 1,077 | 30.84% | 968 | 27.72% | 9 | 0.26% | 361 | 10.34% | 3,492 |
Nottoway County | 1,614 | 33.42% | 1,529 | 31.66% | 1,673 | 34.64% | 14 | 0.29% | -59 [lower-alpha 2] | -1.22% | 4,830 |
Orange County | 1,727 | 47.17% | 879 | 24.01% | 1,050 | 28.68% | 5 | 0.14% | 677 [lower-alpha 2] | 18.49% | 3,661 |
Page County | 3,667 | 53.93% | 2,125 | 31.25% | 995 | 14.63% | 13 | 0.19% | 1,542 | 22.68% | 6,800 |
Patrick County | 2,187 | 41.46% | 1,105 | 20.95% | 1,974 | 37.42% | 9 | 0.17% | 213 [lower-alpha 2] | 4.04% | 5,275 |
Pittsylvania County | 5,096 | 25.62% | 5,427 | 27.29% | 9,302 | 46.77% | 65 | 0.33% | -3,875 [lower-alpha 3] | -19.48% | 19,890 |
Powhatan County | 722 | 27.11% | 1,004 | 37.70% | 929 | 34.89% | 8 | 0.30% | 75 [lower-alpha 3] | 2.82% | 2,663 |
Prince Edward County | 1,857 | 39.80% | 1,567 | 33.58% | 1,224 | 26.23% | 18 | 0.39% | 290 | 6.22% | 4,666 |
Prince George County | 1,559 | 32.75% | 1,272 | 26.72% | 1,920 | 40.33% | 10 | 0.21% | -361 [lower-alpha 2] | -7.58% | 4,761 |
Prince William County | 7,944 | 42.51% | 5,566 | 29.79% | 5,160 | 27.61% | 16 | 0.09% | 2,378 | 12.73% | 18,686 |
Pulaski County | 4,409 | 53.35% | 2,497 | 30.21% | 1,346 | 16.29% | 13 | 0.16% | 1,912 | 23.13% | 8,265 |
Rappahannock County | 594 | 43.58% | 394 | 28.91% | 372 | 27.29% | 3 | 0.22% | 200 | 14.67% | 1,363 |
Richmond County | 1,011 | 48.86% | 490 | 23.68% | 563 | 27.21% | 5 | 0.24% | 448 [lower-alpha 2] | 21.65% | 2,069 |
Roanoke County | 12,439 | 58.89% | 3,902 | 18.47% | 4,745 | 22.46% | 38 | 0.18% | 7,694 [lower-alpha 2] | 36.42% | 21,124 |
Rockbridge County | 2,280 | 56.80% | 845 | 21.05% | 885 | 22.05% | 4 | 0.10% | 1,395 [lower-alpha 2] | 34.75% | 4,014 |
Rockingham County | 7,779 | 66.40% | 2,111 | 18.02% | 1,817 | 15.51% | 8 | 0.07% | 5,668 | 48.38% | 11,715 |
Russell County | 3,858 | 43.49% | 3,554 | 40.06% | 1,369 | 15.43% | 91 | 1.03% | 304 | 3.43% | 8,872 |
Scott County | 5,345 | 53.54% | 3,144 | 31.49% | 1,474 | 14.76% | 21 | 0.21% | 2,201 | 22.05% | 9,984 |
Shenandoah County | 5,461 | 62.91% | 1,654 | 19.05% | 1,561 | 17.98% | 5 | 0.06% | 3,807 | 43.85% | 8,681 |
Smyth County | 5,297 | 54.32% | 2,631 | 26.98% | 1,808 | 18.54% | 15 | 0.15% | 2,666 | 27.34% | 9,751 |
Southampton County | 1,376 | 26.15% | 1,803 | 34.26% | 2,070 | 39.34% | 13 | 0.25% | -267 [lower-alpha 3] | -5.07% | 5,262 |
Spotsylvania County | 1,675 | 34.00% | 1,647 | 33.43% | 1,589 | 32.26% | 15 | 0.30% | 28 | 0.57% | 4,926 |
Stafford County | 2,572 | 39.68% | 1,698 | 26.20% | 2,197 | 33.89% | 15 | 0.23% | 375 [lower-alpha 2] | 5.79% | 6,482 |
Surry County | 523 | 22.10% | 1,126 | 47.59% | 708 | 29.92% | 9 | 0.38% | 418 [lower-alpha 3] | 17.67% | 2,366 |
Sussex County | 1,105 | 29.12% | 1,541 | 40.62% | 1,135 | 29.92% | 13 | 0.34% | 406 [lower-alpha 3] | 10.70% | 3,794 |
Tazewell County | 4,434 | 39.11% | 4,734 | 41.75% | 2,023 | 17.84% | 147 | 1.30% | -300 | -2.65% | 11,338 |
Warren County | 2,297 | 43.37% | 1,513 | 28.57% | 1,479 | 27.93% | 7 | 0.13% | 784 | 14.80% | 5,296 |
Washington County | 6,665 | 51.16% | 3,243 | 24.89% | 3,092 | 23.73% | 29 | 0.22% | 3,422 | 26.26% | 13,029 |
Westmoreland County | 1,402 | 39.99% | 1,156 | 32.97% | 943 | 26.90% | 5 | 0.14% | 246 | 7.02% | 3,506 |
Wise County | 5,004 | 39.70% | 5,942 | 47.14% | 1,635 | 12.97% | 25 | 0.20% | -938 | -7.44% | 12,606 |
Wythe County | 3,638 | 52.25% | 1,765 | 25.35% | 1,377 | 19.78% | 183 | 2.63% | 1,873 | 26.90% | 6,963 |
York County | 3,356 | 36.93% | 2,370 | 26.08% | 3,330 | 36.64% | 32 | 0.35% | 26 [lower-alpha 2] | 0.29% | 9,088 |
Alexandria City | 13,265 | 41.69% | 14,351 | 45.11% | 4,131 | 12.98% | 69 | 0.22% | -1,086 | -3.41% | 31,816 |
Bedford City | 1,047 | 43.99% | 569 | 23.91% | 679 | 28.53% | 85 | 3.57% | 368 [lower-alpha 2] | 15.46% | 2,380 |
Bristol City | 1,930 | 44.09% | 1,531 | 34.98% | 911 | 20.81% | 5 | 0.11% | 399 | 9.12% | 4,377 |
Buena Vista City | 814 | 49.04% | 387 | 23.31% | 456 | 27.47% | 3 | 0.18% | 358 [lower-alpha 2] | 21.57% | 1,660 |
Charlottesville City | 5,601 | 49.41% | 3,831 | 33.80% | 1,781 | 15.71% | 122 | 1.08% | 1,770 | 15.62% | 11,335 |
Chesapeake City | 6,234 | 25.18% | 6,843 | 27.64% | 11,084 | 44.77% | 599 | 2.42% | -4,241 [lower-alpha 3] | -17.13% | 24,760 |
Clifton Forge City | 925 | 43.59% | 734 | 34.59% | 462 | 21.77% | 1 | 0.05% | 191 | 9.00% | 2,122 |
Colonial Heights City | 2,650 | 48.96% | 650 | 12.01% | 2,106 | 38.91% | 7 | 0.13% | 544 [lower-alpha 2] | 10.05% | 5,413 |
Covington City | 1,551 | 43.14% | 1,195 | 33.24% | 846 | 23.53% | 3 | 0.08% | 356 | 9.90% | 3,595 |
Danville City | 6,796 | 40.27% | 4,495 | 26.64% | 5,391 | 31.95% | 192 | 1.14% | 1,405 [lower-alpha 2] | 8.33% | 16,874 |
Emporia City | 812 | 37.06% | 657 | 29.99% | 716 | 32.68% | 6 | 0.27% | 96 [lower-alpha 2] | 4.38% | 2,191 |
Fairfax City | 2,963 | 48.70% | 2,153 | 35.39% | 959 | 15.76% | 9 | 0.15% | 810 | 13.31% | 6,084 |
Falls Church City | 2,005 | 45.76% | 1,860 | 42.45% | 504 | 11.50% | 13 | 0.30% | 145 | 3.31% | 4,382 |
Franklin City | 951 | 42.15% | 792 | 35.11% | 511 | 22.65% | 2 | 0.09% | 159 | 7.05% | 2,256 |
Fredericksburg City | 2,142 | 42.27% | 2,036 | 40.17% | 878 | 17.32% | 12 | 0.24% | 106 | 2.09% | 5,068 |
Galax City | 1,257 | 54.44% | 748 | 32.39% | 304 | 13.17% | 0 | 0.00% | 509 | 22.04% | 2,309 |
Hampton City | 10,532 | 32.30% | 11,308 | 34.68% | 10,690 | 32.79% | 76 | 0.23% | 618 [lower-alpha 3] | 1.90% | 32,606 |
Harrisonburg City | 2,859 | 65.69% | 1,036 | 23.81% | 453 | 10.41% | 4 | 0.09% | 1,823 | 41.89% | 4,352 |
Hopewell City | 2,942 | 43.63% | 1,568 | 23.25% | 2,092 | 31.02% | 141 | 2.09% | 850 [lower-alpha 2] | 12.61% | 6,743 |
Lexington City | 1,170 | 56.12% | 734 | 35.20% | 177 | 8.49% | 4 | 0.19% | 436 | 20.91% | 2,085 |
Lynchburg City | 9,943 | 54.34% | 4,305 | 23.53% | 3,649 | 19.94% | 402 | 2.20% | 5,638 | 30.81% | 18,299 |
Martinsville City | 2,618 | 35.98% | 2,727 | 37.48% | 1,856 | 25.51% | 75 | 1.03% | -109 | -1.50% | 7,276 |
Newport News City | 12,774 | 34.46% | 13,370 | 36.07% | 10,763 | 29.04% | 162 | 0.44% | -596 | -1.61% | 37,069 |
Norfolk City | 22,302 | 33.88% | 28,477 | 43.26% | 14,500 | 22.03% | 550 | 0.84% | -6,175 | -9.38% | 65,829 |
Norton City | 495 | 39.07% | 555 | 43.80% | 215 | 16.97% | 2 | 0.16% | -60 | -4.74% | 1,267 |
Petersburg City | 3,478 | 31.14% | 5,519 | 49.41% | 2,158 | 19.32% | 14 | 0.13% | -2,041 | -18.27% | 11,169 |
Portsmouth City | 9,402 | 25.15% | 15,734 | 42.09% | 12,127 | 32.44% | 118 | 0.32% | 3,607 [lower-alpha 3] | 9.65% | 37,381 |
Radford City | 2,077 | 55.40% | 1,206 | 32.17% | 461 | 12.30% | 5 | 0.13% | 871 | 23.23% | 3,749 |
Richmond City | 26,380 | 39.57% | 32,857 | 49.28% | 7,325 | 10.99% | 106 | 0.16% | -6,477 | -9.72% | 66,668 |
Roanoke City | 15,368 | 51.21% | 9,281 | 30.93% | 5,269 | 17.56% | 90 | 0.30% | 6,087 | 20.28% | 30,008 |
Salem City | 3,955 | 57.77% | 1,369 | 20.00% | 1,507 | 22.01% | 15 | 0.22% | 2,448 [lower-alpha 2] | 35.76% | 6,846 |
South Boston City | 1,298 | 50.17% | 620 | 23.97% | 662 | 25.59% | 7 | 0.27% | 636 [lower-alpha 2] | 24.58% | 2,587 |
Staunton City | 4,434 | 61.40% | 1,729 | 23.94% | 1,054 | 14.60% | 4 | 0.06% | 2,705 | 37.46% | 7,221 |
Suffolk City | 1,277 | 37.95% | 1,044 | 31.03% | 1,039 | 30.88% | 5 | 0.15% | 233 | 6.92% | 3,365 |
Virginia Beach City | 16,316 | 43.23% | 10,101 | 26.76% | 10,962 | 29.04% | 363 | 0.96% | 5,354 [lower-alpha 2] | 14.19% | 37,742 |
Waynesboro City | 3,301 | 61.38% | 1,446 | 26.89% | 613 | 11.40% | 18 | 0.33% | 1,855 | 34.49% | 5,378 |
Williamsburg City | 1,156 | 46.73% | 991 | 40.06% | 247 | 9.98% | 80 | 3.23% | 165 | 6.67% | 2,474 |
Winchester City | 2,695 | 55.76% | 1,360 | 28.14% | 770 | 15.93% | 8 | 0.17% | 1,335 | 27.62% | 4,833 |
Totals | 590,319 | 43.36% | 442,387 | 32.49% | 321,833 | 23.64% | 6,952 | 0.51% | 147,932 | 10.87% | 1,361,491 |
The 1968 United States presidential election was the 46th quadrennial presidential election, held on Tuesday, November 5, 1968. The Republican nominee, former vice president Richard Nixon, defeated both the Democratic nominee, incumbent vice president Hubert Humphrey, and the American Independent Party nominee, former Alabama governor George Wallace. This was the last election until 1988 in which the incumbent president was not on the ballot. This is the most recent election where a third-party candidate won an electoral vote.
The 1968 United States presidential election in North Carolina took place on November 5, 1968, and was part of the 1968 United States presidential election. Voters chose 13 representatives, or electors to the Electoral College, who voted for president and vice president.
The 1960 United States presidential election in Virginia took place on November 8, 1960. Voters chose 12 representatives, or electors to the Electoral College, who voted for president and vice president.
The 1968 United States presidential election in New Mexico took place on November 5, 1968. All fifty states and The District of Columbia, were part of the 1968 United States presidential election. State voters chose four electors to represent them in the Electoral College, who voted for president and vice president.
The 1968 United States presidential election in New York took place on November 5, 1968. All 50 states and the District of Columbia, were part of the 1968 United States presidential election. Voters chose 43 electors to the Electoral College, which selected the president and vice president.
The 1968 United States presidential election in Alabama was held on November 5, 1968. In Alabama, voters voted for electors individually instead of as a slate, as in the other 49 states.
The 1968 United States presidential election in New Hampshire took place on November 5, 1968, as part of the 1968 United States presidential election, which was held throughout all 50 states and the District of Columbia. Voters chose four representatives, or electors to the Electoral College, who voted for president and vice president.
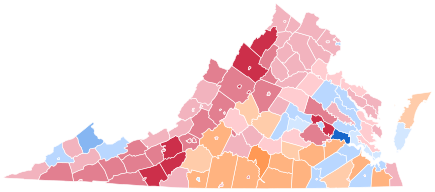
The 1980 United States presidential election in Virginia took place on November 4, 1980. All 50 states and the District of Columbia, were part of the 1980 United States presidential election. Virginia voters chose twelve electors to the Electoral College, which selected the president and vice president of the United States.
The 1972 United States presidential election in Virginia took place on November 7, 1972. All 50 states and the District of Columbia were part of the 1972 United States presidential election. Virginia voters chose 12 electors to the Electoral College, which selected the president and vice president of the United States. This was also the first presidential election after the passage of the Twenty-sixth Amendment, which decreased the voting age from 21 to 18.
The 1964 United States presidential election in Virginia took place on November 3, 1964. All 50 states and the District of Columbia were part of the 1964 United States presidential election. Virginia voters chose 12 electors to the Electoral College, which selected the president and vice president of the United States.
The 1968 United States presidential election in Maine took place on November 5, 1968, as part of the 1968 United States presidential election, which was held throughout all fifty states and D.C. Voters chose four representatives, or electors to the Electoral College, who voted for president and vice president.
The 1968 United States presidential election in Texas was held on November 5, 1968. All 50 states and the District of Columbia, were part of the 1968 United States presidential election. The state chose 25 electors to represent them in the Electoral College, who voted for president and vice president.
The 1972 United States presidential election in Florida was held on November 7, 1972, as part of the concurrent United States presidential election. Florida voters chose seventeen electors, or representatives to the Electoral College, who voted for president and vice president. Incumbent Republican President Richard Nixon won the state over the Democratic nominee, South Dakota Senator George McGovern, by a landslide margin of 44.11% and over one million votes.
The 1968 United States presidential election in South Carolina took place on November 5, 1968. All 50 states and the District of Columbia were part of the 1968 United States presidential election. South Carolina voters chose 8 electors to the Electoral College, who voted for president and vice president.
The 1968 United States presidential election in Mississippi was held on November 5, 1968. Mississippi voters chose seven electors, or representatives to the Electoral College, who voted for President and Vice-President. During the 1960s, the Civil Rights Movement dictated Mississippi's politics, with effectively the entire white population vehemently opposed to federal policies of racial desegregation and black voting rights. In 1960, the state had been narrowly captured by a slate of unpledged Democratic electors, but in 1964 universal white opposition to the Civil Rights Act and negligible black voter registration meant that white Mississippians turned almost unanimously to Republican Barry Goldwater. Goldwater's support for "constitutional government and local self-rule" meant that the absence from the ballot of "states' rights" parties or unpledged electors was unimportant. The Arizona Senator was one of only six Republicans to vote against the Civil Rights Act, and so the small electorate of Mississippi supported him almost unanimously.
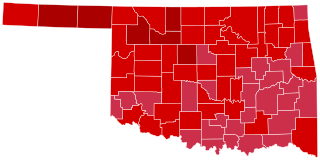
The 1972 United States presidential election in Oklahoma was held on November 7, 1972 as part of the 1972 United States presidential election. Voters chose eight electors, or representatives to the Electoral College, who voted for president and vice president.
The 1968 United States presidential election in Florida was held on November 5, 1968. Florida voters chose fourteen electors, or representatives to the Electoral College, who voted for president and vice president.
The 1968 United States presidential election in Tennessee took place on November 5, 1968. All 50 states and the District of Columbia were part of the 1968 United States presidential election. Tennessee voters chose 11 electors to the Electoral College, who voted for president and vice president.
The 1968 United States presidential election in Missouri took place on November 5, 1968. All 50 states and the District of Columbia were part of the 1968 United States presidential election. Voters chose 12 electors to the Electoral College, which selected the president and vice president.
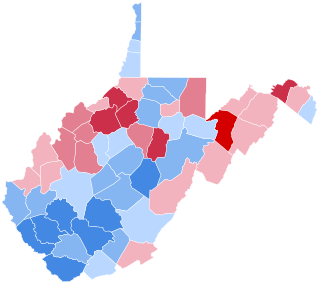
The 1968 United States presidential election in West Virginia took place on November 5, 1968, as part of the 1968 United States presidential election. West Virginia voters chose seven representatives, or electors, to the Electoral College, who voted for president and vice president.