| |||||||||||||||||
Turnout | 57.1% (voting eligible) [1] | ||||||||||||||||
---|---|---|---|---|---|---|---|---|---|---|---|---|---|---|---|---|---|
| |||||||||||||||||
Heller: 40–50% 50–60% 60–70% 70–80% Berkley: 40–50% 50–60% | |||||||||||||||||
|
See also: 2012 United States Senate elections
Elections in Nevada |
---|
Nevadaportal |
The 2012 United States Senate election in Nevada was held on Tuesday, November 6, 2012, concurrently with elections to the United States Senate in other states as well as elections to the United States House of Representatives and the 2012 presidential election. The primary election was held June 12, 2012.
Incumbent Republican U.S. Senator Dean Heller, who was appointed to his seat in May 2011 following the resignation of Senator John Ensign, was narrowly elected to his first full term over Representative Shelley Berkley, despite President Barack Obama carrying the state by 6.7% in the concurrent presidential election. As a result, Heller became the only Republican Senate candidate in 2012 to win in a state that was lost by the Republican presidential candidate. With a margin of 1.2%, this election was the second-closest race of the 2012 Senate election cycle, behind only the election in North Dakota. As of 2023 [update] , this is the last time that Republicans won a U.S. Senate election in Nevada.
Ensign was reelected to the United States Senate in 2006 against Jack Carter, son of former president Jimmy Carter, by a margin of 55–41%. His reelection campaign was expected to be complicated after it was revealed in 2009 that he had been involved in an extramarital affair with the wife of one of his campaign staffers, allegedly made payments to the woman's family and arranged work for her husband to cover himself. [2] [3]
The Senate Ethics Committee was to investigate Ensign, and his poll numbers declined significantly. [4] [5] There was speculation that he might resign before the election, but he initially said he would run for reelection. [6] On March 7, 2011, Ensign announced that he would not seek reelection, [7] and on April 22, he announced that he would resign effective May 3. [8]
Nevada Governor Brian Sandoval appointed U.S. Representative Dean Heller to fill the vacancy created by Ensign's resignation. Heller took office on May 9, 2011. [9]
Poll source | Date(s) administered | Sample size | Margin of error | Sharron Angle | John Chachas | John Ensign | Dean Heller | Brian Krolicki | Sue Lowden | Danny Tarkanian | Undecided |
---|---|---|---|---|---|---|---|---|---|---|---|
Public Policy Polling | January 3–5, 2011 | 400 | ±4.9% | 9% | 5% | 20% | 30% | 6% | 12% | 10% | 8% |
Poll source | Date(s) administered | Sample size | Margin of error | Sue Lowden | Brian Sandoval | Danny Tarkanian | Undecided |
---|---|---|---|---|---|---|---|
Mason-Dixon/LVJR | October 8, 2009 | 4% | 24% | 14% | 17% | 17% | 21% |
Poll source | Date(s) administered | Sample size | Margin of error | John Ensign | Dean Heller | Other | Undecided |
---|---|---|---|---|---|---|---|
Public Policy Polling | October 7–9, 2010 | 400 | ±4.9% | 45% | 37% | –– | 18% |
Public Policy Polling | January 3–5, 2011 | 400 | ±4.9% | 34% | 52% | –– | 13% |
Poll source | Date(s) administered | Sample size | Margin of error | John Ensign | Brian Krolicki | Other | Undecided |
---|---|---|---|---|---|---|---|
Public Policy Polling | October 7–9, 2010 | 400 | ±4.9% | 55% | 27% | –– | 18% |
Party | Candidate | Votes | % | |
---|---|---|---|---|
Republican | Dean Heller (incumbent) | 88,958 | 86.3 | |
Republican | Sherry Brooks | 5,356 | 5.2 | |
None of These Candidates | 3,358 | 3.3 | ||
Republican | Eddie "In Liberty" Hamilton | 2,628 | 2.6 | |
Republican | Richard Charles | 2,295 | 2.2 | |
Republican | Carlo "Nakusa" Poliak | 512 | 0.5 | |
Total votes | 103,107 | 100 |
Poll source | Date(s) administered | Sample size | Margin of error | Shelley Berkley | Byron Georgiou | Other | Undecided |
---|---|---|---|---|---|---|---|
Public Policy Polling | April 21–24, 2011 | 300 | ±5.7% | 65% | 8% | –– | 27% |
Public Policy Polling | July 28–31, 2011 | 400 | ±4.9% | 71% | 6% | –– | 23% |
Party | Candidate | Votes | % | |
---|---|---|---|---|
Democratic | Shelley Berkley | 62,081 | 79.5 | |
Democratic | Nancy Price | 4,210 | 5.4 | |
Democratic | Steve Brown | 3,998 | 5.1 | |
None of These Candidates | 3,637 | 4.7 | ||
Democratic | Barry Ellsworth | 2,491 | 3.2 | |
Democratic | Louis Macias | 1,714 | 2.2 | |
Total votes | 78,131 | 100 |
The first Berkley-Heller debate was on September 27, 2012. They met again in Las Vegas on October 11 and on Jon Ralston's "Face to Face" program on October 15.
Candidate (party) | Receipts | Disbursements | Cash on hand | Debt |
---|---|---|---|---|
Dean Heller (R) | $8,447,489 | $6,510,874 | $1,936,618 | $0 |
Shelley Berkley (D) | $8,779,074 | $8,947,424 | $924,918 | $0 |
Source: Federal Election Commission [22] |
Shelly Berkley | Contribution | Dean Heller | Contribution |
---|---|---|---|
EMILY's List | $93,049 | Las Vegas Sands | $43,750 |
NORPAC | $59,750 | MGM Resorts International | $35,500 |
MGM Resorts International | $53,700 | Alliance Resource Partners | $34,500 |
DaVita Inc. | $49,300 | Crow Holdings | $30,000 |
Diamond Resorts | $44,000 | Elliott Management Corporation | $29,413 |
Cantor Fitzgerald | $27,000 | Brady Industries | $25,000 |
Caesars Entertainment | $26,000 | Mewbourne Oil Co | $25,000 |
Fresenius Medical Care | $24,500 | Wynn Resorts | $22,500 |
Brownstein Hyatt Farber Schreck | $23,650 | Southwest Gas | $21,800 |
Station Casinos | $20,200 | Bank of America | $20,500 |
Shelley Berkley | Contribution | Dean Heller | Contribution |
---|---|---|---|
Lawyers/Law Firms | $607,407 | Leadership PACs | $379,718 |
Pro-Israel | $384,580 | Retired | $300,560 |
Health Professionals | $369,954 | Financial Institutions | $217,084 |
Women's Issues | $309,817 | Real Estate | $206,362 |
Leadership PACs | $292,500 | Casinos/Gambling | $205,832 |
Retired | $281,490 | Oil & Gas | $187,500 |
Real Estate | $261,779 | Insurance | $182,155 |
Financial Institutions | $228,393 | Lobbyists | $159,812 |
Casinos/Gambling | $227,350 | Mining | $149,745 |
Lobbyists | $175,147 | Health Professionals | $132,450 |
Source | Ranking | As of |
---|---|---|
The Cook Political Report [24] | Tossup | November 1, 2012 |
Inside Elections [25] | Tilt R | November 2, 2012 |
Sabato's Crystal Ball [26] | Lean R | November 5, 2012 |
Real Clear Politics [27] | Tossup | November 5, 2012 |
Graphs are unavailable due to technical issues. There is more info on Phabricator and on MediaWiki.org. |
Poll source | Date(s) administered | Sample size | Margin of error | Dean Heller (R) | Shelley Berkley (D) | Other | Undecided |
---|---|---|---|---|---|---|---|
Public Policy Polling | January 3–5, 2011 | 932 | ±3.2% | 51% | 38% | — | 16% |
Public Policy Polling | April 21–24, 2011 | 491 | ±4.4% | 47% | 43% | — | 10% |
Public Policy Polling | July 28–31, 2011 | 601 | ±4.0% | 46% | 43% | — | 12% |
Public Policy Polling | October 20–23, 2011 | 500 | ±4.4% | 45% | 45% | — | 10% |
Cannon Survey Center | December 12–20, 2011 | 600 | ±4.0% | 43% | 44% | — | 6.9% |
Rasmussen Reports | March 19, 2012 | 500 | ±4.5% | 47% | 40% | 2% | 11% |
Public Policy Polling | March 29 – April 1, 2012 | 553 | ±4.2% | 46% | 43% | — | 12% |
Rasmussen Reports | April 30, 2012 | 500 | ±4.5% | 51% | 40% | 2% | 8% |
NBC News/Marist | May 22–24, 2012 | 1,040 | ±3.0% | 46% | 44% | — | 10% |
Public Policy Polling | June 7–10, 2012 | 500 | ±4.4% | 44% | 43% | — | 13% |
Magellan Strategies | July 16–17, 2012 | 665 | ±3.8% | 45% | 42% | — | 13% |
Rasmussen Reports | July 24, 2012 | 500 | ±4.5% | 51% | 42% | 2% | 5% |
LVRJ/Survey USA | August 16–21, 2012 | 869 | ±3.4% | 44% | 39% | 9% | 8% |
Public Policy Polling | August 23–26, 2012 | 831 | ±3.4% | 47% | 45% | — | 8% |
Rasmussen Reports | September 18, 2012 | 500 | ±4.5% | 42% | 41% | 4% | 12% |
Public Policy Polling | September 18–20, 2012 | 501 | ±4.4% | 44% | 48% | — | 8% |
NBC/WSJ/Marist | September 23–25, 2012 | 984 | ±3.1% | 49% | 43% | 1% | 6% |
We Ask America | September 25–27, 2012 | 1,152 | ±3.1% | 45% | 45% | — | 10% |
Gravis Marketing | October 3, 2012 | 1,006 | ±3.1% | 53% | 36% | — | 12% |
Precision Opinion | October 6, 2012 | 1,521 | ±2.5% | 45% | 43% | — | 12% |
LVRJ/Survey USA | October 3–8, 2012 | 1,222 | ±2.9% | 47% | 39% | 8% | 6% |
Rasmussen Reports | October 8, 2012 | 500 | ±4.5% | 48% | 45% | 3% | 4% |
Suffolk Archived October 14, 2012, at the Wayback Machine | October 6–9, 2012 | 500 | ±4.4% | 40% | 37% | 7% | 14% |
Public Policy Polling | October 8–10, 2012 | 594 | ±4.0% | 47% | 44% | 4% | 5% |
LVRJ/Survey USA | October 11–15, 2012 | 806 | ±3.5% | 46% | 40% | 8% | 6% |
Rasmussen Reports | October 15, 2012 | 500 | ±4.5% | 50% | 43% | 4% | 3% |
Rasmussen Reports | October 23, 2012 | 500 | ±4.5% | 50% | 45% | 1% | 4% |
Public Policy Polling | October 22–24, 2012 | 636 | ±3.9% | 44% | 44% | 7% | 5% |
NBC/WSJ/Marist | October 23–24, 2012 | 1,042 | ±2.8% | 48% | 45% | 2% | 6% |
LVRJ/SurveyUSA | October 23–29, 2012 | 1,212 | ±2.9% | 46% | 40% | 10% | 4% |
Public Policy Polling | November 3–4, 2012 | 750 | ±3.6% | 48% | 46% | 4% | 1% |
Poll source | Date(s) administered | Sample size | Margin of error | Dean Heller (R) | Byron Georgiou (D) | Other | Undecided |
---|---|---|---|---|---|---|---|
Public Policy Polling | April 21–24, 2011 | 491 | ±4.4% | 52% | 28% | –– | 20% |
Magellan Strategies (R) Archived July 12, 2011, at the Wayback Machine | June 21–22, 2011 | 720 | ±3.65% | 46% | 33% | –– | 21% |
Public Policy Polling | July 28–31, 2011 | 601 | ±4.0% | 48% | 31% | –– | 20% |
Poll source | Date(s) administered | Sample size | Margin of error | Dean Heller (R) | Oscar Goodman (D) | Other | Undecided |
---|---|---|---|---|---|---|---|
Public Policy Polling | January 3–5, 2011 | 932 | ±3.2% | 45% | 38% | –– | 16% |
Poll source | Date(s) administered | Sample size | Margin of error | Dean Heller (R) | Catherine Cortez Masto (D) | Other | Undecided |
---|---|---|---|---|---|---|---|
Public Policy Polling | January 3–5, 2011 | 932 | ±3.2% | 46% | 37% | –– | 16% |
Poll source | Date(s) administered | Sample size | Margin of error | Dean Heller (R) | Ross Miller (D) | Other | Undecided |
---|---|---|---|---|---|---|---|
Public Policy Polling | January 3–5, 2011 | 932 | ±3.2% | 46% | 34% | –– | 21% |
Poll source | Date(s) administered | Sample size | Margin of error | John Ensign (R) | Shelley Berkley (D) | Other | Undecided |
---|---|---|---|---|---|---|---|
Public Policy Polling [ permanent dead link ] | January 11–12, 2010 | 763 | ±3.6% | 49% | 40% | –– | 11% |
Public Policy Polling | January 3–5, 2011 | 932 | ±3.2% | 42% | 45% | –– | 13% |
Poll source | Date(s) administered | Sample size | Margin of error | John Ensign (R) | Catherine Cortez Masto (D) | Other | Undecided |
---|---|---|---|---|---|---|---|
Public Policy Polling | July 16–18, 2010 | 630 | ±3.9% | 48% | 38% | –– | 14% |
Public Policy Polling | January 3–5, 2011 | 932 | ±3.2% | 42% | 44% | –– | 14% |
Poll source | Date(s) administered | Sample size | Margin of error | John Ensign (R) | Oscar Goodman (D) | Other | Undecided |
---|---|---|---|---|---|---|---|
Public Policy Polling [ permanent dead link ] | January 11–12, 2010 | 763 | ±3.6% | 43% | 41% | –– | 16% |
Public Policy Polling | January 3–5, 2011 | 932 | ±3.2% | 35% | 45% | –– | 20% |
Poll source | Date(s) administered | Sample size | Margin of error | John Ensign (R) | Ross Miller (D) | Other | Undecided |
---|---|---|---|---|---|---|---|
Public Policy Polling [ permanent dead link ] | January 11–12, 2010 | 763 | ±3.6% | 47% | 36% | –– | 18% |
Public Policy Polling | January 3–5, 2011 | 932 | ±3.2% | 39% | 40% | –– | 21% |
Poll source | Date(s) administered | Sample size | Margin of error | John Ensign (R) | Dina Titus (D) | Other | Undecided |
---|---|---|---|---|---|---|---|
Public Policy Polling | July 16–18, 2010 | 630 | ±3.9% | 51% | 41% | –– | 8% |
Party | Candidate | Votes | % | ±% | |
---|---|---|---|---|---|
Republican | Dean Heller (incumbent) | 457,656 | 45.87% | -9.49% | |
Democratic | Shelley Berkley | 446,080 | 44.71% | +3.72% | |
Independent American | David Lory VanDerBeek | 48,792 | 4.89% | +3.56% | |
None of These Candidates | 45,277 | 4.54% | +3.13% | ||
Total votes | 997,805 | 100.0% | N/A | ||
Republican hold | |||||
Heller won 2 of 4 congressional districts. [29]
District | Berkley | Heller | Representative |
---|---|---|---|
1st | 58.57% | 31.6% | Dina Titus |
2nd | 34.27% | 55.83% | Mark Amodei |
3rd | 43.34% | 47.93% | Joe Heck |
4th | 48.26% | 42.38% | Steven Horsford |
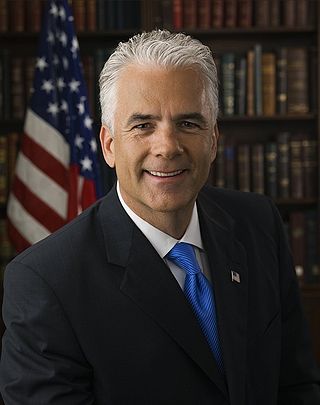
John Eric Ensign is an American veterinarian and former politician who served as a United States Senator from Nevada from 2001 until his resignation in 2011 amid a Senate Ethics Committee investigation into his attempts to hide an extramarital affair. A member of the Republican Party, Ensign previously represented Nevada's 1st congressional district in the House of Representatives from 1995 to 1999. Following his resignation from the Senate, Ensign returned to Nevada and resumed his career as a veterinarian.
Rochelle "Shelley" Berkley is an American businesswoman, politician and attorney who served as the U.S. Representative for Nevada's 1st congressional district from 1999 to 2013. In 2012, she was the unsuccessful Democratic Party nominee for the U.S. Senate. She is a member of the Democratic Party, and is currently running in the 2024 Las Vegas mayoral election.
Dean Arthur Heller is an American businessman and politician who served as a United States senator representing Nevada from 2011 to 2019. A member of the Republican Party, he served as the 15th secretary of state of Nevada from 1995 to 2007 and U.S. representative for Nevada's 2nd congressional district from 2007 to 2011. He was appointed to the U.S. Senate by Governor Brian Sandoval and elected to a full term in the 2012 election. Heller unsuccessfully ran for a second term in 2018, losing to Democrat Jacky Rosen. He was an unsuccessful candidate for governor of Nevada in 2022.
Catherine Marie Cortez Masto is an American lawyer and politician serving as the senior United States senator from Nevada, a seat she has held since 2017. A member of the Democratic Party, Cortez Masto served as the 32nd attorney general of Nevada from 2007 to 2015.
The 1998 United States Senate election in Nevada was held on November 3, 1998. Incumbent Democratic Senator Harry Reid won re-election to a third term by a margin of less than 0.1% and 401 votes, making this the closest race of the 1998 Senate election cycle.
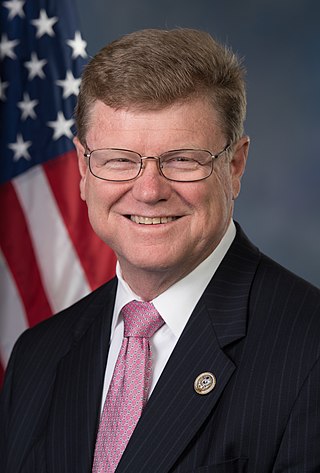
Mark Eugene Amodei is an American lawyer and politician serving as the U.S. representative for Nevada's 2nd congressional district since 2011. The only Republican in Nevada's congressional delegation since 2019, Amodei served in the Nevada Assembly from 1997 to 1999 and in the Nevada Senate, representing the Capital District, from 1999 to 2011. Amodei is generally considered a moderate Republican, supporting programs such as DACA throughout his tenure.
The 2008 congressional elections in Nevada were held on November 4, 2008, to determine who will represent the state of Nevada in the United States House of Representatives, coinciding with the presidential election. The election coincided with the 2008 U.S. presidential election. Representatives are elected for two-year terms; those elected served in the 111th Congress from January 3, 2009 until January 3, 2011.
Elections were held in Nevada on November 2, 2010, for one seat in the U.S. Senate, three seats in the U.S. House of Representatives, the office of Governor of Nevada, and other state and local officials. Primary elections took place on June 8, 2010.
The 2010 House elections in Nevada occurred on November 2, 2010, to elect the members of the State of Nevada's delegation to the United States House of Representatives. Representatives are elected for two-year terms; the elected served in the 112th Congress from January 3, 2011, until January 3, 2013. Nevada has three seats in the House, apportioned according to the 2000 United States census.
The 2012 United States House of Representatives elections in Nevada were held on Tuesday, November 6, 2012 and elected the four U.S. Representatives from Nevada, one from each of the state's four congressional districts, an increase of one seat in reapportionment following the 2010 United States census. Representatives are elected for two-year terms; those elected will serve in the 112th Congress from January 2013 until January 2015. The elections coincided with the elections of other federal and state offices, including a quadrennial presidential election, and an election to the U.S. Senate. Primary elections were held on June 12, 2012.
On September 13, 2011, a special election was held in Nevada's 2nd congressional district to fill the vacancy created by the resignation of Republican Dean Heller, who was appointed to the United States Senate.
Nevada's 2012 general elections were held on November 6, 2012. Primary elections were held on June 12, 2012.
The 2014 Nevada gubernatorial election was held on Tuesday, November 4, 2014, to elect the Governor of Nevada. Incumbent Republican governor Brian Sandoval won re-election to a second term in office, defeating Democratic nominee Bob Goodman in a landslide. Sandoval won a higher percentage of the vote than any other incumbent governor in 2014.
The 2016 United States Senate election in Nevada was held November 8, 2016 to elect a member of the United States Senate to represent the State of Nevada, concurrently with the 2016 U.S. presidential election, as well as other elections to the United States Senate in other states and elections to the United States House of Representatives and various state and local elections. The state primary election was held June 14, 2016.
The Nevada general election, 2014 was held on Tuesday, November 4, 2014, throughout Nevada.
The 2016 United States House of Representatives elections in Nevada were held on November 8, 2016, to elect the four U.S. representatives from the state of Nevada, one from each of the state's four congressional districts. The elections coincided with the 2016 U.S. presidential election, as well as other elections to the House of Representatives, elections to the United States Senate and various state and local elections. The primaries took place on June 14.
The 2018 Nevada gubernatorial election took place on November 6, 2018, to elect the next governor of Nevada. Incumbent Republican Governor Brian Sandoval was ineligible to run for re-election, due to the absolute two-term limit established by the Nevada Constitution. Nevada is one of eight U.S. states that prohibits its governors or any other state and territorial executive branch officials from serving more than two terms, even if they are nonconsecutive.
The 2018 United States Senate election in Nevada took place November 6, 2018, to elect one of two U.S. senators from Nevada. Incumbent Republican senator Dean Heller lost re-election to a second full term, being defeated by Democratic nominee Jacky Rosen.
The Nevada general election, 2018 was held on Tuesday, November 6, 2018 throughout Nevada.
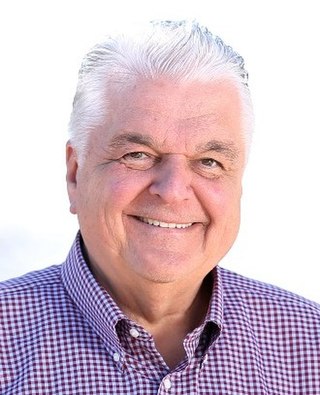
The 2022 Nevada gubernatorial election took place on November 8, 2022, to elect the governor of Nevada. Incumbent Democratic governor Steve Sisolak lost his bid for re-election to a second term to Republican Clark County Sheriff Joe Lombardo.